The document contains charts and tables showing financial data for the Ashland Aqualon Functional Ingredients and Ashland Hercules Water Technologies divisions of Ashland from 2005 to 2009. It shows metrics like average sales and revenue per month and shipping day, total monthly revenue, volume of product shipped, and gross profit percentages. The data demonstrates generally increasing revenue, sales, volumes and gross profits for both divisions over the time period.
Jenny Rebholz and I love talking to, motivating and helping all higher education students. But naturally, we are most passionate about helping interior design graduates succeed in their professional careers. That's why we make time to talk to last year design students about the importance of establishing their Personal Brand.
Discussing the state of industry, the changes the industry has gone through and is still undergoing, and how it all influences the profession of interior design, job opportunities and long-term career goals for young professionals.
how can I sell pi coins after successfully completing KYCDOT TECH
Pi coins is not launched yet in any exchange 💱 this means it's not swappable, the current pi displaying on coin market cap is the iou version of pi. And you can learn all about that on my previous post.
RIGHT NOW THE ONLY WAY you can sell pi coins is through verified pi merchants. A pi merchant is someone who buys pi coins and resell them to exchanges and crypto whales. Looking forward to hold massive quantities of pi coins before the mainnet launch.
This is because pi network is not doing any pre-sale or ico offerings, the only way to get my coins is from buying from miners. So a merchant facilitates the transactions between the miners and these exchanges holding pi.
I and my friends has sold more than 6000 pi coins successfully with this method. I will be happy to share the contact of my personal pi merchant. The one i trade with, if you have your own merchant you can trade with them. For those who are new.
Message: @Pi_vendor_247 on telegram.
I wouldn't advise you selling all percentage of the pi coins. Leave at least a before so its a win win during open mainnet. Have a nice day pioneers ♥️
#kyc #mainnet #picoins #pi #sellpi #piwallet
#pinetwork
USDA Loans in California: A Comprehensive Overview.pptxmarketing367770
USDA Loans in California: A Comprehensive Overview
If you're dreaming of owning a home in California's rural or suburban areas, a USDA loan might be the perfect solution. The U.S. Department of Agriculture (USDA) offers these loans to help low-to-moderate-income individuals and families achieve homeownership.
Key Features of USDA Loans:
Zero Down Payment: USDA loans require no down payment, making homeownership more accessible.
Competitive Interest Rates: These loans often come with lower interest rates compared to conventional loans.
Flexible Credit Requirements: USDA loans have more lenient credit score requirements, helping those with less-than-perfect credit.
Guaranteed Loan Program: The USDA guarantees a portion of the loan, reducing risk for lenders and expanding borrowing options.
Eligibility Criteria:
Location: The property must be located in a USDA-designated rural or suburban area. Many areas in California qualify.
Income Limits: Applicants must meet income guidelines, which vary by region and household size.
Primary Residence: The home must be used as the borrower's primary residence.
Application Process:
Find a USDA-Approved Lender: Not all lenders offer USDA loans, so it's essential to choose one approved by the USDA.
Pre-Qualification: Determine your eligibility and the amount you can borrow.
Property Search: Look for properties in eligible rural or suburban areas.
Loan Application: Submit your application, including financial and personal information.
Processing and Approval: The lender and USDA will review your application. If approved, you can proceed to closing.
USDA loans are an excellent option for those looking to buy a home in California's rural and suburban areas. With no down payment and flexible requirements, these loans make homeownership more attainable for many families. Explore your eligibility today and take the first step toward owning your dream home.
Falcon stands out as a top-tier P2P Invoice Discounting platform in India, bridging esteemed blue-chip companies and eager investors. Our goal is to transform the investment landscape in India by establishing a comprehensive destination for borrowers and investors with diverse profiles and needs, all while minimizing risk. What sets Falcon apart is the elimination of intermediaries such as commercial banks and depository institutions, allowing investors to enjoy higher yields.
how to sell pi coins in South Korea profitably.DOT TECH
Yes. You can sell your pi network coins in South Korea or any other country, by finding a verified pi merchant
What is a verified pi merchant?
Since pi network is not launched yet on any exchange, the only way you can sell pi coins is by selling to a verified pi merchant, and this is because pi network is not launched yet on any exchange and no pre-sale or ico offerings Is done on pi.
Since there is no pre-sale, the only way exchanges can get pi is by buying from miners. So a pi merchant facilitates these transactions by acting as a bridge for both transactions.
How can i find a pi vendor/merchant?
Well for those who haven't traded with a pi merchant or who don't already have one. I will leave the telegram id of my personal pi merchant who i trade pi with.
Tele gram: @Pi_vendor_247
#pi #sell #nigeria #pinetwork #picoins #sellpi #Nigerian #tradepi #pinetworkcoins #sellmypi
The secret way to sell pi coins effortlessly.DOT TECH
Well as we all know pi isn't launched yet. But you can still sell your pi coins effortlessly because some whales in China are interested in holding massive pi coins. And they are willing to pay good money for it. If you are interested in selling I will leave a contact for you. Just telegram this number below. I sold about 3000 pi coins to him and he paid me immediately.
Telegram: @Pi_vendor_247
If you are looking for a pi coin investor. Then look no further because I have the right one he is a pi vendor (he buy and resell to whales in China). I met him on a crypto conference and ever since I and my friends have sold more than 10k pi coins to him And he bought all and still want more. I will drop his telegram handle below just send him a message.
@Pi_vendor_247
what is the best method to sell pi coins in 2024DOT TECH
The best way to sell your pi coins safely is trading with an exchange..but since pi is not launched in any exchange, and second option is through a VERIFIED pi merchant.
Who is a pi merchant?
A pi merchant is someone who buys pi coins from miners and pioneers and resell them to Investors looking forward to hold massive amounts before mainnet launch in 2026.
I will leave the telegram contact of my personal pi merchant to trade pi coins with.
@Pi_vendor_247
Even tho Pi network is not listed on any exchange yet.
Buying/Selling or investing in pi network coins is highly possible through the help of vendors. You can buy from vendors[ buy directly from the pi network miners and resell it]. I will leave the telegram contact of my personal vendor.
@Pi_vendor_247
how to sell pi coins effectively (from 50 - 100k pi)DOT TECH
Anywhere in the world, including Africa, America, and Europe, you can sell Pi Network Coins online and receive cash through online payment options.
Pi has not yet been launched on any exchange because we are currently using the confined Mainnet. The planned launch date for Pi is June 28, 2026.
Reselling to investors who want to hold until the mainnet launch in 2026 is currently the sole way to sell.
Consequently, right now. All you need to do is select the right pi network provider.
Who is a pi merchant?
An individual who buys coins from miners on the pi network and resells them to investors hoping to hang onto them until the mainnet is launched is known as a pi merchant.
debuts.
I'll provide you the Telegram username
@Pi_vendor_247
Poonawalla Fincorp and IndusInd Bank Introduce New Co-Branded Credit Cardnickysharmasucks
The unveiling of the IndusInd Bank Poonawalla Fincorp eLITE RuPay Platinum Credit Card marks a notable milestone in the Indian financial landscape, showcasing a successful partnership between two leading institutions, Poonawalla Fincorp and IndusInd Bank. This co-branded credit card not only offers users a plethora of benefits but also reflects a commitment to innovation and adaptation. With a focus on providing value-driven and customer-centric solutions, this launch represents more than just a new product—it signifies a step towards redefining the banking experience for millions. Promising convenience, rewards, and a touch of luxury in everyday financial transactions, this collaboration aims to cater to the evolving needs of customers and set new standards in the industry.
NO1 Uk Black Magic Specialist Expert In Sahiwal, Okara, Hafizabad, Mandi Bah...Amil Baba Dawood bangali
Contact with Dawood Bhai Just call on +92322-6382012 and we'll help you. We'll solve all your problems within 12 to 24 hours and with 101% guarantee and with astrology systematic. If you want to take any personal or professional advice then also you can call us on +92322-6382012 , ONLINE LOVE PROBLEM & Other all types of Daily Life Problem's.Then CALL or WHATSAPP us on +92322-6382012 and Get all these problems solutions here by Amil Baba DAWOOD BANGALI
#vashikaranspecialist #astrologer #palmistry #amliyaat #taweez #manpasandshadi #horoscope #spiritual #lovelife #lovespell #marriagespell#aamilbabainpakistan #amilbabainkarachi #powerfullblackmagicspell #kalajadumantarspecialist #realamilbaba #AmilbabainPakistan #astrologerincanada #astrologerindubai #lovespellsmaster #kalajaduspecialist #lovespellsthatwork #aamilbabainlahore#blackmagicformarriage #aamilbaba #kalajadu #kalailam #taweez #wazifaexpert #jadumantar #vashikaranspecialist #astrologer #palmistry #amliyaat #taweez #manpasandshadi #horoscope #spiritual #lovelife #lovespell #marriagespell#aamilbabainpakistan #amilbabainkarachi #powerfullblackmagicspell #kalajadumantarspecialist #realamilbaba #AmilbabainPakistan #astrologerincanada #astrologerindubai #lovespellsmaster #kalajaduspecialist #lovespellsthatwork #aamilbabainlahore #blackmagicforlove #blackmagicformarriage #aamilbaba #kalajadu #kalailam #taweez #wazifaexpert #jadumantar #vashikaranspecialist #astrologer #palmistry #amliyaat #taweez #manpasandshadi #horoscope #spiritual #lovelife #lovespell #marriagespell#aamilbabainpakistan #amilbabainkarachi #powerfullblackmagicspell #kalajadumantarspecialist #realamilbaba #AmilbabainPakistan #astrologerincanada #astrologerindubai #lovespellsmaster #kalajaduspecialist #lovespellsthatwork #aamilbabainlahore #Amilbabainuk #amilbabainspain #amilbabaindubai #Amilbabainnorway #amilbabainkrachi #amilbabainlahore #amilbabaingujranwalan #amilbabainislamabad
US Economic Outlook - Being Decided - M Capital Group August 2021.pdfpchutichetpong
The U.S. economy is continuing its impressive recovery from the COVID-19 pandemic and not slowing down despite re-occurring bumps. The U.S. savings rate reached its highest ever recorded level at 34% in April 2020 and Americans seem ready to spend. The sectors that had been hurt the most by the pandemic specifically reduced consumer spending, like retail, leisure, hospitality, and travel, are now experiencing massive growth in revenue and job openings.
Could this growth lead to a “Roaring Twenties”? As quickly as the U.S. economy contracted, experiencing a 9.1% drop in economic output relative to the business cycle in Q2 2020, the largest in recorded history, it has rebounded beyond expectations. This surprising growth seems to be fueled by the U.S. government’s aggressive fiscal and monetary policies, and an increase in consumer spending as mobility restrictions are lifted. Unemployment rates between June 2020 and June 2021 decreased by 5.2%, while the demand for labor is increasing, coupled with increasing wages to incentivize Americans to rejoin the labor force. Schools and businesses are expected to fully reopen soon. In parallel, vaccination rates across the country and the world continue to rise, with full vaccination rates of 50% and 14.8% respectively.
However, it is not completely smooth sailing from here. According to M Capital Group, the main risks that threaten the continued growth of the U.S. economy are inflation, unsettled trade relations, and another wave of Covid-19 mutations that could shut down the world again. Have we learned from the past year of COVID-19 and adapted our economy accordingly?
“In order for the U.S. economy to continue growing, whether there is another wave or not, the U.S. needs to focus on diversifying supply chains, supporting business investment, and maintaining consumer spending,” says Grace Feeley, a research analyst at M Capital Group.
While the economic indicators are positive, the risks are coming closer to manifesting and threatening such growth. The new variants spreading throughout the world, Delta, Lambda, and Gamma, are vaccine-resistant and muddy the predictions made about the economy and health of the country. These variants bring back the feeling of uncertainty that has wreaked havoc not only on the stock market but the mindset of people around the world. MCG provides unique insight on how to mitigate these risks to possibly ensure a bright economic future.
1. 1
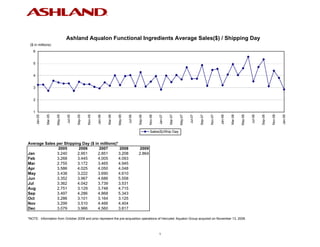
Ashland Aqualon Functional Ingredients Average Sales($) / Shipping Day
($ in millions)
6
5
4
3
2
1
May-05
May-06
May-07
May-08
Nov-05
Nov-06
Nov-07
Nov-08
Mar-05
Mar-06
Mar-07
Mar-08
Jan-05
Jul-05
Sep-05
Jan-06
Jul-06
Sep-06
Jan-07
Jul-07
Sep-07
Jan-08
Jul-08
Sep-08
Jan-09
Sales($)/Ship Day
Average Sales per Shipping Day ($ in millions)*
2005 2006 2007 2008 2009
Jan 3.240 2.951 2.851 3.208 2.864
Feb 3.268 3.445 4.005 4.093
Mar 2.755 3.172 3.465 4.945
Apr 3.586 4.025 4.050 4.048
May 3.438 3.222 3.690 4.610
Jun 3.352 3.967 4.686 5.558
Jul 3.362 4.042 3.739 3.531
Aug 2.751 3.129 3.748 4.715
Sep 3.497 4.286 4.868 5.343
Oct 3.286 3.101 3.164 3.125
Nov 3.299 3.510 4.466 4.404
Dec 3.079 3.966 4.560 3.817
*NOTE: Information from October 2008 and prior represent the pre-acquisition operations of Hercules' Aqualon Group acquired on November 13, 2008.
1
2. 2
Ashland Aqualon Functional Ingredients Revenue
($ in millions)
130
120
110
100
90
80
70
60
50
40
May-05
May-06
May-07
May-08
Nov-05
Nov-06
Nov-07
Nov-08
Mar-05
Mar-06
Mar-07
Mar-08
Jan-05
Jul-05
Sep-05
Jan-06
Jul-06
Sep-06
Jan-07
Jul-07
Sep-07
Jan-08
Jul-08
Sep-08
Jan-09
Monthly Sales 12 Month Rolling Average
Monthly Sales ($ in millions)* 12 Month Rolling Average ($ in millions)*
2005 2006 2007 2008 2009 2005 2006 2007 2008 2009
Jan 64.8 62.0 62.7 70.6 60.1 Jan 65.8 67.5 74.3 82.8 89.0
Feb 65.4 68.9 80.1 86.0 Feb 65.8 67.8 75.2 83.3
Mar 60.6 73.0 76.2 98.9 Mar 65.9 68.8 75.5 85.2
Apr 75.3 76.5 81.0 89.1 Apr 66.2 68.8 76.7 87.1
May 72.2 70.9 81.2 96.8 May 66.2 68.8 76.7 87.1
Jun 73.7 87.3 98.4 116.7 Jun 66.7 69.9 77.7 88.7
Jul 67.2 80.8 78.5 77.7 Jul 66.5 71.0 77.5 88.6
Aug 63.3 72.0 86.2 99.0 Aug 66.5 71.8 78.7 89.7
Sep 73.4 85.7 92.5 112.2 Sep 67.2 72.8 79.2 91.3
Oct 69.0 68.2 72.8 71.9 Oct 67.2 72.7 79.6 91.2
Nov 66.0 70.2 89.3 79.3 Nov 67.9 73.1 81.2 90.4
Dec 61.6 75.3 86.6 80.1 Dec 67.7 74.2 82.1 89.9
*NOTE: Information from October 2008 and prior represent the pre-acquisition operations of Hercules' Aqualon Group acquired on November 13, 2008. The 12 month
rolling sales average will continue to include pre-acquisition results through November 2009.
2
3. 3
Ashland Aqualon Functional Ingredients Volume in Metric Tons
(in thousands)
24
22
20
18
16
14
12
10
May-05
May-06
May-07
May-08
Nov-05
Nov-06
Nov-07
Nov-08
Mar-05
Mar-06
Mar-07
Mar-08
Jan-05
Jul-05
Sep-05
Jan-06
Jul-06
Sep-06
Jan-07
Jul-07
Sep-07
Jan-08
Jul-08
Sep-08
Jan-09
Metric Tons 12 Month Rolling Average
Metric Tons (in thousands)* 12 Month Rolling Average (in thousands)*
2005 2006 2007 2008 2009 2005 2006 2007 2008 2009
Jan 14.2 12.2 12.8 13.7 11.3 Jan 15.2 14.8 15.2 16.5 16.7
Feb 14.4 13.4 15.4 16.5 Feb 15.2 14.8 15.4 16.6
Mar 13.5 15.2 14.5 18.4 Mar 15.2 14.9 15.3 16.9
Apr 16.3 15.5 15.9 16.8 Apr 15.1 14.8 15.5 17.1
May 15.4 14.6 16.2 18.0 May 15.1 14.8 15.5 17.1
Jun 16.2 18.0 19.3 21.7 Jun 15.1 14.9 15.6 17.3
Jul 14.5 16.7 16.0 15.1 Jul 14.9 15.1 15.5 17.3
Aug 14.2 14.8 18.1 17.9 Aug 14.9 15.1 15.8 17.2
Sep 15.8 17.5 18.7 20.2 Sep 14.9 15.3 15.9 17.4
Oct 16.0 14.1 14.5 13.3 Oct 14.9 15.1 15.9 17.3
Nov 15.1 14.6 18.3 15.2 Nov 15.1 15.1 16.3 17.0
Dec 14.3 15.2 17.2 15.8 Dec 15.0 15.2 16.4 16.9
*NOTE: Information from October 2008 and prior represent the pre-acquisition operations of Hercules' Aqualon Group acquired on November 13, 2008. The 12 month rolling average
will continue to include pre-acquisition results through November 2009.
3
4. 4
Ashland Hercules Water Technologies Average Sales($) / Shipping Day
($ in millions)
8
7
6
5
4
3
2
1
May-05
May-06
May-07
May-08
Nov-05
Nov-06
Nov-07
Nov-08
Mar-05
Mar-06
Mar-07
Mar-08
Jan-05
Jul-05
Sep-05
Jan-06
Jul-06
Sep-06
Jan-07
Jul-07
Sep-07
Jan-08
Jul-08
Sep-08
Jan-09
Sales($)/Ship Day
Average Sales per Shipping Day ($ in millions)*
2005 2006 2007 2008 2009
Jan 1.606 1.554 3.038 3.351 6.826
Feb 1.532 1.679 3.064 3.403
Mar 1.507 1.475 2.797 3.613
Apr 1.622 1.938 3.299 3.767
May 1.560 1.554 3.079 3.662
Jun 1.536 1.912 3.193 4.022
Jul 1.666 3.046 3.238 3.720
Aug 1.520 2.793 4.209 3.251
Sep 1.744 3.310 4.420 3.598
Oct 1.509 2.677 3.077 3.090
Nov 1.639 2.853 3.467 5.994
Dec 1.614 3.297 3.445 6.640
*NOTE: Information from October 2008 and prior does not include the Paper Technologies and Ventures operations of Hercules acquired on November 13, 2008. August and
September 2007 information (and 3 and 12 month rolling averages that contain August and September 2007 information) is affected by the 13 month foreign reporting impact described
on the Business Fundamentals page of this website. In May 2006 Ashland acquired the water treatment business of Degussa AG.
4
5. 5
Ashland Hercules Water Technologies Revenue
($ in millions)
160
140
120
100
80
60
40
20
May-05
May-06
May-07
May-08
Nov-05
Nov-06
Nov-07
Nov-08
Mar-05
Mar-06
Mar-07
Mar-08
Jan-05
Jul-05
Sep-05
Jan-06
Jul-06
Sep-06
Jan-07
Jul-07
Sep-07
Jan-08
Jul-08
Sep-08
Jan-09
Monthly Sales 12 Month Rolling Average
Monthly Sales ($ in millions)* 12 Month Rolling Average ($ in millions)*
2005 2006 2007 2008 2009 2005 2006 2007 2008 2009
Jan 32.1 32.6 66.8 73.7 147.3 Jan 31.0 33.2 51.4 71.0 89.9
Feb 30.6 33.6 61.3 71.5 Feb 31.2 33.5 53.8 71.8
Mar 33.2 33.9 61.5 72.3 Mar 31.3 33.5 56.1 72.7
Apr 34.1 36.8 66.0 82.9 Apr 31.5 33.8 58.5 74.1
May 32.8 34.2 67.7 76.9 May 31.8 33.9 61.3 74.9
Jun 33.8 42.1 67.1 84.5 Jun 32.1 34.6 63.4 76.3
Jul 33.3 60.9 68.0 81.8 Jul 32.2 36.9 64.0 77.5
Aug 35.0 64.2 96.8 68.3 Aug 32.5 39.3 66.7 75.1
Sep 36.6 66.2 84.0 75.6 Sep 32.9 41.8 68.2 74.4
Oct 31.7 58.9 70.8 71.1 Oct 33.0 44.0 69.1 74.4
Nov 32.8 57.1 69.3 107.9 Nov 33.2 46.1 70.2 77.7
Dec 32.3 62.6 65.4 139.4 Dec 33.2 48.6 70.4 83.8
*NOTE: Information from October 2008 and prior does not include the Paper Technologies and Ventures operations of Hercules acquired on November 13, 2008. August
and September 2007 information (and 3 and 12 month rolling averages that contain August and September 2007 information) is affected by the 13 month foreign reporting
impact described on the Business Fundamentals page of this website. In May 2006 Ashland acquired the water treatment business of Degussa AG.
5
6. 6
Ashland Hercules Water Technologies Gross Profit %
%
50.0
45.0
40.0
35.0
30.0
25.0
May-05
May-06
May-07
May-08
Nov-05
Nov-06
Nov-07
Nov-08
Mar-05
Mar-06
Mar-07
Mar-08
Jan-05
Jul-05
Sep-05
Jan-06
Jul-06
Sep-06
Jan-07
Jul-07
Sep-07
Jan-08
Jul-08
Sep-08
Jan-09
3 Month Rolling Average 12 Month Rolling Average
3 Month Rolling Average (%)* 12 Month Rolling Average (%)*
2005 2006 2007 2008 2009 2005 2006 2007 2008 2009
Jan 49.0 48.2 39.1 38.1 30.5 Jan 48.8 47.6 41.0 39.0 34.0
Feb 49.4 47.5 38.4 36.4 Feb 48.7 47.4 40.5 38.7
Mar 48.0 47.2 38.8 37.3 Mar 48.5 47.4 40.2 38.6
Apr 48.2 46.8 39.6 36.9 Apr 48.5 47.2 39.8 38.3
May 47.5 46.6 39.6 37.8 May 48.2 47.2 39.4 38.3
Jun 46.9 45.5 38.2 37.2 Jun 48.0 46.9 38.9 38.4
Jul 46.6 42.3 39.3 37.1 Jul 47.9 45.7 39.2 37.8
Aug 47.2 39.6 39.0 36.2 Aug 47.9 44.5 39.2 37.5
Sep 47.2 38.4 39.7 32.9 Sep 47.8 43.7 39.2 36.7
Oct 47.4 38.7 39.0 33.0 Oct 47.7 43.0 39.3 36.3
Nov 47.5 39.9 39.8 31.5 Nov 47.9 42.4 39.2 35.3
Dec 48.5 40.3 39.3 32.5 Dec 47.6 41.9 39.0 34.8
*NOTE: Information from October 2008 and prior does not include the Paper Technologies and Ventures operations of Hercules acquired on November 13, 2008. The
calculated gross profit percentages for November and December of 2008 exclude the impact of purchase accounting inventory step-up adjustments. August and September
2007 information (and 3 and 12 month rolling averages that contain August and September 2007 information) is affected by the 13 month foreign reporting impact described on
the Business Fundamentals page of this website. In May 2006 Ashland acquired the water treatment business of Degussa AG.
6
7. 7
Ashland Performance Materials Average Sales($) / Shipping Day
($ in millions)
10
9
8
7
6
5
4
3
May-05
May-06
May-07
May-08
Nov-05
Nov-06
Nov-07
Nov-08
Mar-05
Mar-06
Mar-07
Mar-08
Jan-05
Jul-05
Sep-05
Jan-06
Jul-06
Sep-06
Jan-07
Jul-07
Sep-07
Jan-08
Jul-08
Sep-08
Jan-09
Sales($)/Ship Day
Average Sales per Shipping Day ($ in millions)*
2005 2006 2007 2008 2009
Jan 5.176 5.258 6.061 6.040 4.403
Feb 5.593 5.816 5.593 6.446
Mar 5.570 5.200 5.965 6.494
Apr 5.989 6.156 6.637 6.552
May 6.183 5.641 6.112 6.741
Jun 5.812 5.845 6.313 6.612
Jul 5.425 5.886 6.073 6.889
Aug 5.293 5.501 6.642 6.254
Sep 5.264 5.663 8.307 6.867
Oct 5.955 6.083 5.968 6.074
Nov 6.030 6.149 6.642 5.872
Dec 5.305 5.800 5.318 3.738
*NOTE: August and September 2007 information (and 3 and 12 month rolling averages that contain August and September 2007 information) is affected by the 13 month foreign
reporting impact described on the Business Fundamentals page of this website.
7
8. 8
Ashland Performance Materials Revenue
($ in millions)
175
150
125
100
75
May-05
May-06
May-07
May-08
Nov-05
Nov-06
Nov-07
Nov-08
Mar-05
Mar-06
Mar-07
Mar-08
Jan-05
Jul-05
Sep-05
Jan-06
Jul-06
Sep-06
Jan-07
Jul-07
Sep-07
Jan-08
Jul-08
Sep-08
Jan-09
Monthly Sales 12 Month Rolling Average
Monthly Sales ($ in millions)* 12 Month Rolling Average ($ in millions)*
2005 2006 2007 2008 2009 2005 2006 2007 2008 2009
Jan 103.5 110.4 133.3 132.9 92.5 Jan 94.3 118.4 121.9 132.1 127.8
Feb 111.9 116.3 111.6 135.4 Feb 96.5 118.8 121.5 134.0
Mar 122.5 119.6 131.2 129.9 Mar 99.4 118.5 122.4 133.9
Apr 125.8 117.0 132.7 144.2 Apr 102.3 117.8 123.8 134.9
May 129.9 124.1 134.5 141.6 May 106.0 117.3 124.6 135.5
Jun 127.9 128.6 132.6 138.9 Jun 108.4 117.4 125.0 136.0
Jul 108.5 117.7 127.5 151.6 Jul 110.0 118.1 125.8 138.0
Aug 121.7 126.5 152.8 131.3 Aug 112.3 118.5 128.0 136.2
Sep 110.5 113.3 157.8 144.2 Sep 114.1 118.8 131.7 135.1
Oct 125.1 132.8 137.3 139.7 Oct 115.8 119.4 132.1 135.3
Nov 120.6 123.0 132.8 105.7 Nov 117.1 119.6 132.9 133.0
Dec 106.1 110.2 101.0 78.5 Dec 117.8 120.0 132.1 131.1
*NOTE: August and September 2007 information (and 3 and 12 month rolling averages that contain August and September 2007 information) is affected by the 13 month foreign
reporting impact described on the Business Fundamentals page of this website.
8
9. 9
Ashland Performance Materials Gross Profit %
%
26.0
24.0
22.0
20.0
18.0
16.0
14.0
12.0
May-05
May-06
May-07
May-08
Nov-05
Nov-06
Nov-07
Nov-08
Mar-05
Mar-06
Mar-07
Mar-08
Jan-05
Jul-05
Sep-05
Jan-06
Jul-06
Sep-06
Jan-07
Jul-07
Sep-07
Jan-08
Jul-08
Sep-08
Jan-09
3 Month Rolling Average 12 Month Rolling Average
3 Month Rolling Average (%)* 12 Month Rolling Average (%)*
2005 2006 2007 2008 2009 2005 2006 2007 2008 2009
Jan 17.3 21.3 20.5 17.3 17.1 Jan 18.9 21.8 22.2 19.4 16.6
Feb 18.6 22.2 19.7 17.1 Feb 18.9 21.9 21.9 19.4
Mar 20.7 22.9 20.5 18.1 Mar 18.8 22.1 21.7 19.1
Apr 21.5 23.4 21.0 18.5 Apr 19.0 22.3 21.6 18.9
May 21.6 24.2 21.4 18.1 May 19.3 22.5 21.2 18.5
Jun 22.6 25.0 21.9 17.5 Jun 19.7 22.8 21.0 18.0
Jul 22.7 24.6 21.2 16.1 Jul 19.9 22.8 20.8 17.6
Aug 22.9 22.8 20.1 14.6 Aug 20.2 22.5 20.5 17.1
Sep 21.2 20.3 18.1 14.6 Sep 20.4 22.5 20.3 17.0
Oct 21.6 20.4 18.4 14.8 Oct 20.9 22.4 20.2 16.7
Nov 20.9 20.8 18.7 16.1 Nov 21.1 22.5 20.0 16.5
Dec 21.6 21.1 18.2 15.9 Dec 21.6 22.3 19.6 16.6
*NOTE: August and September 2007 information (and 3 and 12 month rolling averages that contain August and September 2007 information) is affected by the 13 month foreign
reporting impact described on the Business Fundamentals page of this website.
9
11. 11
Ashland Consumer Markets (Valvoline) Revenue
($ in millions)
160
150
140
130
120
110
100
90
May-05
May-06
May-07
May-08
Nov-05
Nov-06
Nov-07
Nov-08
Mar-05
Mar-06
Mar-07
Mar-08
Jan-05
Jul-05
Sep-05
Jan-06
Jul-06
Sep-06
Jan-07
Jul-07
Sep-07
Jan-08
Jul-08
Sep-08
Jan-09
3 Month Rolling Average 12 Month Rolling Average
Monthly Sales ($ in millions)* 12 Month Rolling Average ($ in millions)*
2005 2006 2007 2008 2009 2005 2006 2007 2008 2009
Jan 103.0 113.1 122.8 135.7 128.6 Jan 109.4 111.4 121.6 130.6 138.5
Feb 105.5 109.1 122.3 127.4 Feb 109.8 111.7 122.7 131.0
Mar 114.9 130.6 137.3 137.5 Mar 109.6 113.0 123.3 131.0
Apr 118.3 116.8 135.2 154.1 Apr 109.8 112.9 124.8 132.6
May 118.3 126.8 133.2 130.8 May 111.0 113.6 125.4 132.4
Jun 117.8 122.9 139.1 143.0 Jun 111.6 114.1 126.7 132.7
Jul 107.0 116.3 129.1 150.9 Jul 110.8 114.8 127.8 134.6
Aug 116.1 128.3 131.6 147.8 Aug 111.5 115.8 128.0 135.9
Sep 115.7 134.6 123.5 155.1 Sep 110.5 117.4 127.1 138.5
Oct 105.8 130.3 141.2 143.9 Oct 110.6 119.5 128.0 138.8
Nov 106.0 114.6 129.6 119.5 Nov 110.8 120.2 129.3 137.9
Dec 98.7 106.6 109.5 124.1 Dec 110.6 120.8 129.5 139.1
*NOTE: August and September 2007 information (and 3 and 12 month rolling averages that contain August and September 2007 information) is affected by the 13 month foreign
reporting impact described on the Business Fundamentals page of this website.
11
12. 12
Ashland Consumer Markets (Valvoline) Gross Profit (%)
%
33.0
30.0
27.0
24.0
21.0
18.0
15.0
May-05
May-06
May-07
May-08
Nov-05
Nov-06
Nov-07
Nov-08
Mar-05
Mar-06
Mar-07
Mar-08
Jan-05
Jul-05
Sep-05
Jan-06
Jul-06
Sep-06
Jan-07
Jul-07
Sep-07
Jan-08
Jul-08
Sep-08
Jan-09
3 Month Rolling Average 12 Month Rolling Average
3 Month Rolling Average (%)* 12 Month Rolling Average (%)*
2005 2006 2007 2008 2009 2005 2006 2007 2008 2009
Jan 26.7 21.4 24.5 24.2 23.6 Jan 28.0 25.1 20.7 24.9 22.4
Feb 27.4 21.6 25.1 24.0 Feb 28.0 24.7 21.0 24.9
Mar 28.3 22.0 25.6 24.4 Mar 28.1 23.9 21.4 24.7
Apr 28.8 21.4 25.1 24.6 Apr 28.1 23.2 21.7 24.8
May 28.1 20.4 25.3 24.6 May 27.9 22.6 22.3 24.7
Jun 25.9 20.2 25.1 23.9 Jun 27.4 22.4 22.6 24.4
Jul 25.4 19.6 25.9 21.8 Jul 27.2 21.7 23.3 23.7
Aug 25.6 19.0 25.5 19.5 Aug 26.9 20.9 23.9 23.1
Sep 25.4 16.0 24.6 19.2 Sep 26.6 19.9 24.8 23.0
Oct 24.5 17.9 24.3 20.1 Oct 26.4 20.0 25.0 22.6
Nov 23.0 19.7 24.6 21.1 Nov 26.0 20.1 25.1 22.2
Dec 22.1 23.8 24.7 21.8 Dec 25.5 20.4 25.0 22.3
*NOTE: August and September 2007 information (and 3 and 12 month rolling averages that contain August and September 2007 information) is affected by the 13 month foreign
reporting impact described on the Business Fundamentals page of this website.
12
13. 13
Ashland Consumer Markets (Valvoline) Lubricant Sales Gallons
Gallons (in millions)
17
16
15
14
13
12
11
10
May-05
May-06
May-07
May-08
Nov-05
Nov-06
Nov-07
Nov-08
Mar-05
Mar-06
Mar-07
Mar-08
Jan-05
Jul-05
Sep-05
Jan-06
Jul-06
Sep-06
Jan-07
Jul-07
Sep-07
Jan-08
Jul-08
Sep-08
Jan-09
3 Month Rolling Average
3 Month Rolling Average (in millions)*
2005 2006 2007 2008 2009
Jan 13.1 13.1 12.3 13.2 10.6
Feb 12.9 13.2 12.7 13.1
Mar 14.1 14.7 13.9 14.0
Apr 15.1 15.0 14.5 14.7
May 16.0 15.6 14.8 14.6
Jun 16.0 15.0 14.5 14.6
Jul 15.4 14.7 15.0 14.0
Aug 15.0 14.4 14.9 14.4
Sep 14.7 13.7 14.4 14.5
Oct 14.5 14.0 14.0 13.6
Nov 13.7 13.2 13.8 12.3
Dec 12.8 12.8 13.3 11.0
*NOTE: August and September 2007 information (and 3 and 12 month rolling averages that contain August and September 2007 information) is affected by the 13 month foreign
reporting impact described on the Business Fundamentals page of this website.
13
14. 14
VIOC 12 Month Rolling Average Sales
(Stores 2 Years and Older)
($ in millions)
13.5
13.0
12.5
12.0
11.5
11.0
May-05
May-06
May-07
May-08
Nov-05
Nov-06
Nov-07
Nov-08
Mar-05
Mar-06
Mar-07
Mar-08
Jan-05
Jul-05
Sep-05
Jan-06
Jul-06
Sep-06
Jan-07
Jul-07
Sep-07
Jan-08
Jul-08
Sep-08
Jan-09
VIOC Rolling 12 Month Average
Stores 2 Years and Older ($ in millions)*
2005 2006 2007 2008 2009
Jan 11.7 11.4 11.5 12.4 13.2
Feb 11.7 11.4 11.6 12.4
Mar 11.7 11.4 11.7 12.4
Apr 11.7 11.3 11.7 12.5
May 11.7 11.3 11.8 12.6
Jun 11.7 11.3 11.9 12.5
Jul 11.7 11.3 12.0 12.7
Aug 11.7 11.2 12.2 12.7
Sep 11.6 11.3 12.2 12.8
Oct 11.5 11.3 12.3 12.9
Nov 11.5 11.3 12.4 13.0
Dec 11.4 11.4 12.4 13.1
*NOTE: 60 VIOC stores transferred to Marathon on June 30, 2005, have been excluded from this data.
14
15. 15
Ashland Distribution Average Sales($) / Shipping Day
($ in millions)
20
19
18
17
16
15
14
13
12
11
10
9
May-05
May-06
May-07
May-08
Nov-05
Nov-06
Nov-07
Nov-08
Mar-05
Mar-06
Mar-07
Mar-08
Jan-05
Jul-05
Sep-05
Jan-06
Jul-06
Sep-06
Jan-07
Jul-07
Sep-07
Jan-08
Jul-08
Sep-08
Jan-09
Sales($)/Ship Day
Average Sales per Shipping Day ($ in millions)*
2005 2006 2007 2008 2009
Jan 15.187 15.959 15.445 17.177 12.065
Feb 15.530 16.412 16.333 16.794
Mar 15.524 15.910 15.520 17.574
Apr 15.631 17.034 16.592 17.319
May 15.664 16.459 15.905 17.809
Jun 14.971 16.552 16.377 18.863
Jul 14.774 16.194 15.948 18.018
Aug 14.535 15.925 16.762 17.994
Sep 16.319 16.695 17.328 17.958
Oct 15.870 16.000 16.109 16.188
Nov 16.688 16.537 17.169 14.765
Dec 14.991 13.963 14.506 10.232
*NOTE: August and September 2007 information (and 3 and 12 month rolling averages that contain August and September 2007 information) is affected by the 13 month foreign
reporting impact described on the Business Fundamentals page of this website.
15
16. 16
Ashland Distribution Revenue
($ in millions)
450
400
350
300
250
200
May-05
May-06
May-07
May-08
Nov-05
Nov-06
Nov-07
Nov-08
Mar-05
Mar-06
Mar-07
Mar-08
Jan-05
Jul-05
Sep-05
Jan-06
Jul-06
Sep-06
Jan-07
Jul-07
Sep-07
Jan-08
Jul-08
Sep-08
Jan-09
Monthly Sales 12 Month Rolling Average
Monthly Sales ($ in millions)* 12 Month Rolling Average ($ in millions)*
2005 2006 2007 2008 2009 2005 2006 2007 2008 2009
Jan 304 335 340 378 253 Jan 288 326 338 343 343
Feb 311 328 327 353 Feb 293 328 338 345
Mar 342 366 341 351 Mar 297 330 336 346
Apr 328 324 332 381 Apr 301 329 337 350
May 329 362 350 374 May 306 332 336 352
Jun 329 364 344 396 Jun 309 335 334 356
Jul 295 324 335 396 Jul 311 337 335 361
Aug 334 366 386 378 Aug 314 340 336 361
Sep 343 334 329 377 Sep 318 339 336 365
Oct 333 352 371 372 Oct 320 341 338 365
Nov 334 331 343 266 Nov 323 341 339 358
Dec 300 265 276 215 Dec 324 338 340 353
*NOTE: August and September 2007 information (and 3 and 12 month rolling averages that contain August and September 2007 information) is affected by the 13 month foreign
reporting impact described on the Business Fundamentals page of this website.
16