More Related Content
Similar to Ashland Aqualon Functional Ingredients Revenue and Sales per Shipping Day
Similar to Ashland Aqualon Functional Ingredients Revenue and Sales per Shipping Day (20)
Ashland Aqualon Functional Ingredients Revenue and Sales per Shipping Day
- 1. 1
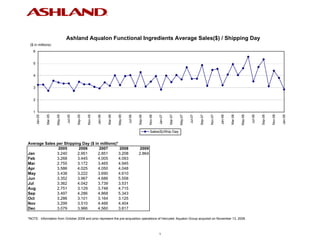
Ashland Aqualon Functional Ingredients Average Sales($) / Shipping Day
($ in millions)
6
5
4
3
2
1
May-05
May-06
May-07
May-08
Nov-05
Nov-06
Nov-07
Nov-08
Mar-05
Mar-06
Mar-07
Mar-08
Jan-05
Jul-05
Sep-05
Jan-06
Jul-06
Sep-06
Jan-07
Jul-07
Sep-07
Jan-08
Jul-08
Sep-08
Jan-09
Sales($)/Ship Day
Average Sales per Shipping Day ($ in millions)*
2005 2006 2007 2008 2009
Jan 3.240 2.951 2.851 3.208 2.864
Feb 3.268 3.445 4.005 4.093
Mar 2.755 3.172 3.465 4.945
Apr 3.586 4.025 4.050 4.048
May 3.438 3.222 3.690 4.610
Jun 3.352 3.967 4.686 5.558
Jul 3.362 4.042 3.739 3.531
Aug 2.751 3.129 3.748 4.715
Sep 3.497 4.286 4.868 5.343
Oct 3.286 3.101 3.164 3.125
Nov 3.299 3.510 4.466 4.404
Dec 3.079 3.966 4.560 3.817
*NOTE: Information from October 2008 and prior represent the pre-acquisition operations of Hercules' Aqualon Group acquired on November 13, 2008.
1
- 2. 2
Ashland Aqualon Functional Ingredients Revenue
($ in millions)
130
120
110
100
90
80
70
60
50
40
May-05
May-06
May-07
May-08
Nov-05
Nov-06
Nov-07
Nov-08
Mar-05
Mar-06
Mar-07
Mar-08
Jan-05
Jul-05
Sep-05
Jan-06
Jul-06
Sep-06
Jan-07
Jul-07
Sep-07
Jan-08
Jul-08
Sep-08
Jan-09
Monthly Sales 12 Month Rolling Average
Monthly Sales ($ in millions)* 12 Month Rolling Average ($ in millions)*
2005 2006 2007 2008 2009 2005 2006 2007 2008 2009
Jan 64.8 62.0 62.7 70.6 60.1 Jan 65.8 67.5 74.3 82.8 89.0
Feb 65.4 68.9 80.1 86.0 Feb 65.8 67.8 75.2 83.3
Mar 60.6 73.0 76.2 98.9 Mar 65.9 68.8 75.5 85.2
Apr 75.3 76.5 81.0 89.1 Apr 66.2 68.8 76.7 87.1
May 72.2 70.9 81.2 96.8 May 66.2 68.8 76.7 87.1
Jun 73.7 87.3 98.4 116.7 Jun 66.7 69.9 77.7 88.7
Jul 67.2 80.8 78.5 77.7 Jul 66.5 71.0 77.5 88.6
Aug 63.3 72.0 86.2 99.0 Aug 66.5 71.8 78.7 89.7
Sep 73.4 85.7 92.5 112.2 Sep 67.2 72.8 79.2 91.3
Oct 69.0 68.2 72.8 71.9 Oct 67.2 72.7 79.6 91.2
Nov 66.0 70.2 89.3 79.3 Nov 67.9 73.1 81.2 90.4
Dec 61.6 75.3 86.6 80.1 Dec 67.7 74.2 82.1 89.9
*NOTE: Information from October 2008 and prior represent the pre-acquisition operations of Hercules' Aqualon Group acquired on November 13, 2008. The 12 month
rolling sales average will continue to include pre-acquisition results through November 2009.
2
- 3. 3
Ashland Aqualon Functional Ingredients Volume in Metric Tons
(in thousands)
24
22
20
18
16
14
12
10
May-05
May-06
May-07
May-08
Nov-05
Nov-06
Nov-07
Nov-08
Mar-05
Mar-06
Mar-07
Mar-08
Jan-05
Jul-05
Sep-05
Jan-06
Jul-06
Sep-06
Jan-07
Jul-07
Sep-07
Jan-08
Jul-08
Sep-08
Jan-09
Metric Tons 12 Month Rolling Average
Metric Tons (in thousands)* 12 Month Rolling Average (in thousands)*
2005 2006 2007 2008 2009 2005 2006 2007 2008 2009
Jan 14.2 12.2 12.8 13.7 11.3 Jan 15.2 14.8 15.2 16.5 16.7
Feb 14.4 13.4 15.4 16.5 Feb 15.2 14.8 15.4 16.6
Mar 13.5 15.2 14.5 18.4 Mar 15.2 14.9 15.3 16.9
Apr 16.3 15.5 15.9 16.8 Apr 15.1 14.8 15.5 17.1
May 15.4 14.6 16.2 18.0 May 15.1 14.8 15.5 17.1
Jun 16.2 18.0 19.3 21.7 Jun 15.1 14.9 15.6 17.3
Jul 14.5 16.7 16.0 15.1 Jul 14.9 15.1 15.5 17.3
Aug 14.2 14.8 18.1 17.9 Aug 14.9 15.1 15.8 17.2
Sep 15.8 17.5 18.7 20.2 Sep 14.9 15.3 15.9 17.4
Oct 16.0 14.1 14.5 13.3 Oct 14.9 15.1 15.9 17.3
Nov 15.1 14.6 18.3 15.2 Nov 15.1 15.1 16.3 17.0
Dec 14.3 15.2 17.2 15.8 Dec 15.0 15.2 16.4 16.9
*NOTE: Information from October 2008 and prior represent the pre-acquisition operations of Hercules' Aqualon Group acquired on November 13, 2008. The 12 month rolling average
will continue to include pre-acquisition results through November 2009.
3