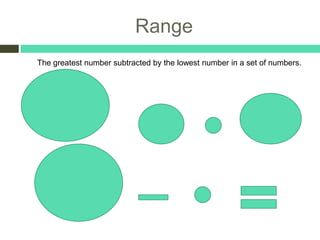
CENTRAL TENDENCY
By: Marlenys Mora
Period 6
Range
The greatest number subtracted by the lowest number in a set of numbers.
Mean

In a set of data you add all the numbers together and divided by the #
                                 of data.
Median
Middle, thing, person, number ect. In a group. I they are two Middle
numbers add the numbers together and divide them by 2 or by the
                amount of middle numbers you find.
Mode
     The most common number in a data set.


The boys would be the “mode” of this picture because
              they appear the most.
Outliers

The Thing, number, place ect. That is most different from the rest


     The brown, gray and black kitten would be the outlier.
Try it!
Jessica’s test scores in Algebra for the first semester are 93, 79, 88, 77, 92, 88, 80, 34, 84, 88.
 Calculate the range, mean, median, and mode. Then make and explain a prediction for next
                                       semester’s test scores
                              34, 77, 79, 80, 84, 88, 88, 88, 92, 93
                                  Range: 93 - 34= 59
          Mean: 34 + 77 + 79 + 80 + 84 + 88 + 88 + 88 + 92 + 93 = 803/10 = 80.3
                             Median: 84 + 88 = 172/2 = 86
                                       Mode: 88
Group Exercises

Witch Measures of central tendency
 best represents the data? Justify
           your answer.
 Then find all the central tendency
measures and compare the results.
Question 1
1. DEFECTS A furniture manufacturer keeps records of how many units are
   defective each day.(7,12,9,10,14,8))

7, 8, 8, 9, 10, 12, 14

Mean: 11.33
Median:9
Mode:8
Outlier: No outlier
Range:7


How could you verify this decision?

I would use mean because it would be
more accurate and closer to the units
defective each day.
Question 2
2. SCIENCE TEST Mr. Wharton records his students scores on the last science
test(94,88,88,94,84.94.88.84,94)


84, 84, 88, 88, 88, 94, 94, 94, 94, 94

Mean:90.2
Mode:94
Range:10
Outlier: No Outlier
Median:182/2=91

Predict the outcome of the mean and range if there were 2 20’s added to the
science test explain?
Mean: 78.5
Range:74
The mean would be lower b/c of the two 20’s added together it will bring it down.
Question 3
3. PUPPIES A veterinarian keeps records of the weights of puppies in ounces
(4.1,3.8,5.0,5.6,4.7,11.6)

3.8, 4.1, 4.6, 4.7, 5.0, 5.6, 11.6

Mean: 5.62
Median:4.7
Mode: No Mode
Range:7.8
Outlier:11.6

How would you explain the range and its connection to the data set?

Range is the highest # subtracted by the lowest number in the data set. I think the
connection because confirms the accuracy
Question 4
4. COMMUTING The local newspaper conducted a telephone survey of commuters to
    see how the get to work each day. The responses were: commuter rail, 22; bus, 17;
    subway, 18; walking 15; car ,224.

15, 17, 18, 22, 224

Mean:59.2
Median:18
Mode: No Mode
Range:209
Outlier:224

What facts can you gather about the outlier? Which central tendency would be affected
   by
the outlier?
The outlier is the oddest number in a set of data, in other words the one that doesn’t
   belong. Mean
Could be affected by outlier. It would not be accurate.
Question 5
5. SNOWFALL A weather station keeps records of how many inches of snow fall each
week (9,2,0,3,0,2,1,2,3,1).

0, 0, 1, 1, 2, 2, 2, 3, 3, 9

Mean:2.3
Median:2
Mode:2
Range:9
Outlier:9

What would happen to your decision if we had a blizzard and added 24 inches to the
above data.

This would be the Mean:4.27
This would be the Median:2
This would be the Mode:2
This would be theRange:24
This would be theOutlier:24
Question 6
6. SALES a supermarket keeps records of how many boxes of cereal are sold each day
in a week (12,9,11,14,19,49,18)

9, 11, 11, 12, 14, 18, 19, 49

Mean:17.875
Mode:11
Median:13
Range:40
Outlier:49


Based on above information which cereal makes the most money.

I think the outlier makes the most money
Question 7
7. A city councilman keeps tracks of the numbers of votes he receives in each
district(68,66,59,61,62,67)

59, 61, 62, 66, 67, 68

Mean:63.83
Median:64
Mode: No Mode
Range:9
Outlier: No Outlier

If you ran against the city councilman and wanted to beat him what voting numbers
would you want to see.
68 because is the highest
Question 8
8. BODYBUILDING A body builder keeps track of how many sets
of each exercise he performs each day:(9,8,6,5,11,7,10)

5, 6, 7, 8, 9, 10, 11

Mean:8
Median:8
Mode: No Mode
Range:6
Outlier: No Outlier

I think that mean because it would be the most accurate answer
Question 9
9. PROPERTY TAXES A landlord is keeping track of what he pays each month in
property taxes so he can budget accordingly. For the first half of the year, the tax bills
were $256, $256,$274,$256,$256,$274. Which measure of central tendency best
represents the data.


$256,$256,$256,$256,$274,$274=1572/6=262

Mean:262
Median:256
Mode:256
Range:18
Outlier: 274
THE END

Central tendency

  • 1.
  • 2.
    Range The greatest numbersubtracted by the lowest number in a set of numbers.
  • 3.
    Mean In a setof data you add all the numbers together and divided by the # of data.
  • 4.
    Median Middle, thing, person,number ect. In a group. I they are two Middle numbers add the numbers together and divide them by 2 or by the amount of middle numbers you find.
  • 5.
    Mode The most common number in a data set. The boys would be the “mode” of this picture because they appear the most.
  • 6.
    Outliers The Thing, number,place ect. That is most different from the rest The brown, gray and black kitten would be the outlier.
  • 7.
    Try it! Jessica’s testscores in Algebra for the first semester are 93, 79, 88, 77, 92, 88, 80, 34, 84, 88. Calculate the range, mean, median, and mode. Then make and explain a prediction for next semester’s test scores 34, 77, 79, 80, 84, 88, 88, 88, 92, 93 Range: 93 - 34= 59 Mean: 34 + 77 + 79 + 80 + 84 + 88 + 88 + 88 + 92 + 93 = 803/10 = 80.3 Median: 84 + 88 = 172/2 = 86 Mode: 88
  • 8.
    Group Exercises Witch Measuresof central tendency best represents the data? Justify your answer. Then find all the central tendency measures and compare the results.
  • 9.
    Question 1 1. DEFECTSA furniture manufacturer keeps records of how many units are defective each day.(7,12,9,10,14,8)) 7, 8, 8, 9, 10, 12, 14 Mean: 11.33 Median:9 Mode:8 Outlier: No outlier Range:7 How could you verify this decision? I would use mean because it would be more accurate and closer to the units defective each day.
  • 10.
    Question 2 2. SCIENCETEST Mr. Wharton records his students scores on the last science test(94,88,88,94,84.94.88.84,94) 84, 84, 88, 88, 88, 94, 94, 94, 94, 94 Mean:90.2 Mode:94 Range:10 Outlier: No Outlier Median:182/2=91 Predict the outcome of the mean and range if there were 2 20’s added to the science test explain? Mean: 78.5 Range:74 The mean would be lower b/c of the two 20’s added together it will bring it down.
  • 11.
    Question 3 3. PUPPIESA veterinarian keeps records of the weights of puppies in ounces (4.1,3.8,5.0,5.6,4.7,11.6) 3.8, 4.1, 4.6, 4.7, 5.0, 5.6, 11.6 Mean: 5.62 Median:4.7 Mode: No Mode Range:7.8 Outlier:11.6 How would you explain the range and its connection to the data set? Range is the highest # subtracted by the lowest number in the data set. I think the connection because confirms the accuracy
  • 12.
    Question 4 4. COMMUTINGThe local newspaper conducted a telephone survey of commuters to see how the get to work each day. The responses were: commuter rail, 22; bus, 17; subway, 18; walking 15; car ,224. 15, 17, 18, 22, 224 Mean:59.2 Median:18 Mode: No Mode Range:209 Outlier:224 What facts can you gather about the outlier? Which central tendency would be affected by the outlier? The outlier is the oddest number in a set of data, in other words the one that doesn’t belong. Mean Could be affected by outlier. It would not be accurate.
  • 13.
    Question 5 5. SNOWFALLA weather station keeps records of how many inches of snow fall each week (9,2,0,3,0,2,1,2,3,1). 0, 0, 1, 1, 2, 2, 2, 3, 3, 9 Mean:2.3 Median:2 Mode:2 Range:9 Outlier:9 What would happen to your decision if we had a blizzard and added 24 inches to the above data. This would be the Mean:4.27 This would be the Median:2 This would be the Mode:2 This would be theRange:24 This would be theOutlier:24
  • 14.
    Question 6 6. SALESa supermarket keeps records of how many boxes of cereal are sold each day in a week (12,9,11,14,19,49,18) 9, 11, 11, 12, 14, 18, 19, 49 Mean:17.875 Mode:11 Median:13 Range:40 Outlier:49 Based on above information which cereal makes the most money. I think the outlier makes the most money
  • 15.
    Question 7 7. Acity councilman keeps tracks of the numbers of votes he receives in each district(68,66,59,61,62,67) 59, 61, 62, 66, 67, 68 Mean:63.83 Median:64 Mode: No Mode Range:9 Outlier: No Outlier If you ran against the city councilman and wanted to beat him what voting numbers would you want to see. 68 because is the highest
  • 16.
    Question 8 8. BODYBUILDINGA body builder keeps track of how many sets of each exercise he performs each day:(9,8,6,5,11,7,10) 5, 6, 7, 8, 9, 10, 11 Mean:8 Median:8 Mode: No Mode Range:6 Outlier: No Outlier I think that mean because it would be the most accurate answer
  • 17.
    Question 9 9. PROPERTYTAXES A landlord is keeping track of what he pays each month in property taxes so he can budget accordingly. For the first half of the year, the tax bills were $256, $256,$274,$256,$256,$274. Which measure of central tendency best represents the data. $256,$256,$256,$256,$274,$274=1572/6=262 Mean:262 Median:256 Mode:256 Range:18 Outlier: 274
  • 18.