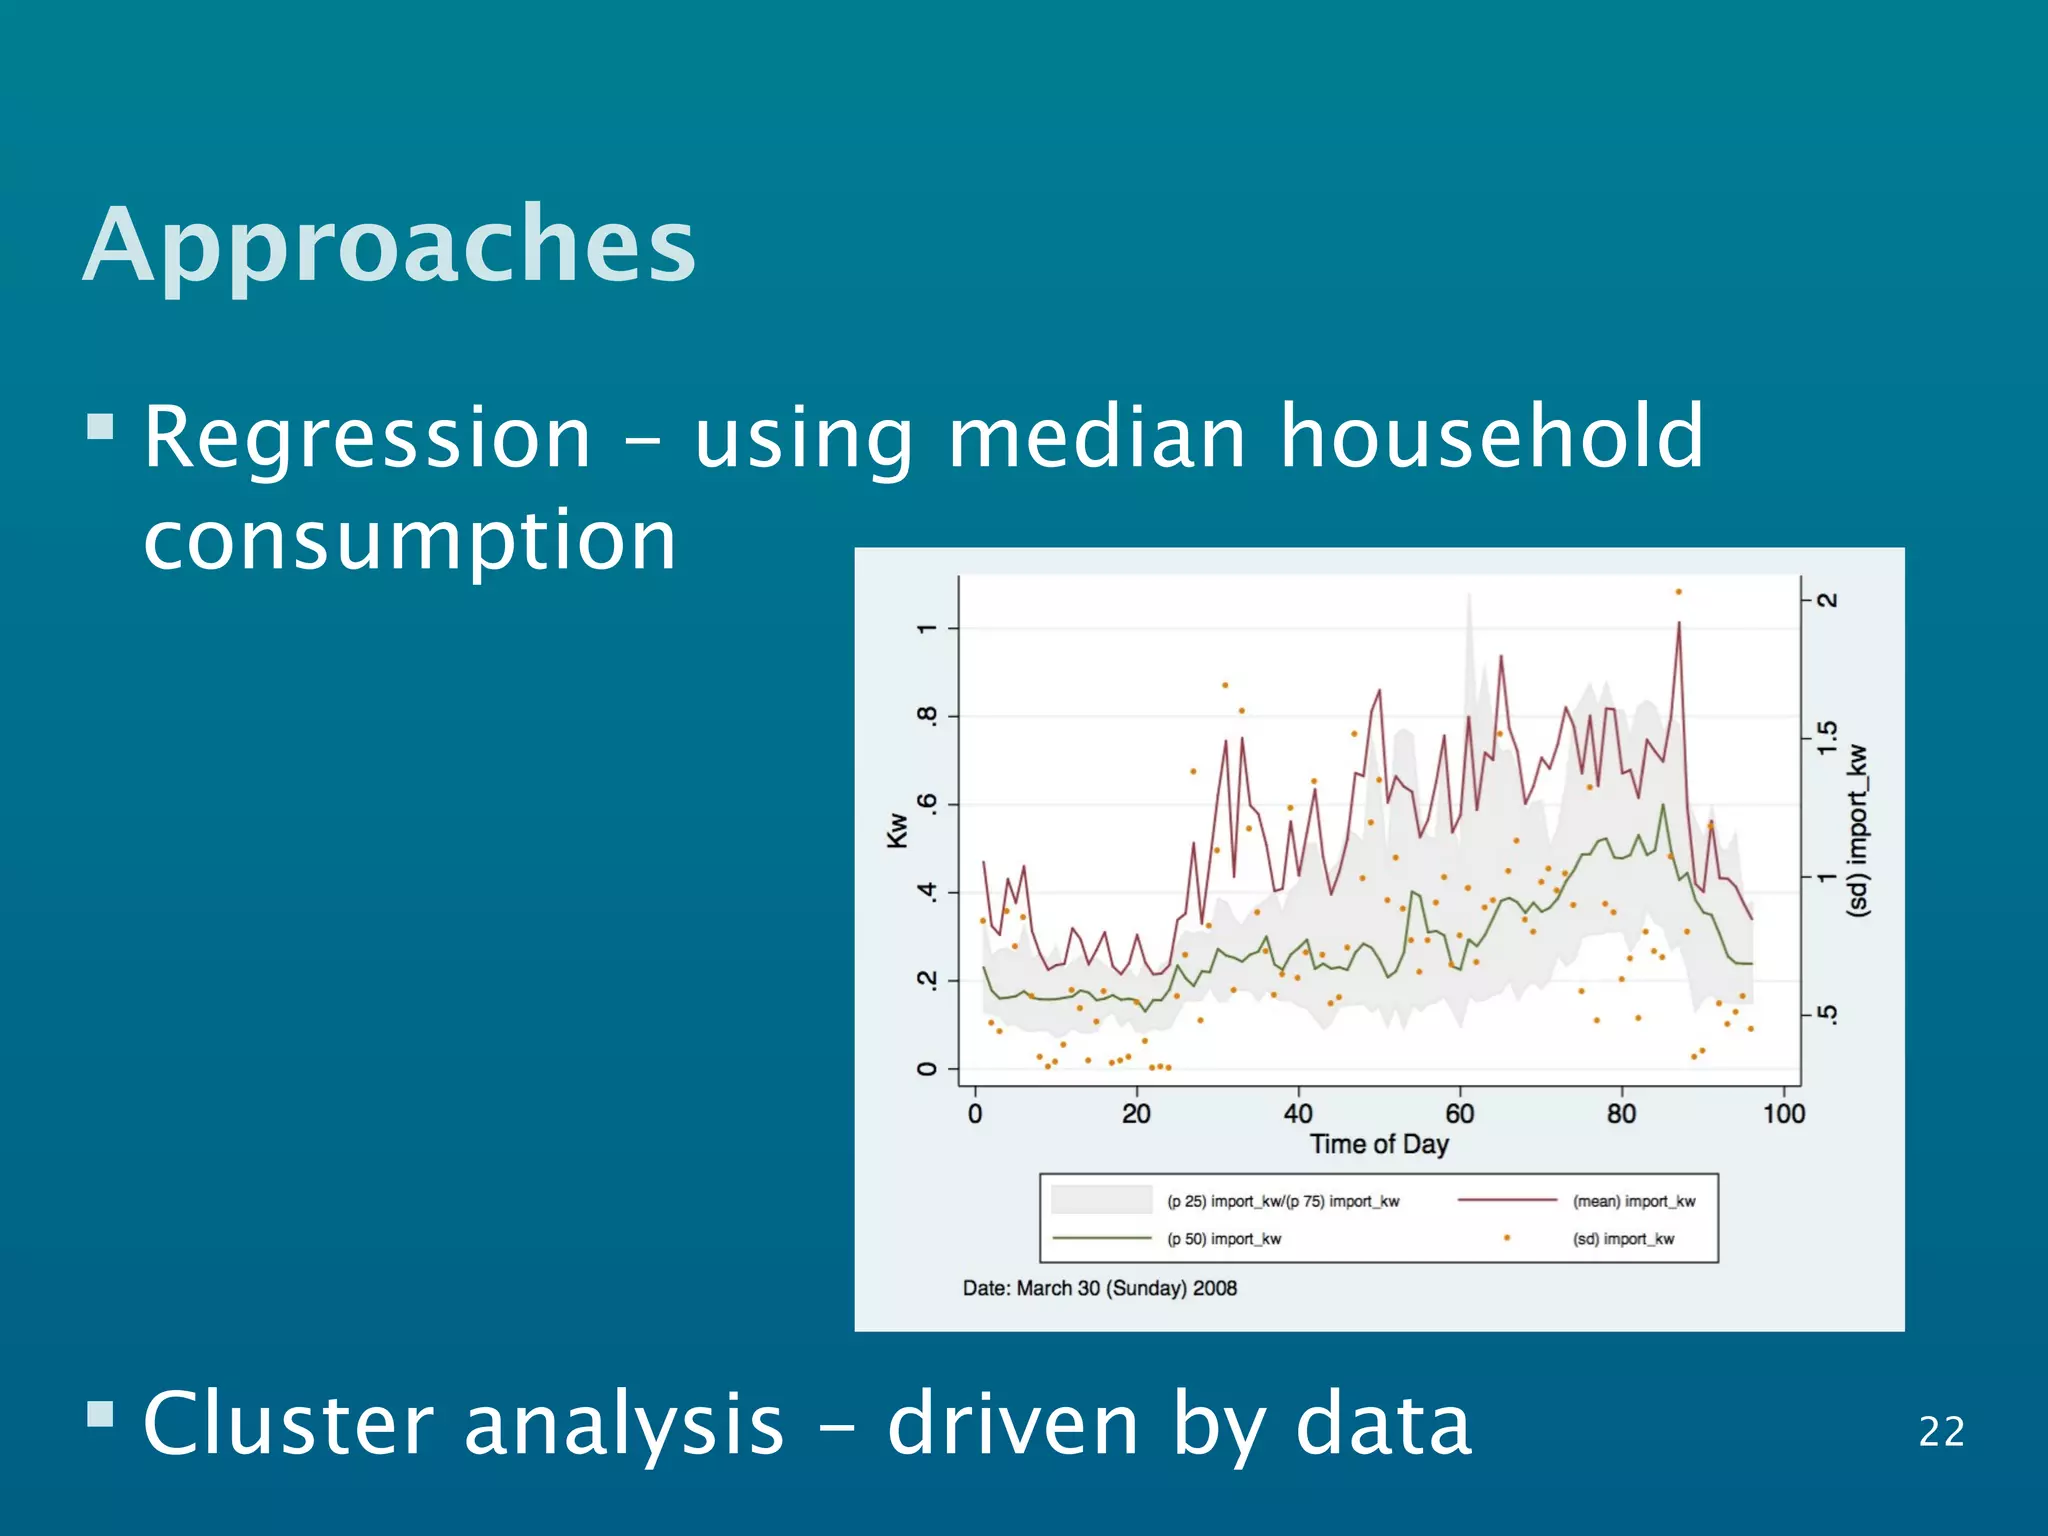
![13Original dataset: Richardson, I. and Thomson, M., One-Minute Resolution Domestic Electricity Use Data, 2008-
2009 [computer file]. Colchester, Essex: UK Data Archive [distributor], October 2010. SN: 6583,
http://dx.doi.org/10.5255/UKDA-SN-6583-1.](https://image.slidesharecdn.com/19nov13mrspres-final-131125163903-phpapp02/75/Census-2022-An-overview-13-2048.jpg)
![14Original dataset: Richardson, I. and Thomson, M., One-Minute Resolution Domestic Electricity Use Data,
2008-2009 [computer file]. Colchester, Essex: UK Data Archive [distributor], October 2010. SN: 6583,
http://dx.doi.org/10.5255/UKDA-SN-6583-1.](https://image.slidesharecdn.com/19nov13mrspres-final-131125163903-phpapp02/75/Census-2022-An-overview-14-2048.jpg)
![15Original dataset: Richardson, I. and Thomson, M., One-Minute Resolution Domestic Electricity Use Data,
2008-2009 [computer file]. Colchester, Essex: UK Data Archive [distributor], October 2010. SN: 6583,
http://dx.doi.org/10.5255/UKDA-SN-6583-1.](https://image.slidesharecdn.com/19nov13mrspres-final-131125163903-phpapp02/75/Census-2022-An-overview-15-2048.jpg)
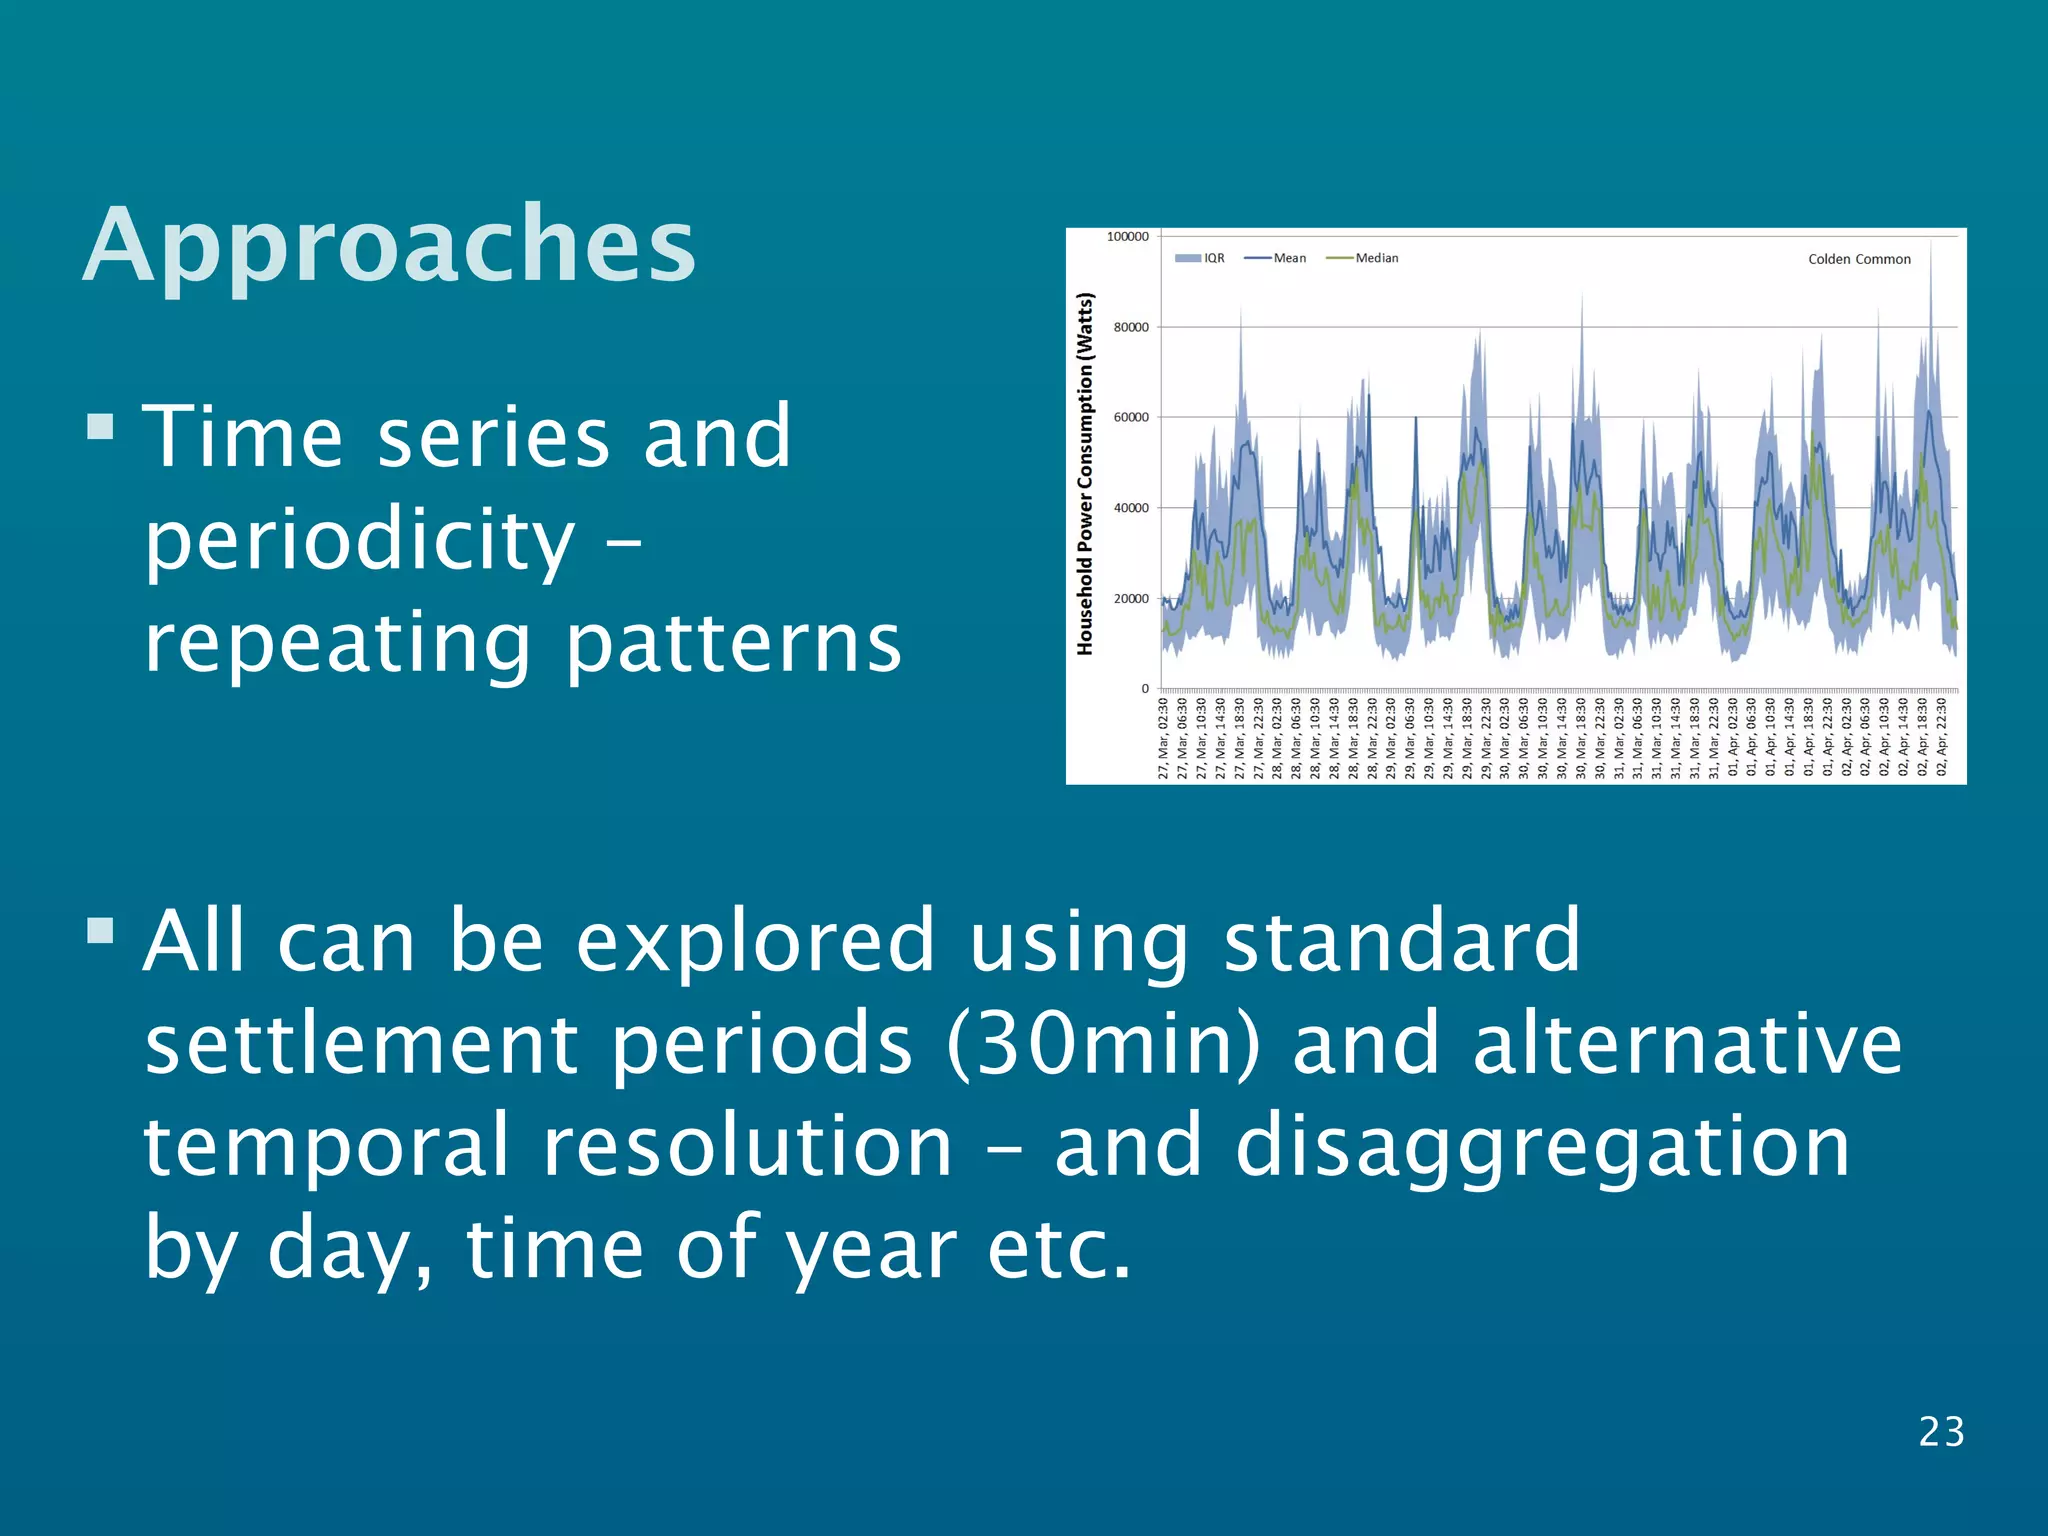
![16
Original dataset: Richardson, I. and Thomson,
M., One-Minute Resolution Domestic Electricity Use
Data, 2008-2009 [computer file]. Colchester, Essex:
UK Data Archive [distributor], October 2010. SN:
6583, http://dx.doi.org/10.5255/UKDA-SN-6583-1.](https://image.slidesharecdn.com/19nov13mrspres-final-131125163903-phpapp02/75/Census-2022-An-overview-16-2048.jpg)
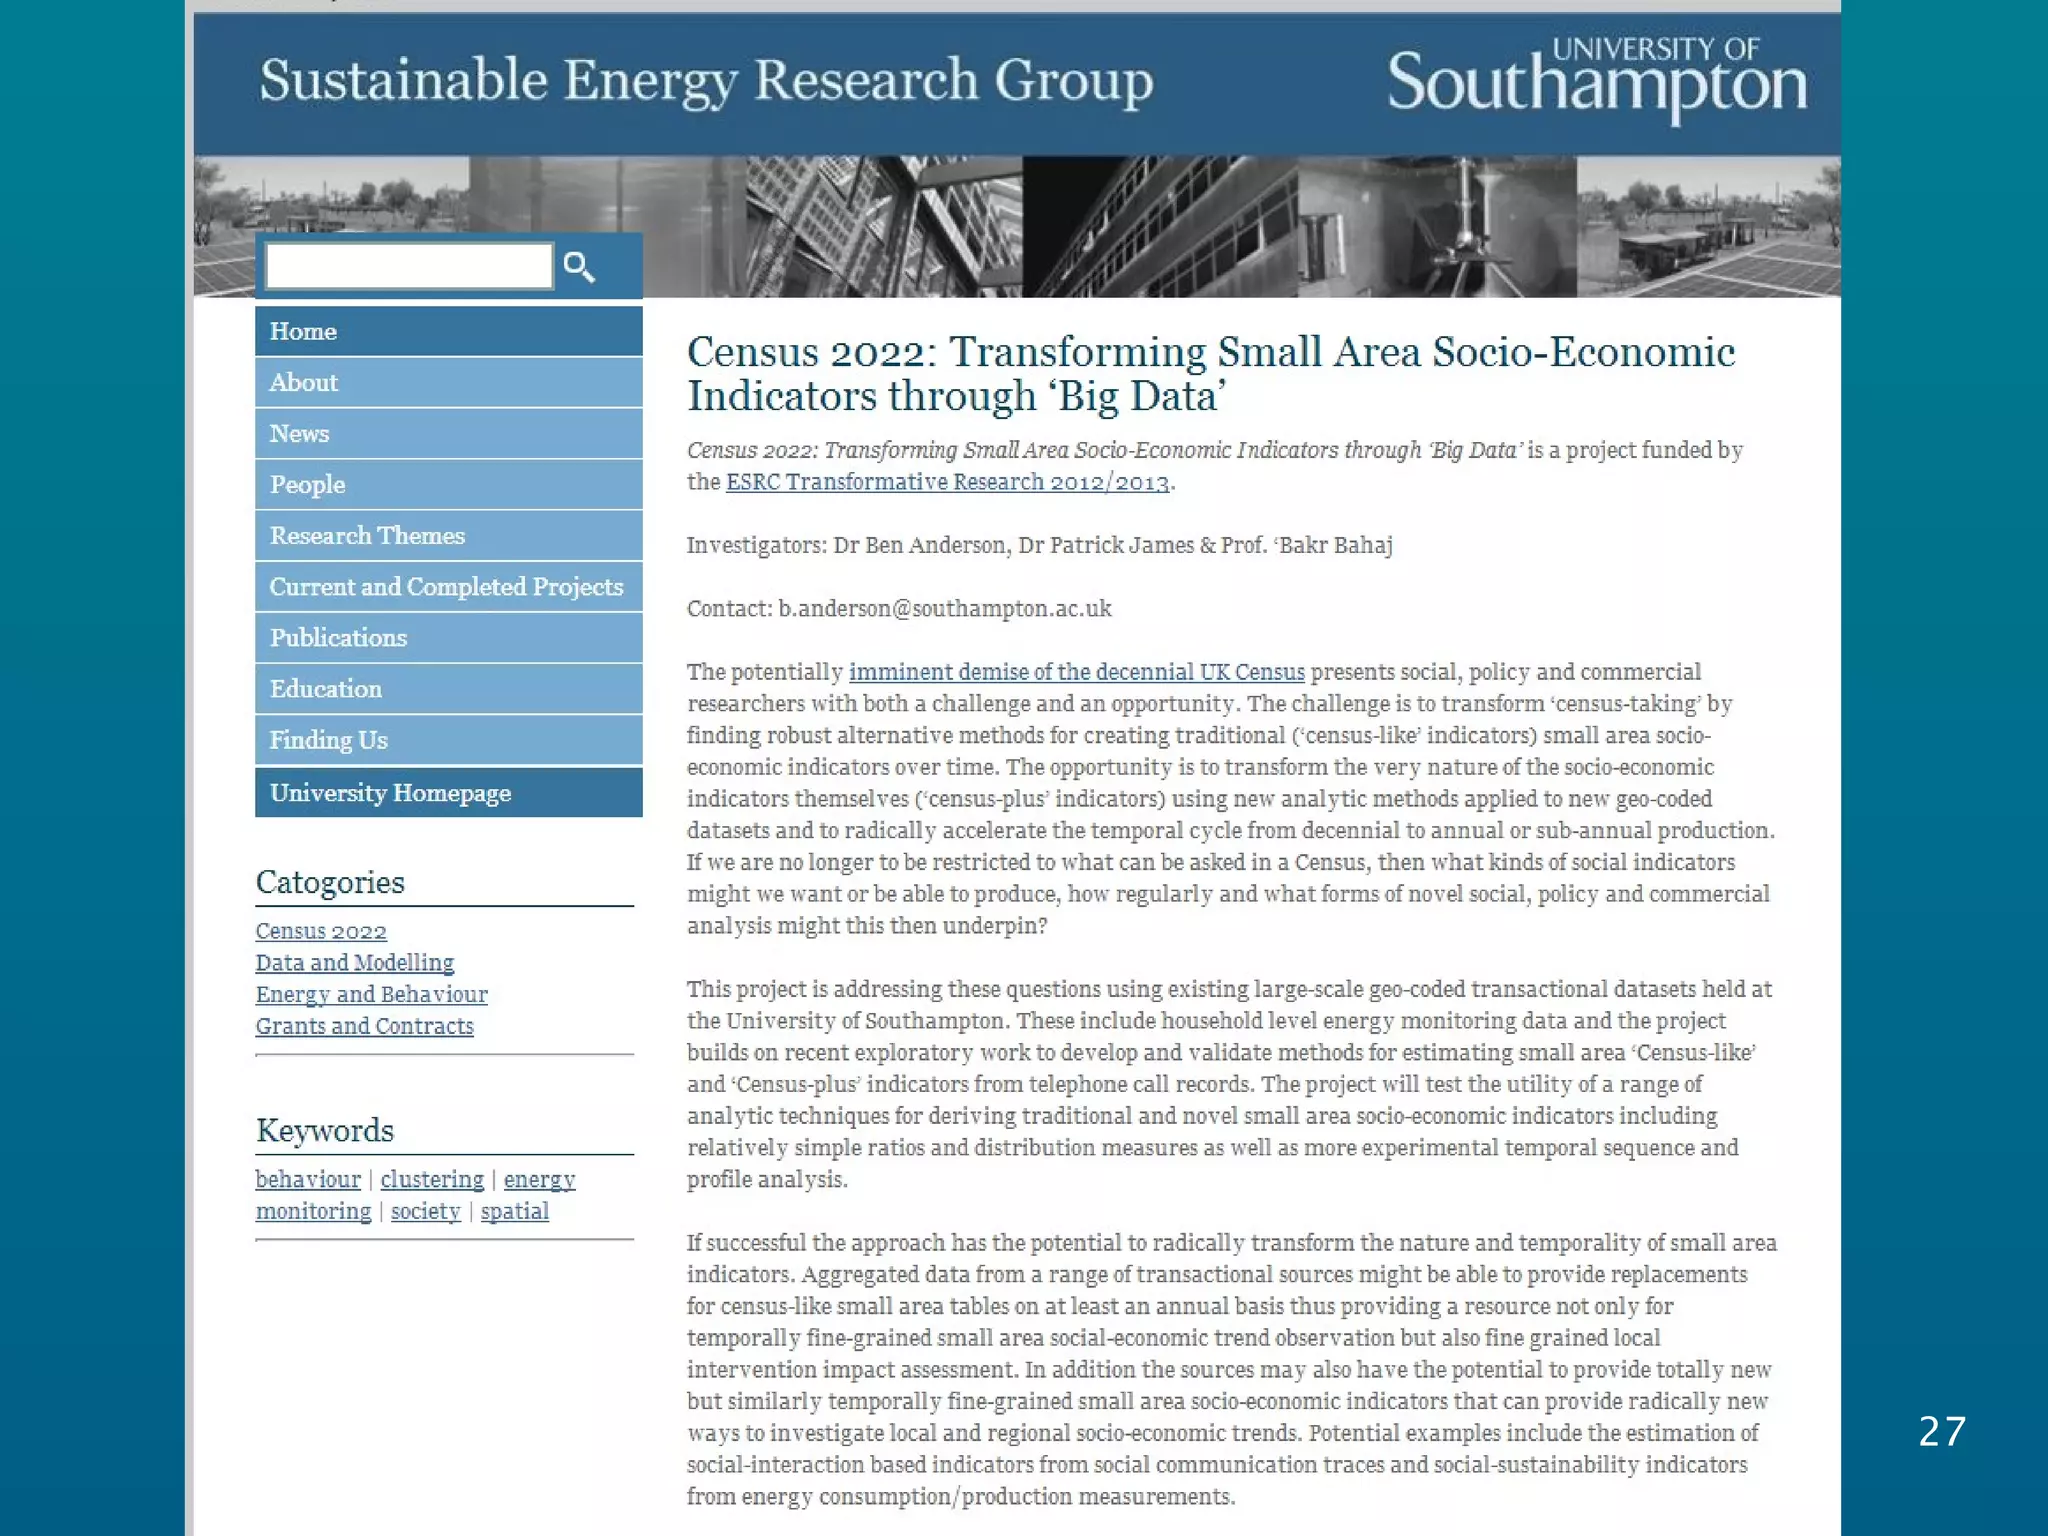

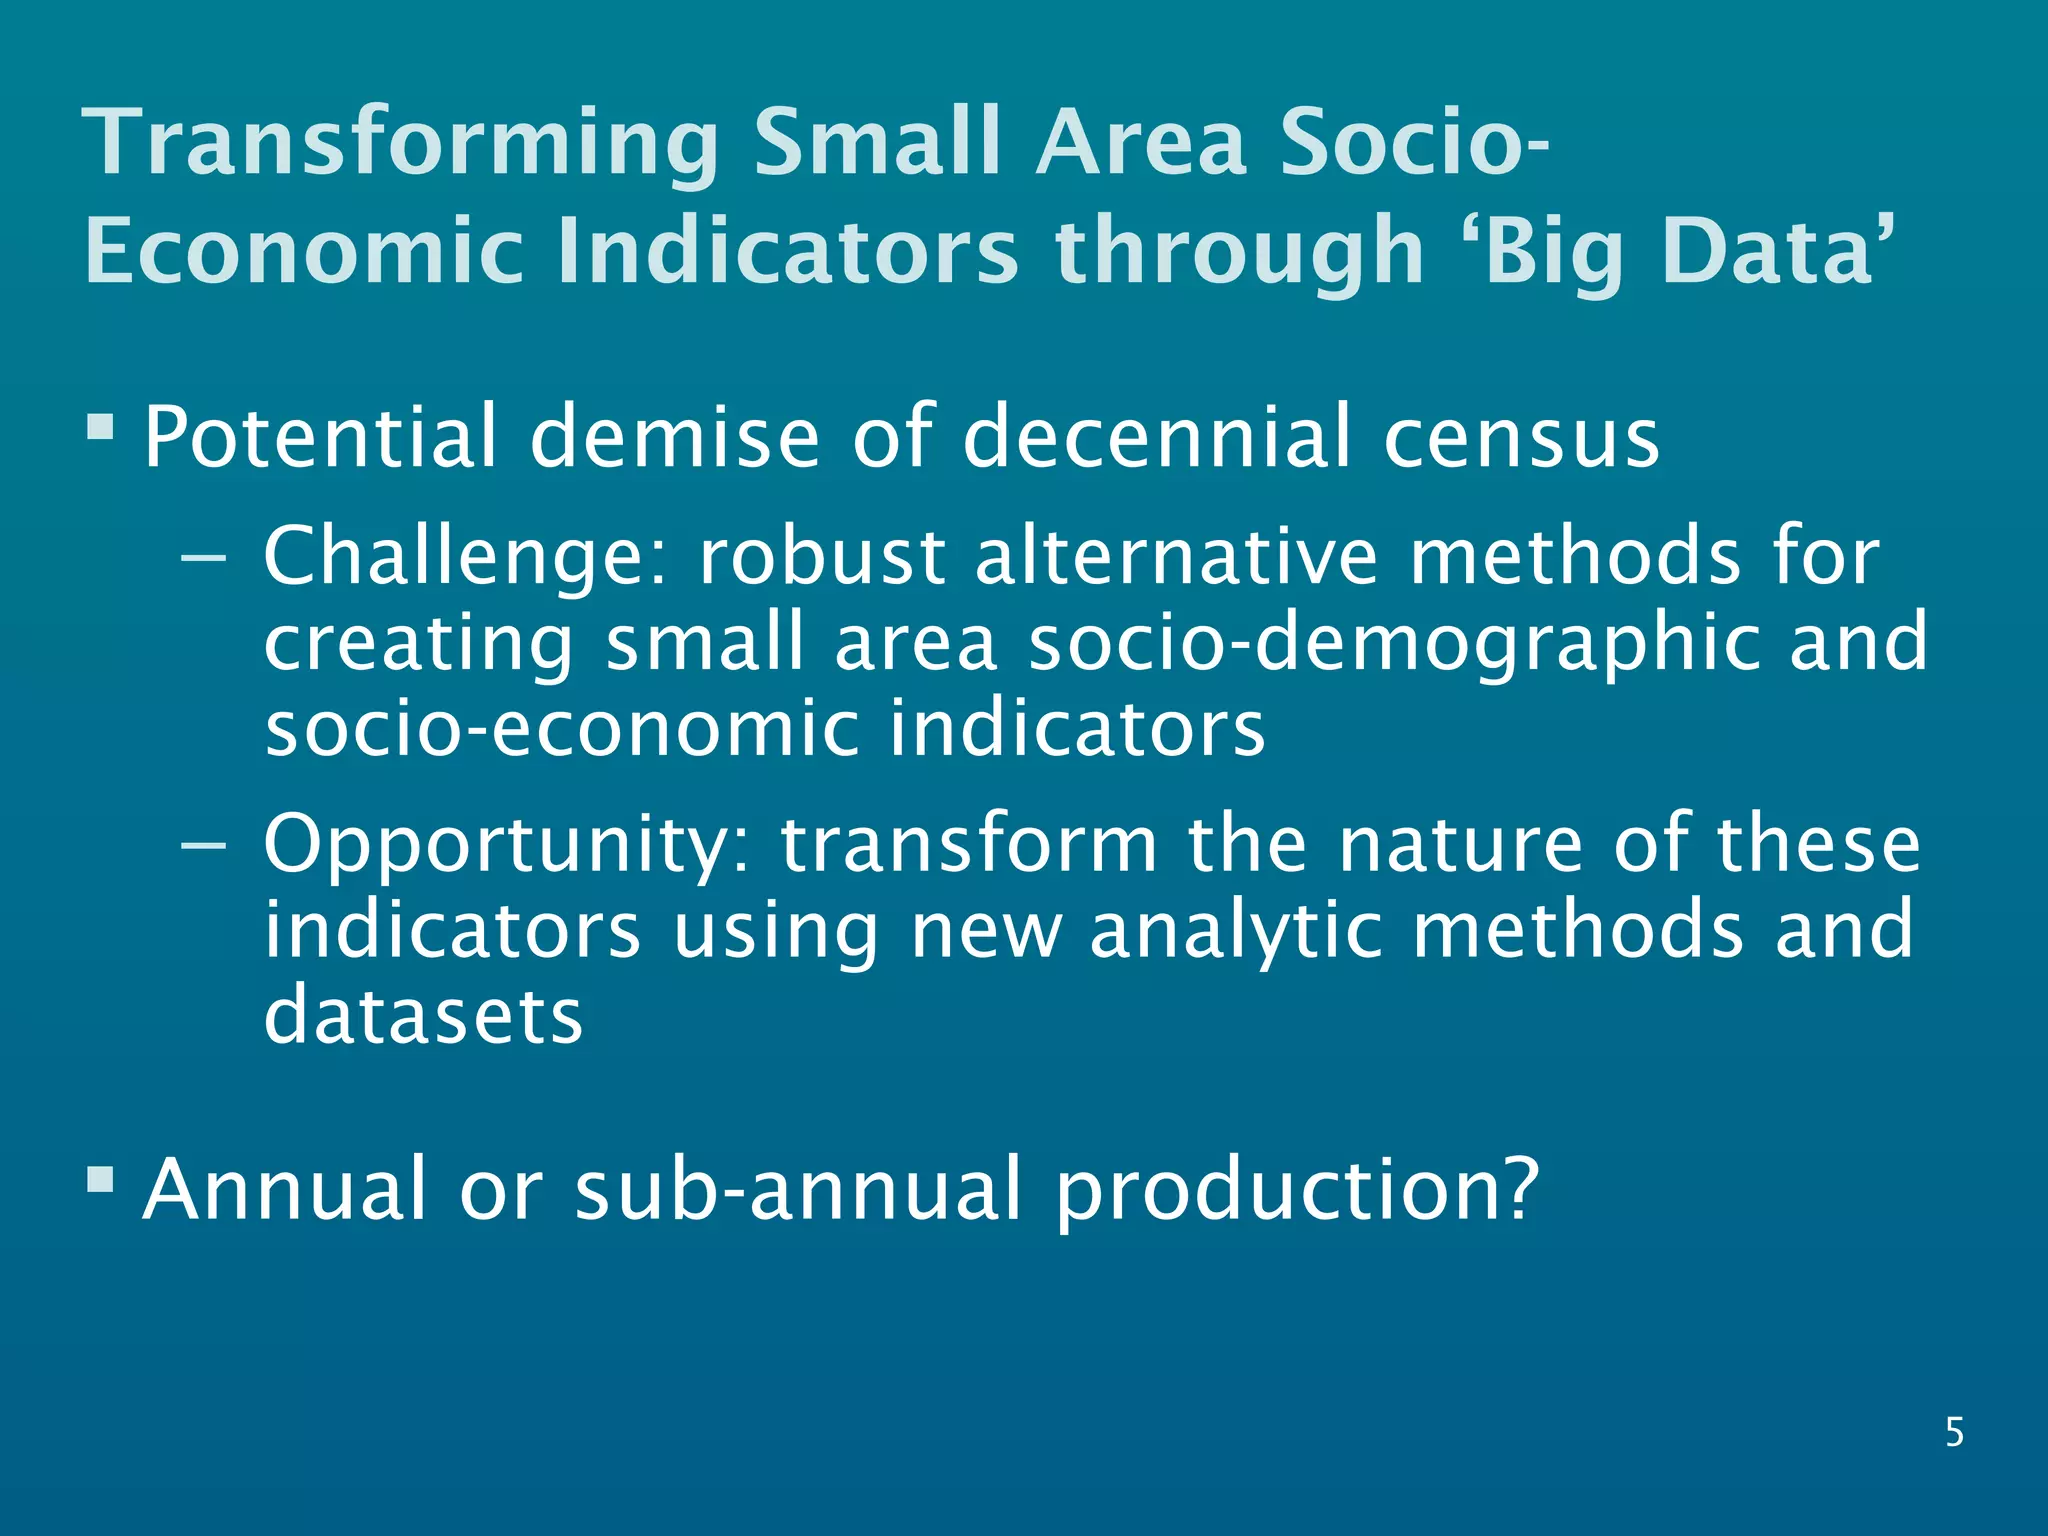
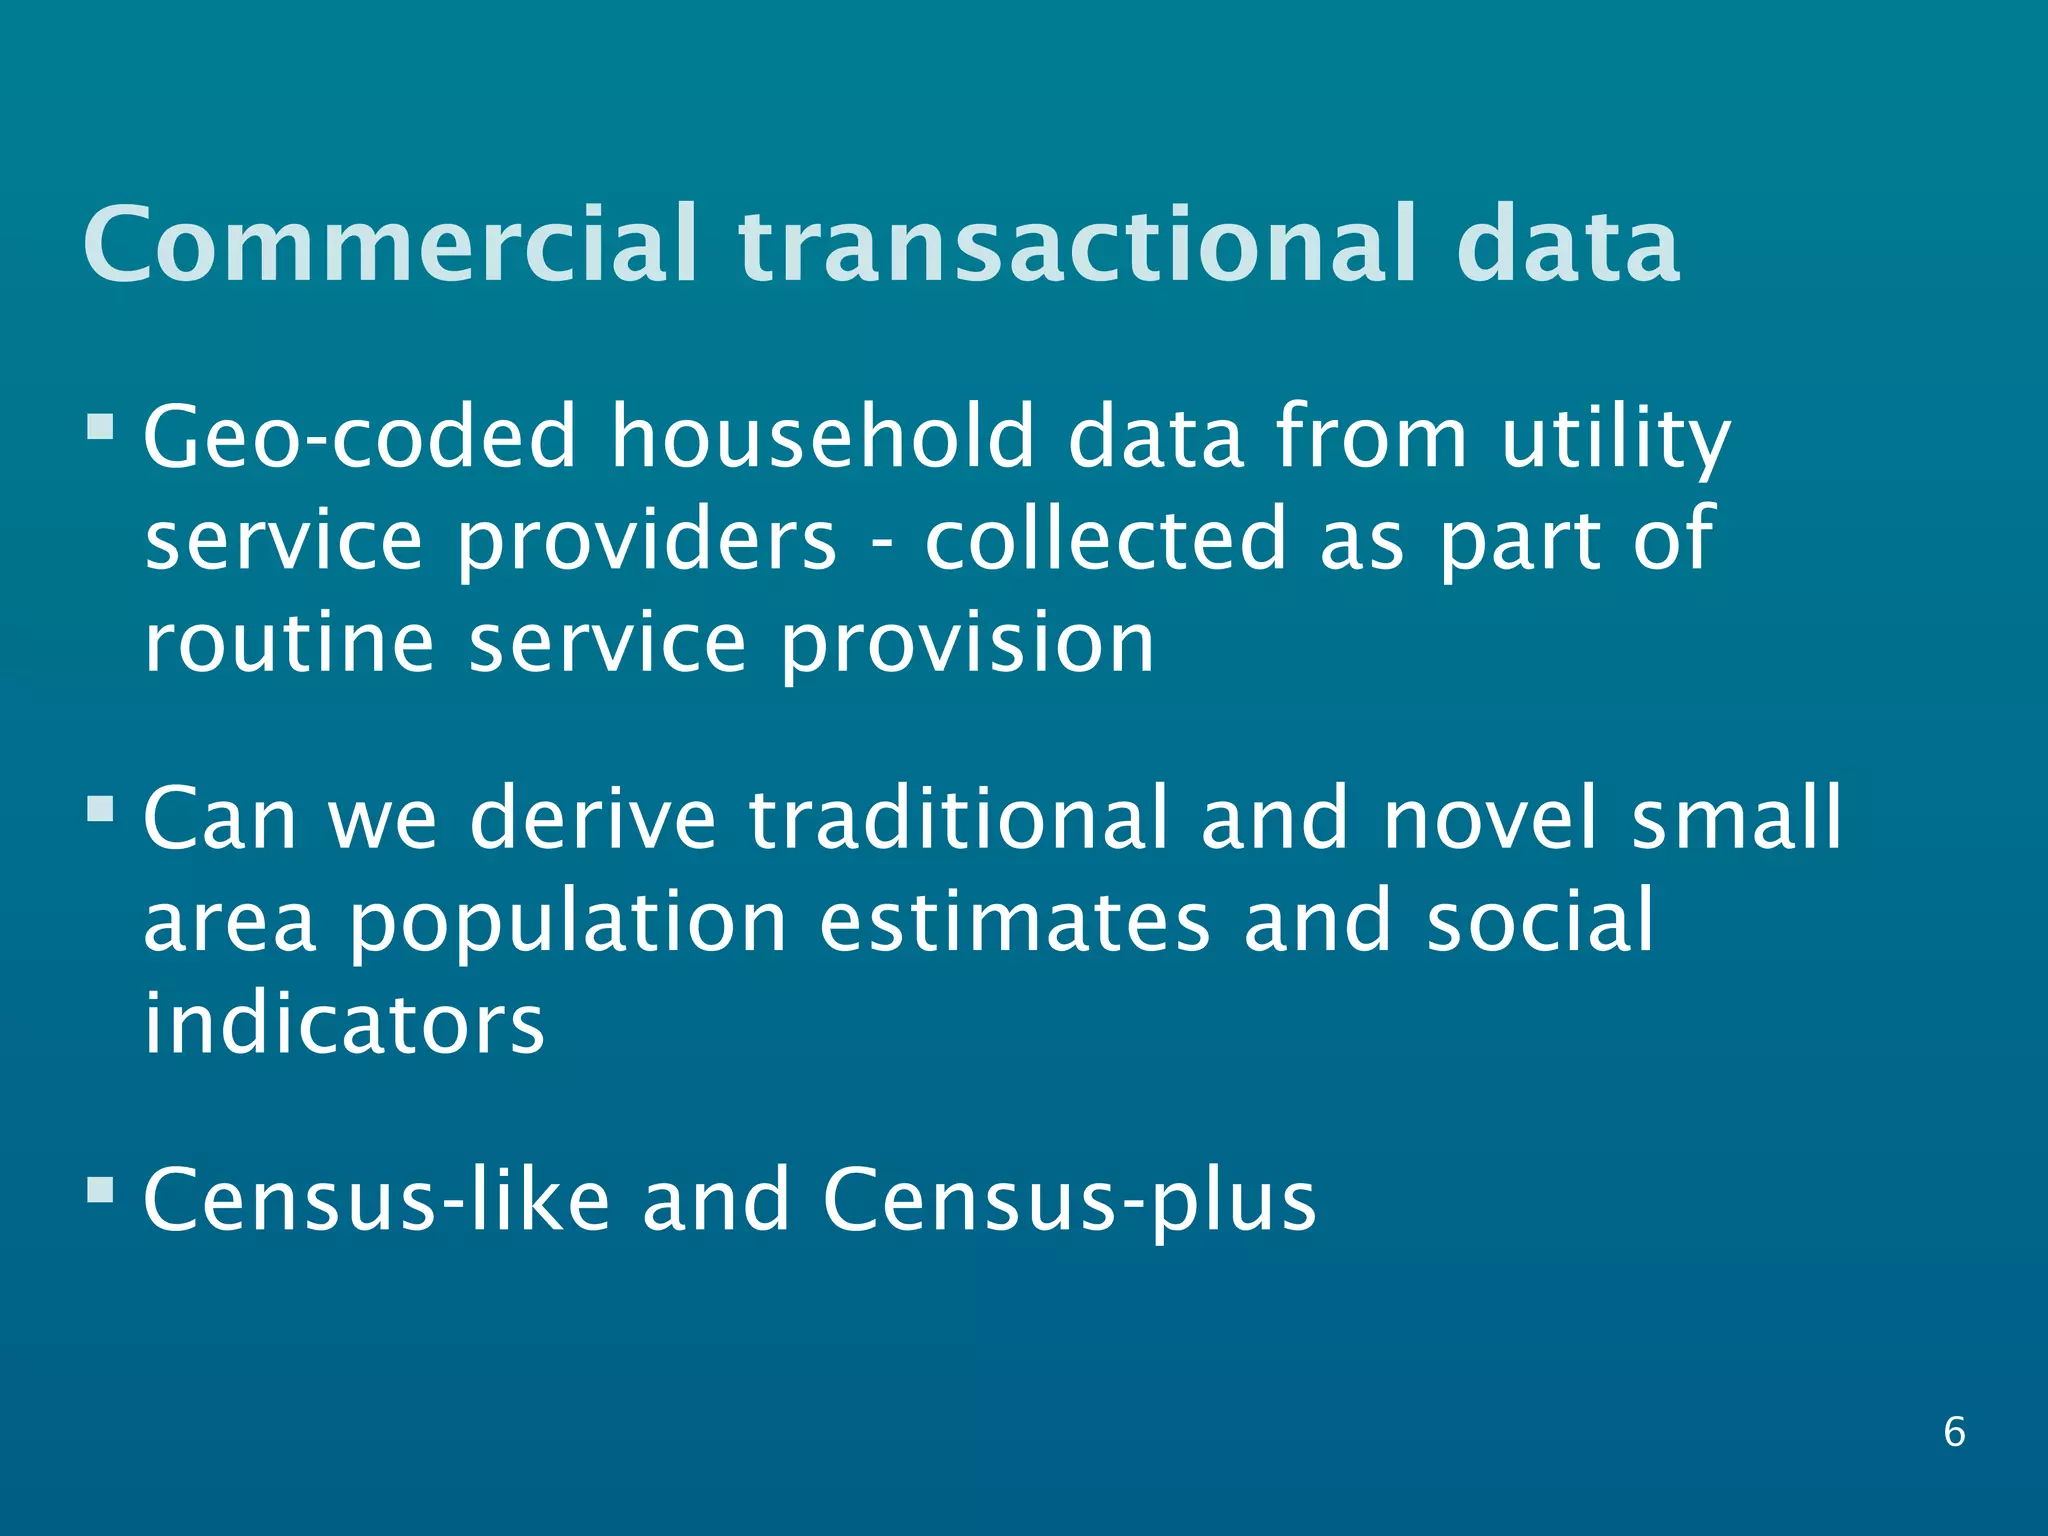
The document discusses a transformative research project that aims to develop alternative methods for creating small area socio-demographic and socio-economic indicators using 'big data' in light of the potential demise of the decennial census. It highlights the use of geo-coded household data from utility providers to derive both traditional and novel indicators, focusing on energy consumption patterns and household characteristics. The project also seeks to engage stakeholders and explore methodologies to establish new analytics and data collection approaches.