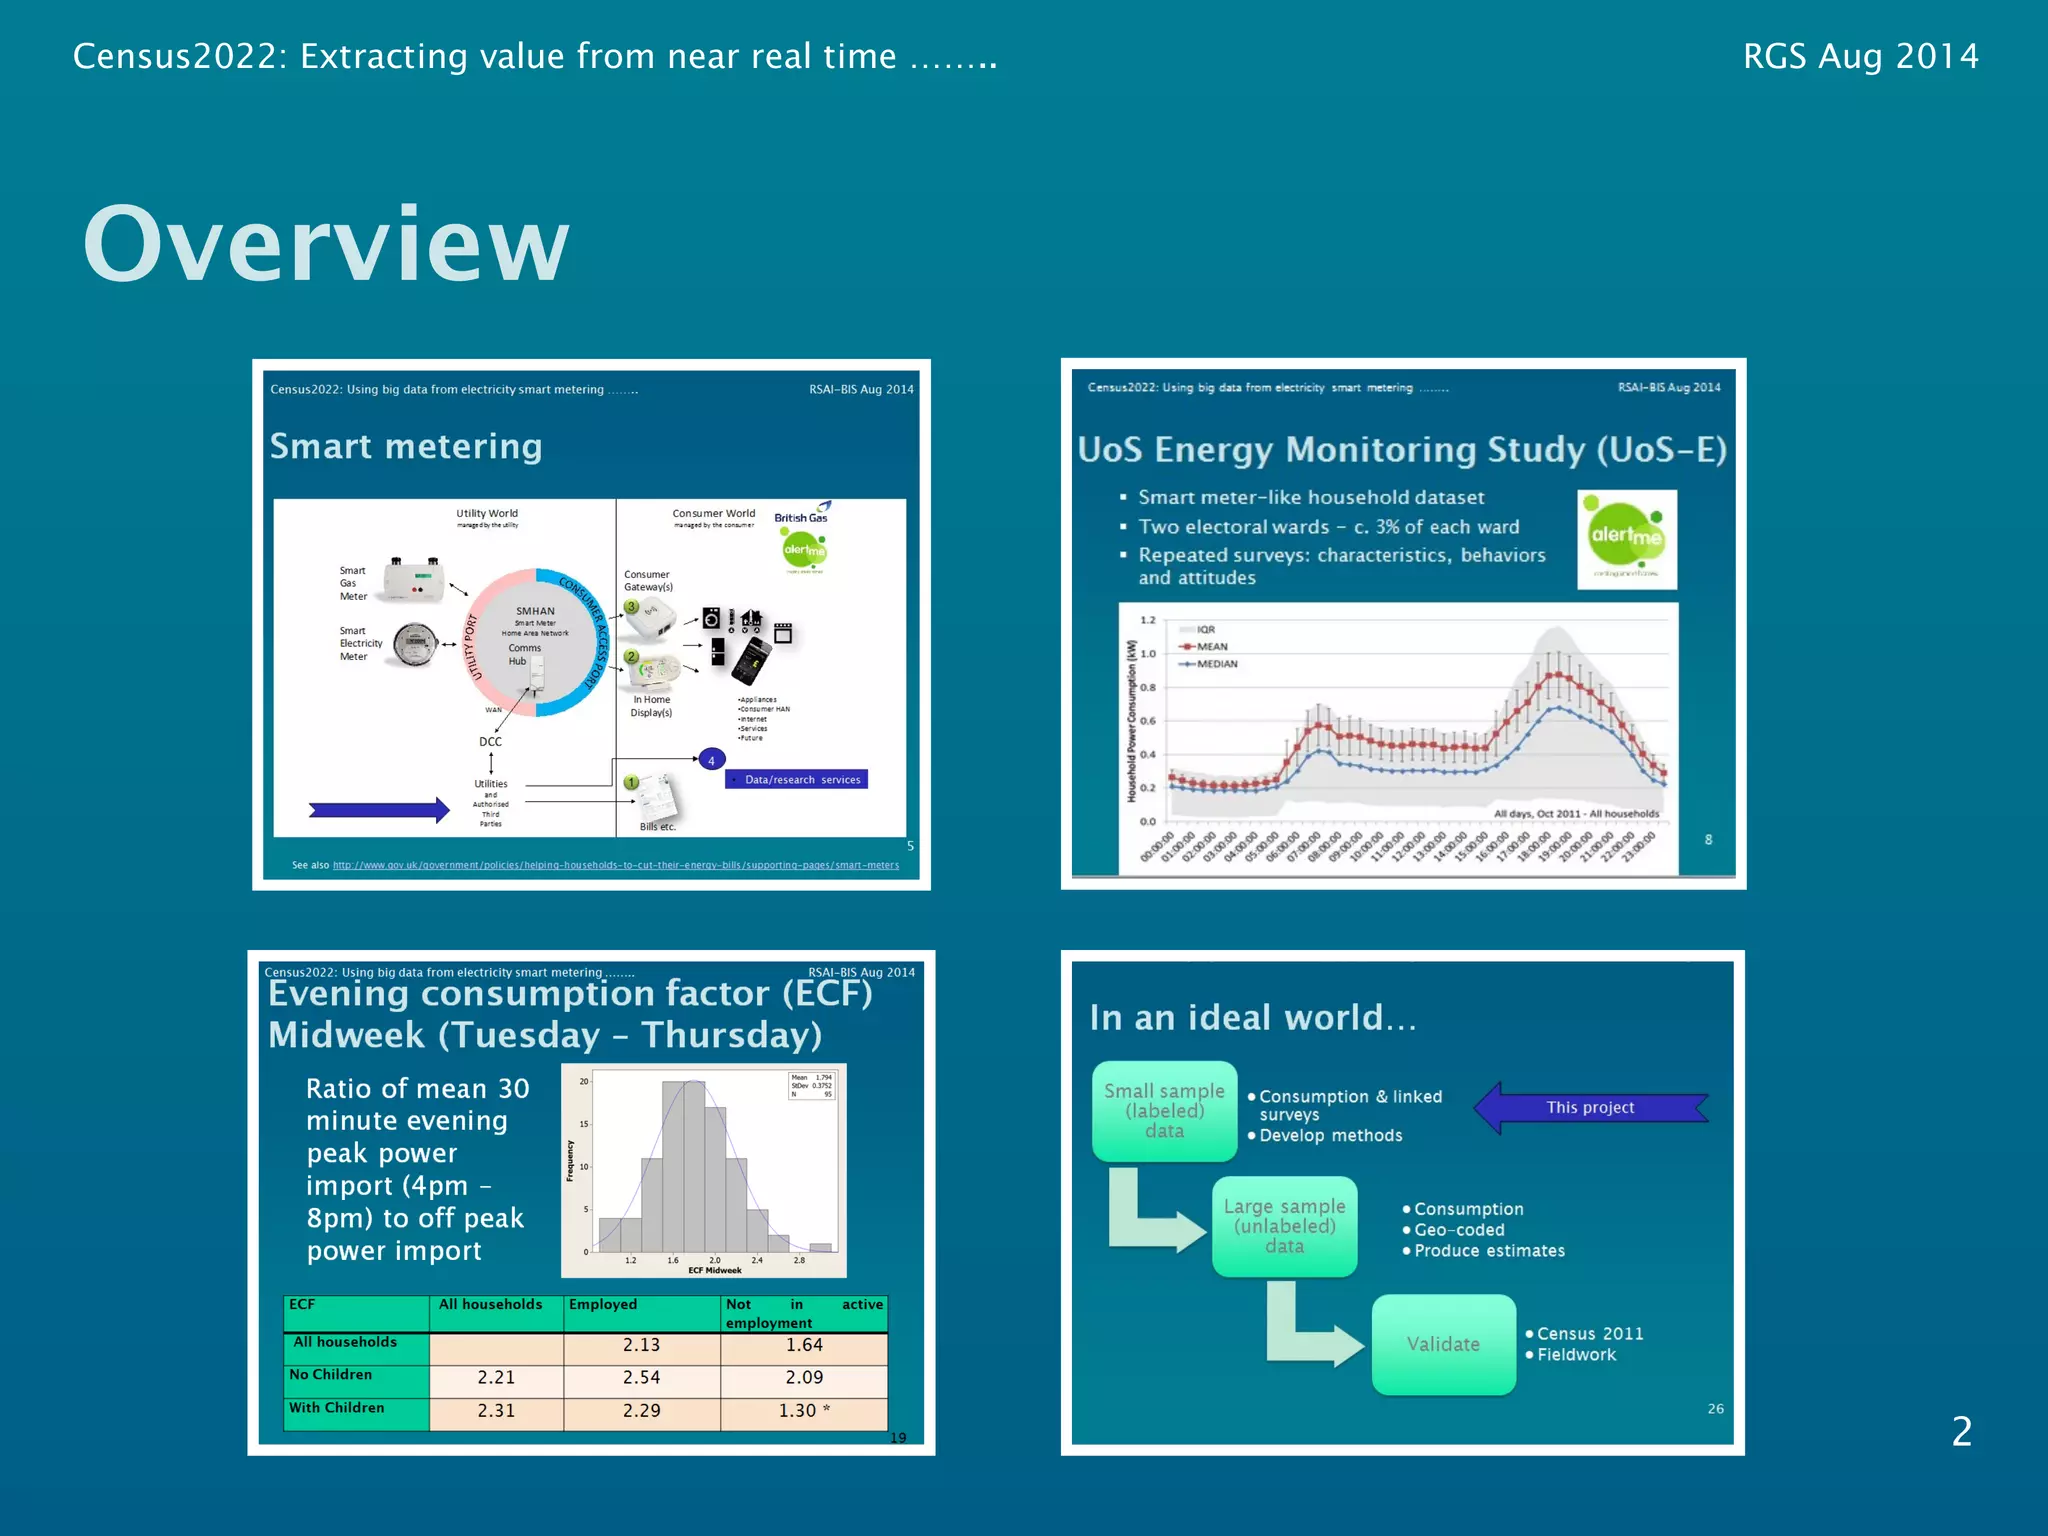
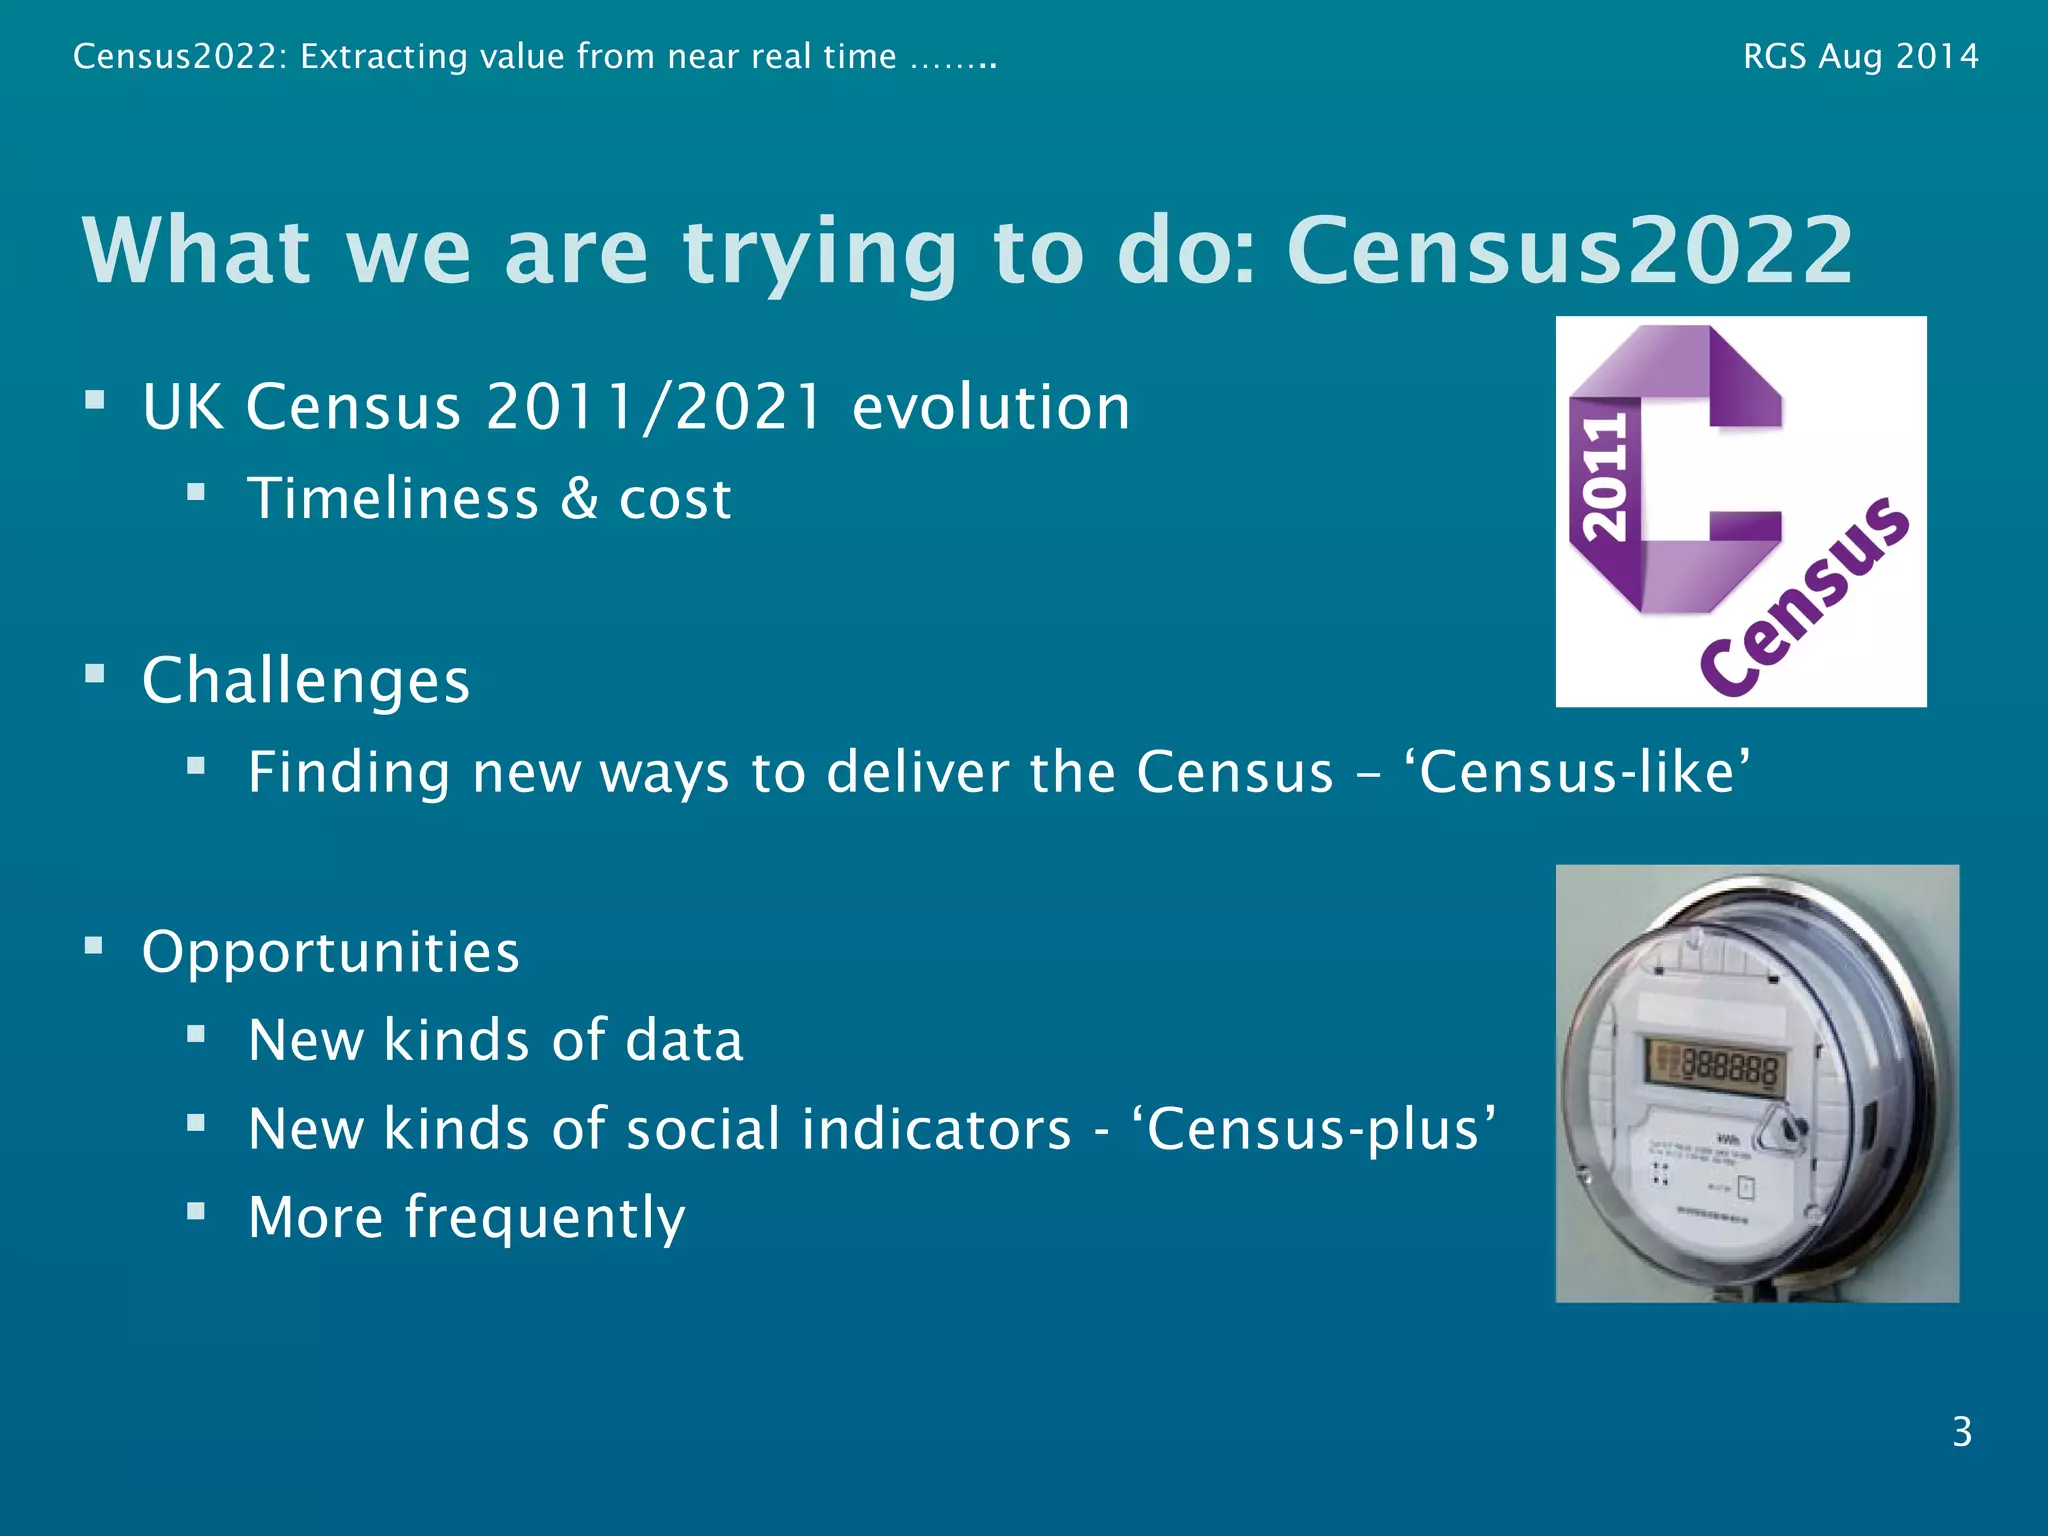
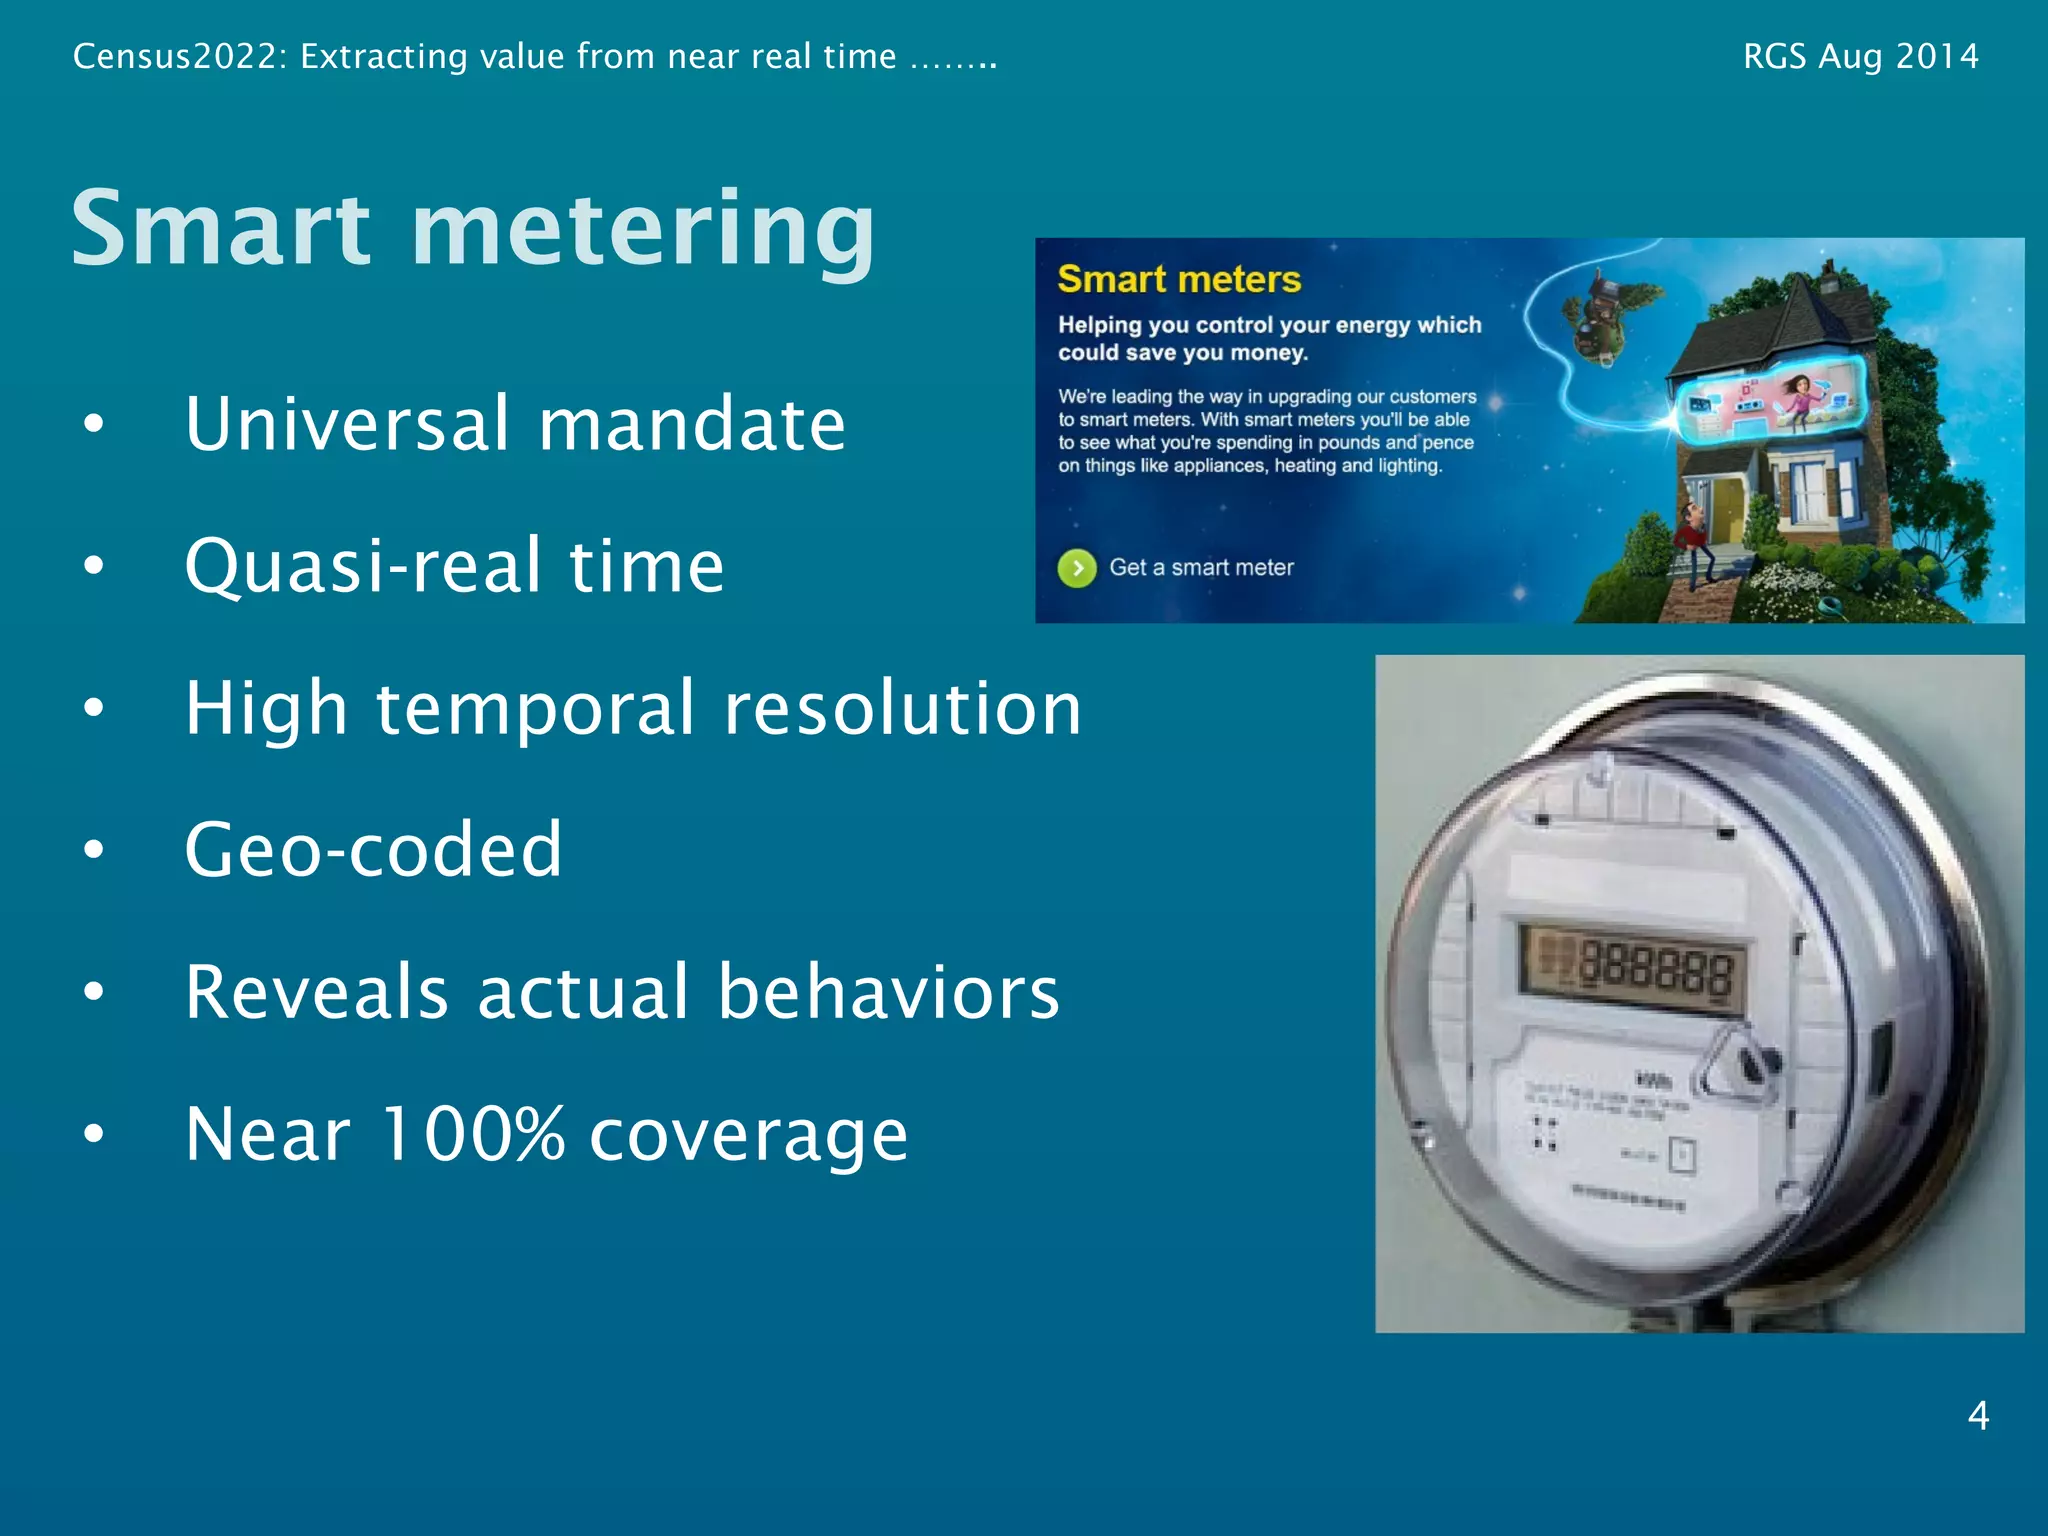
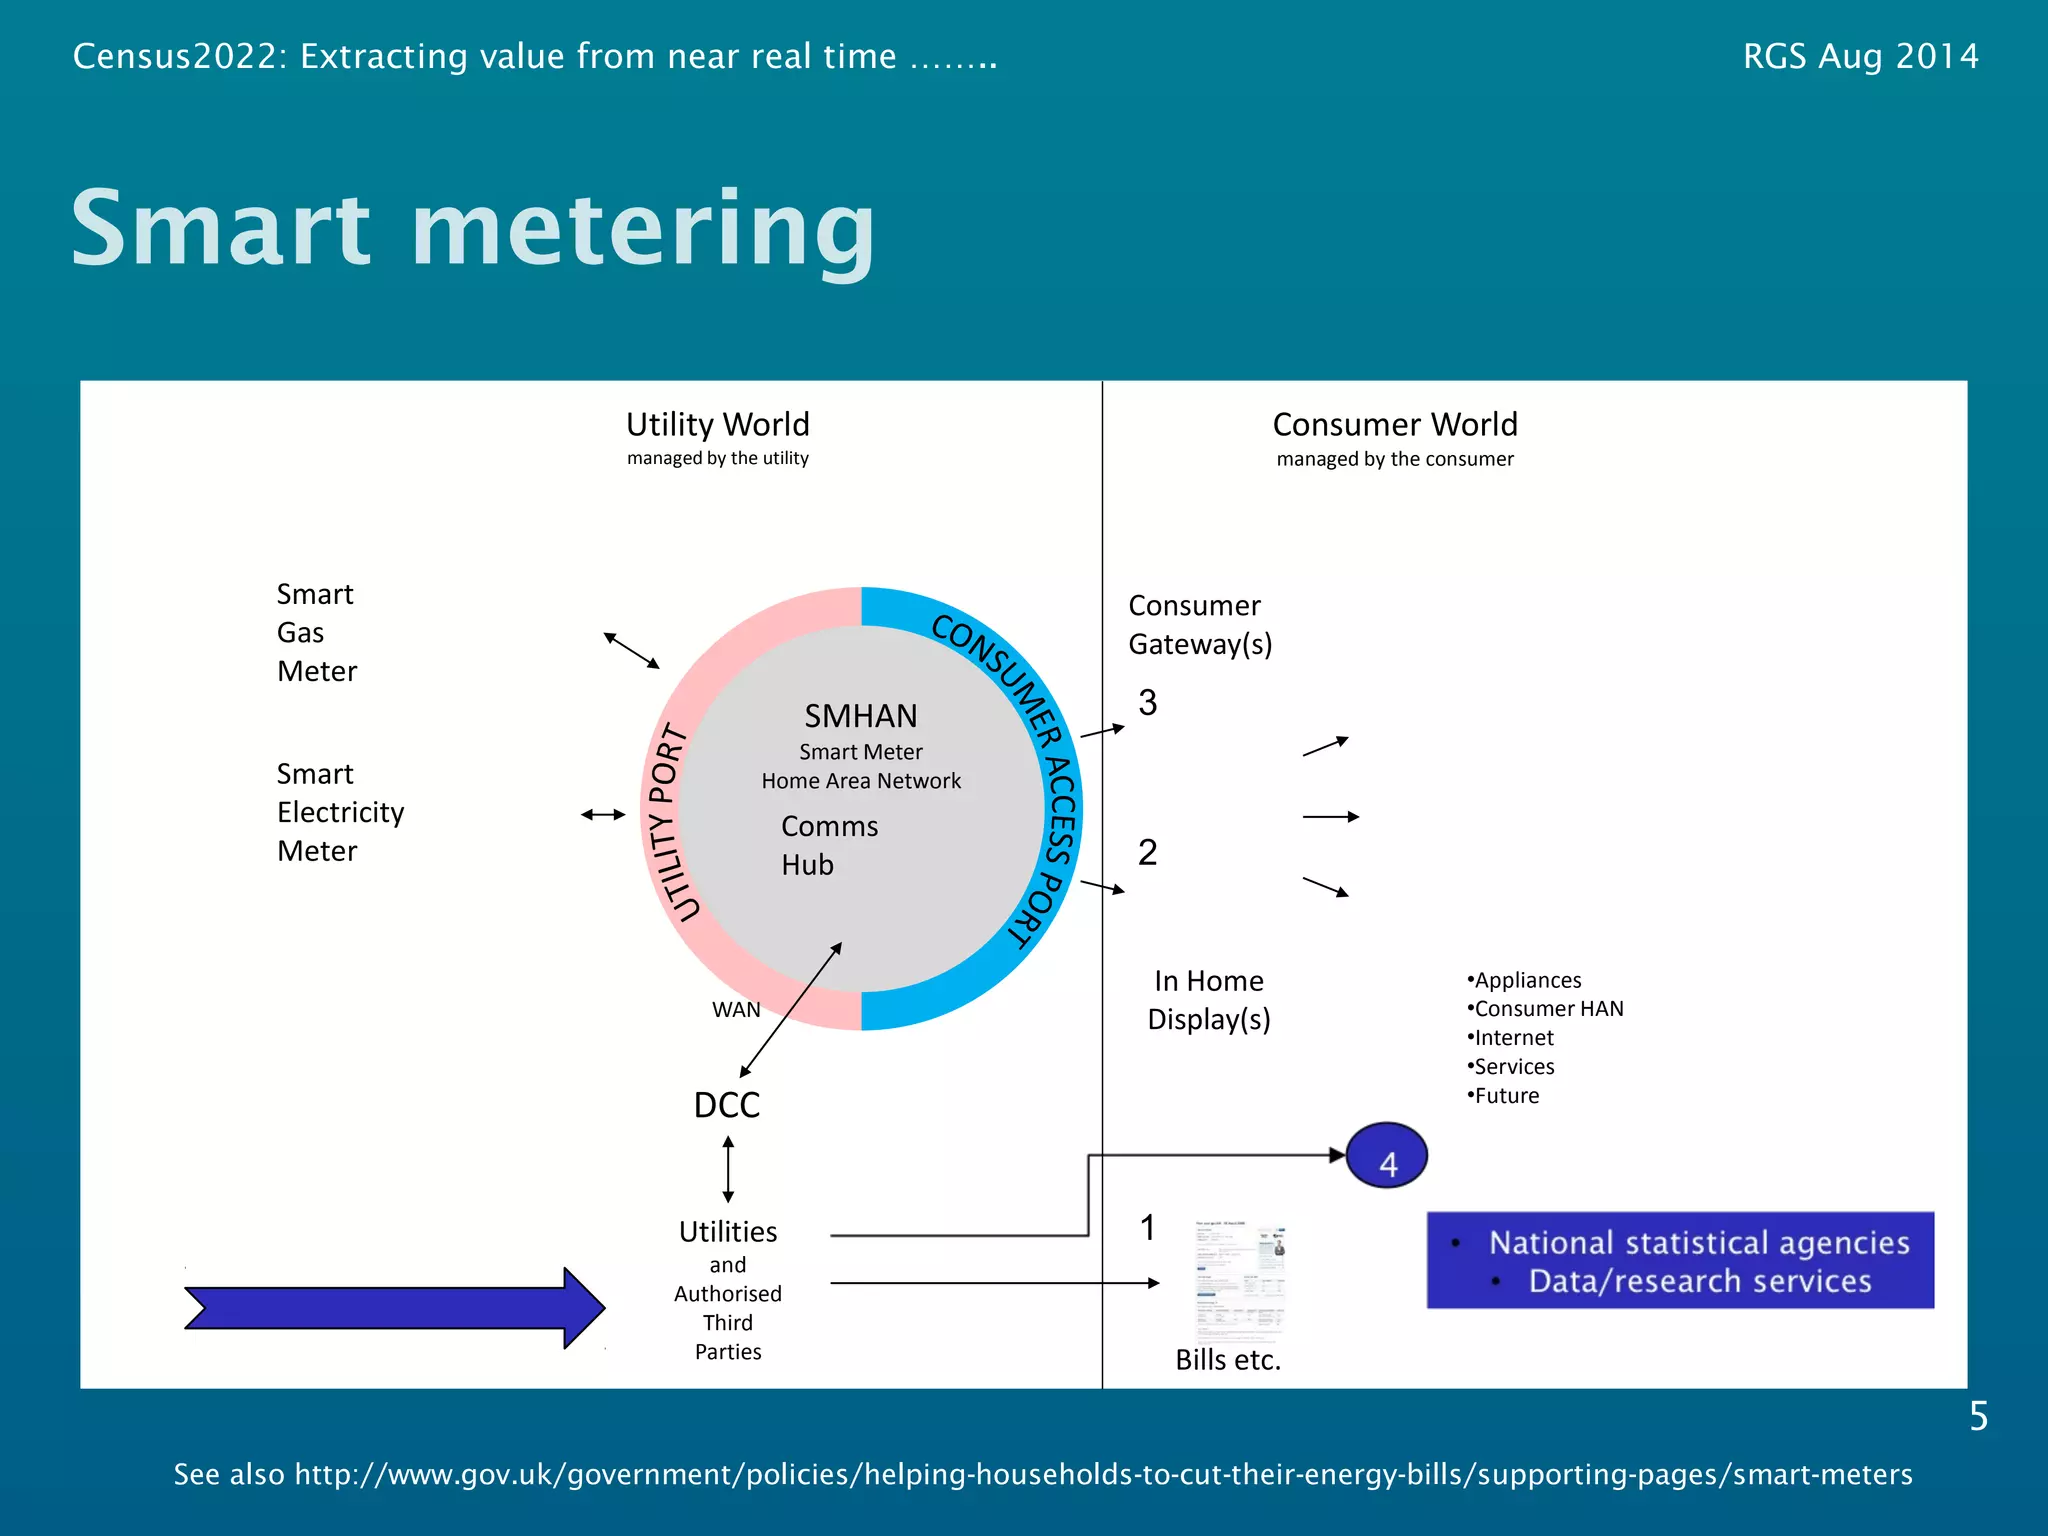
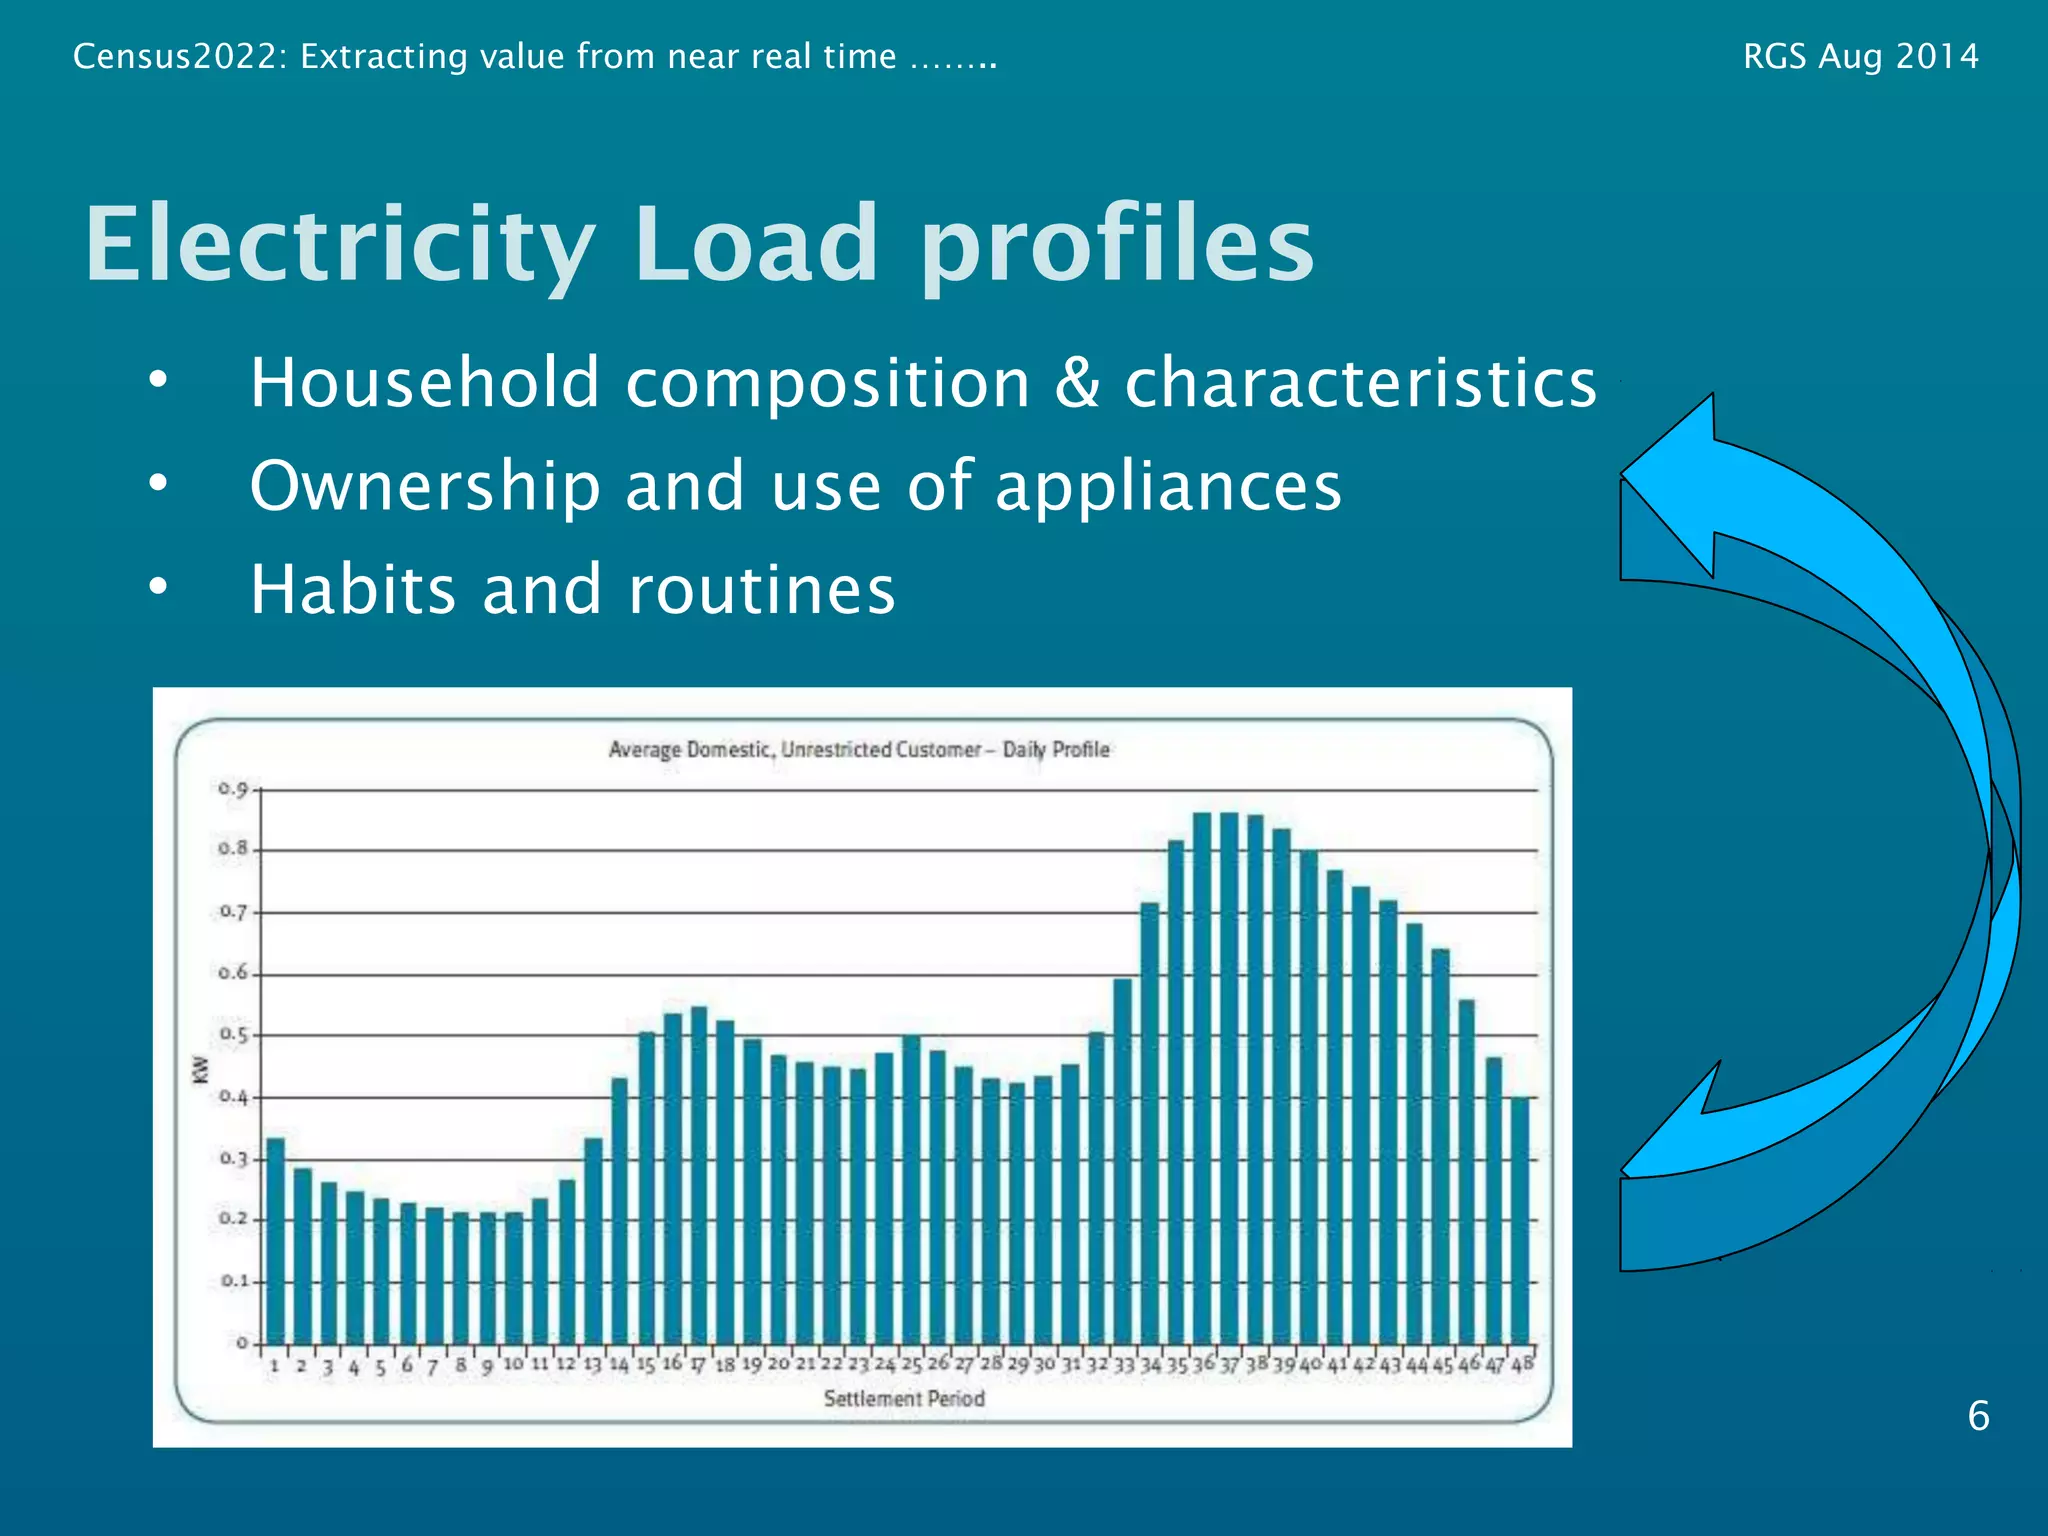
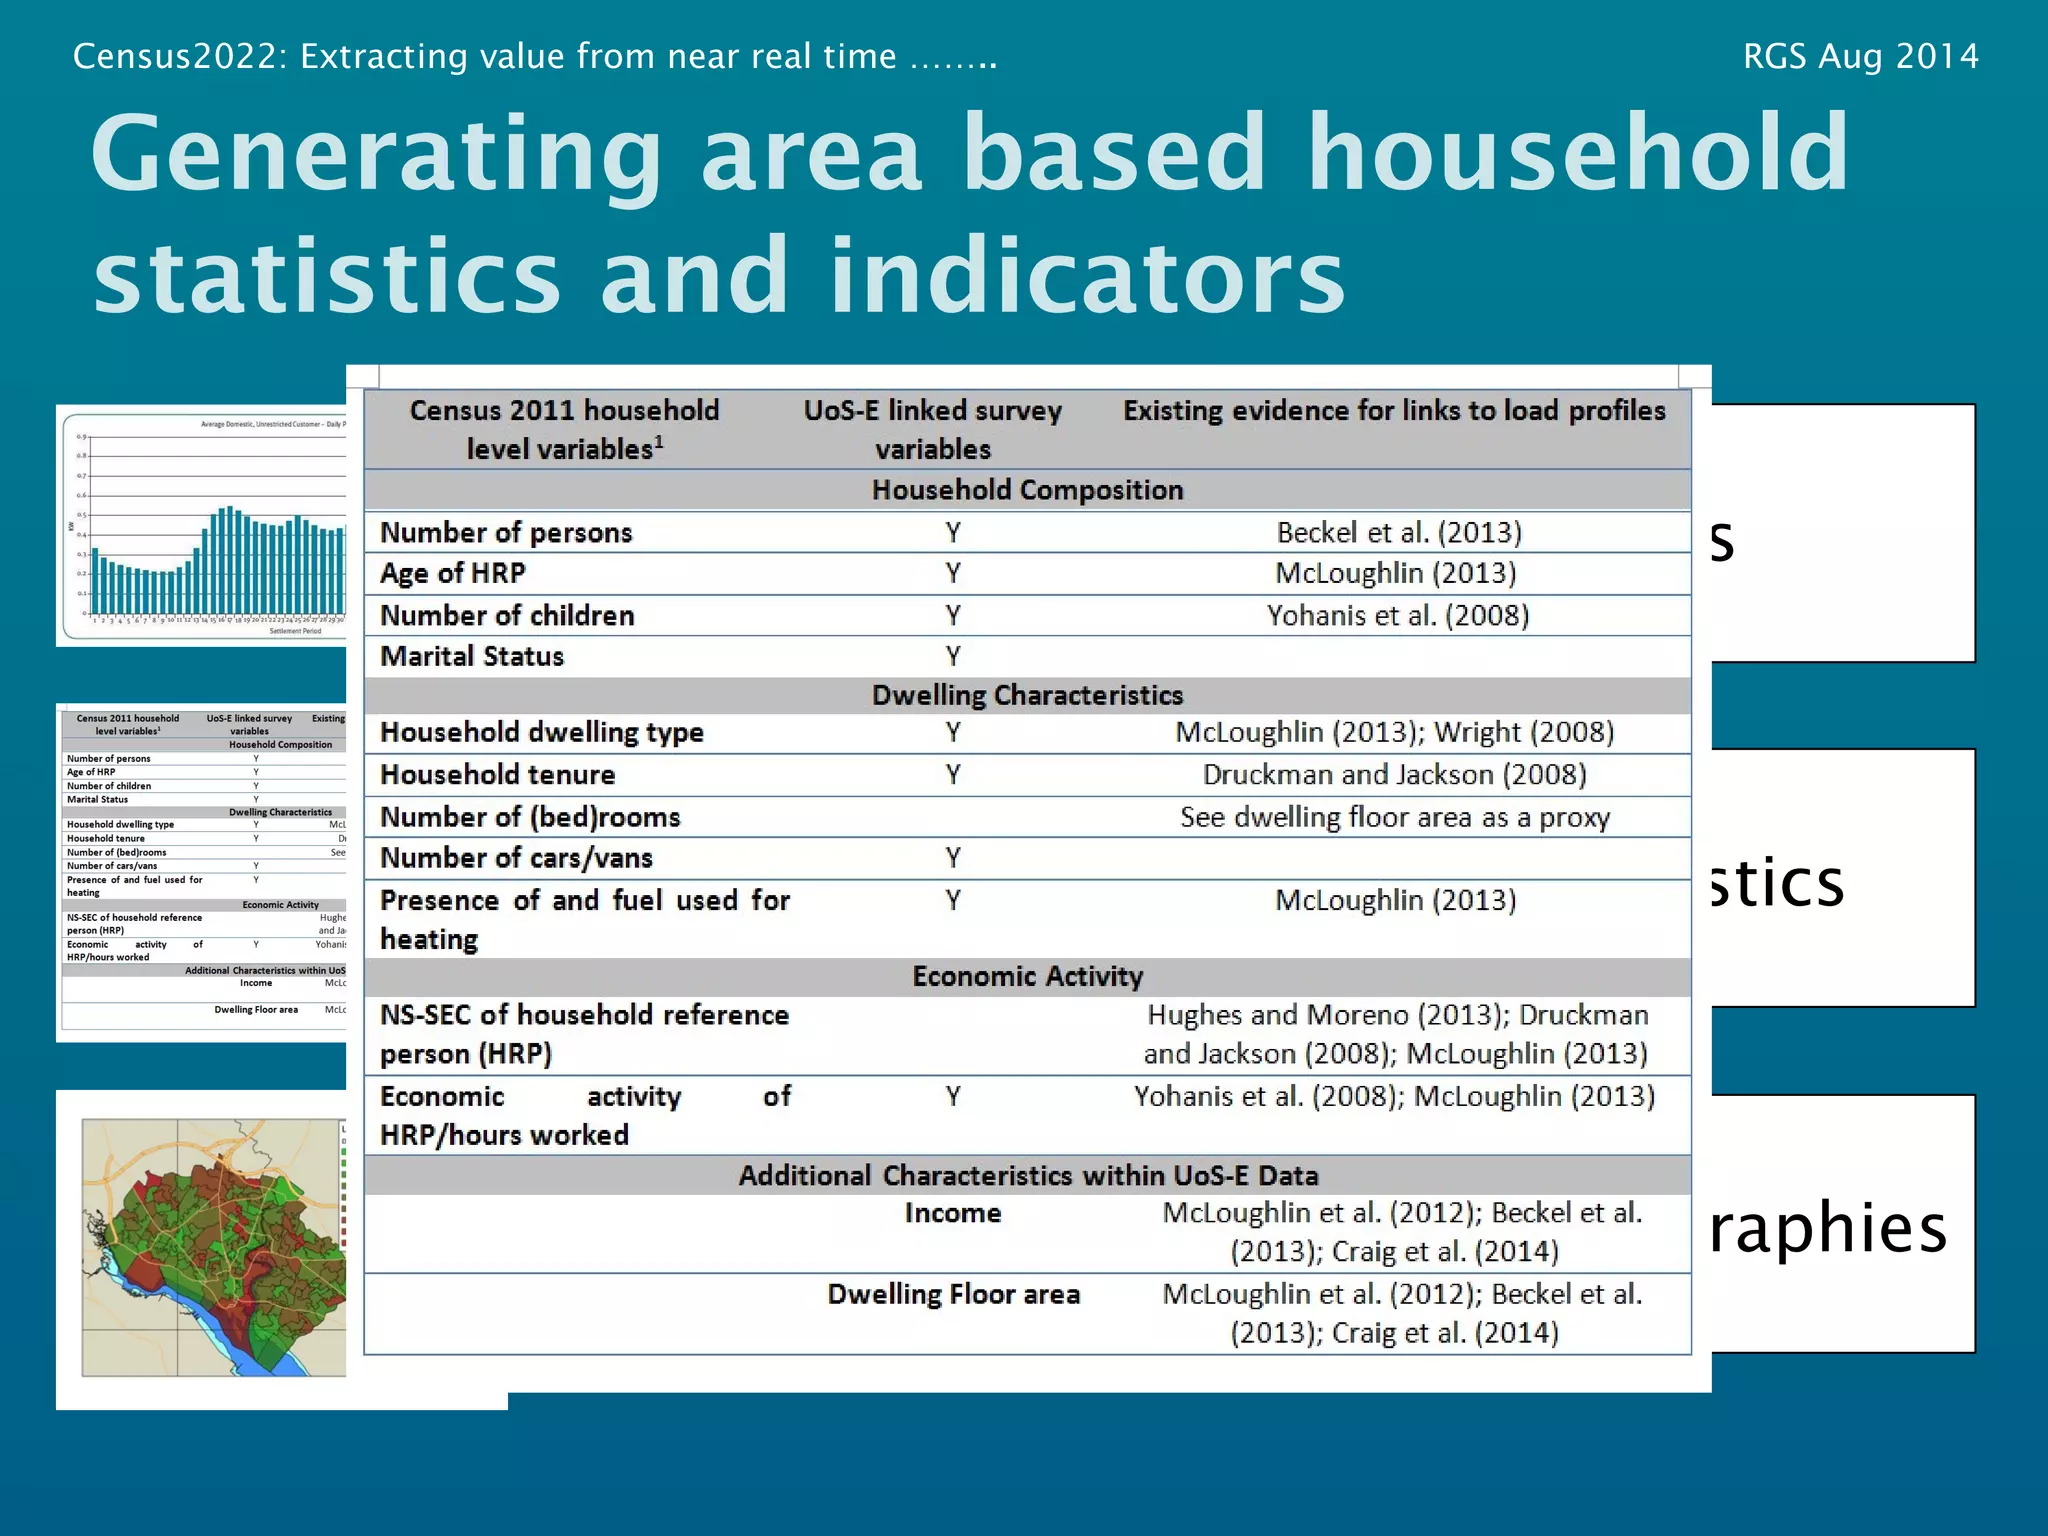
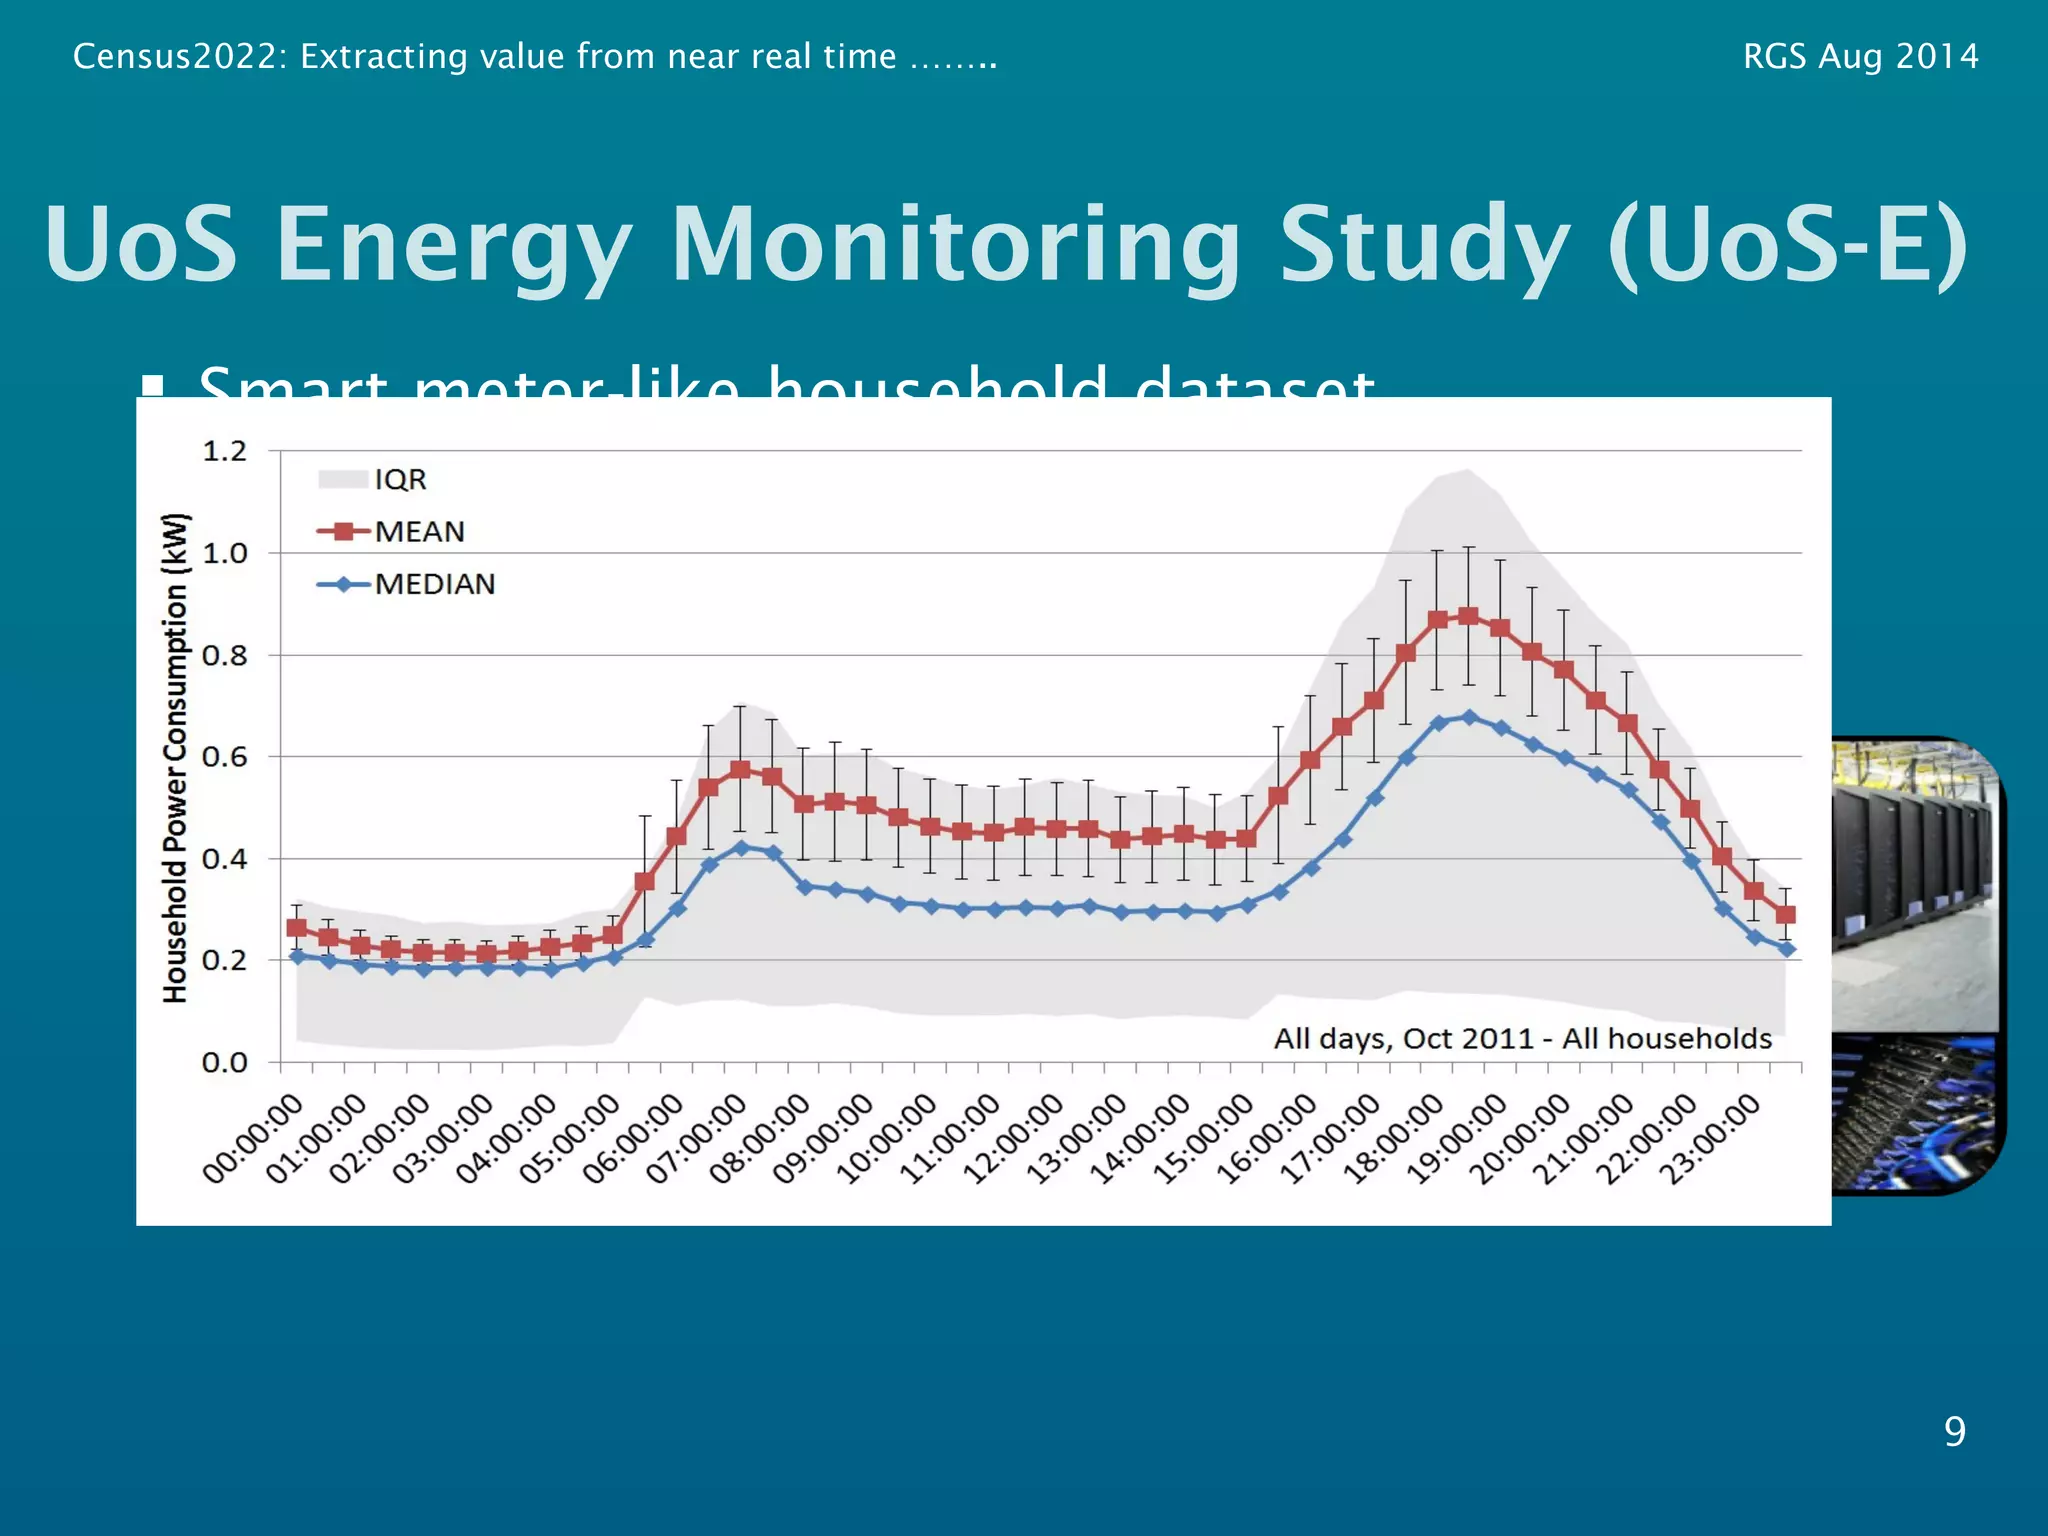
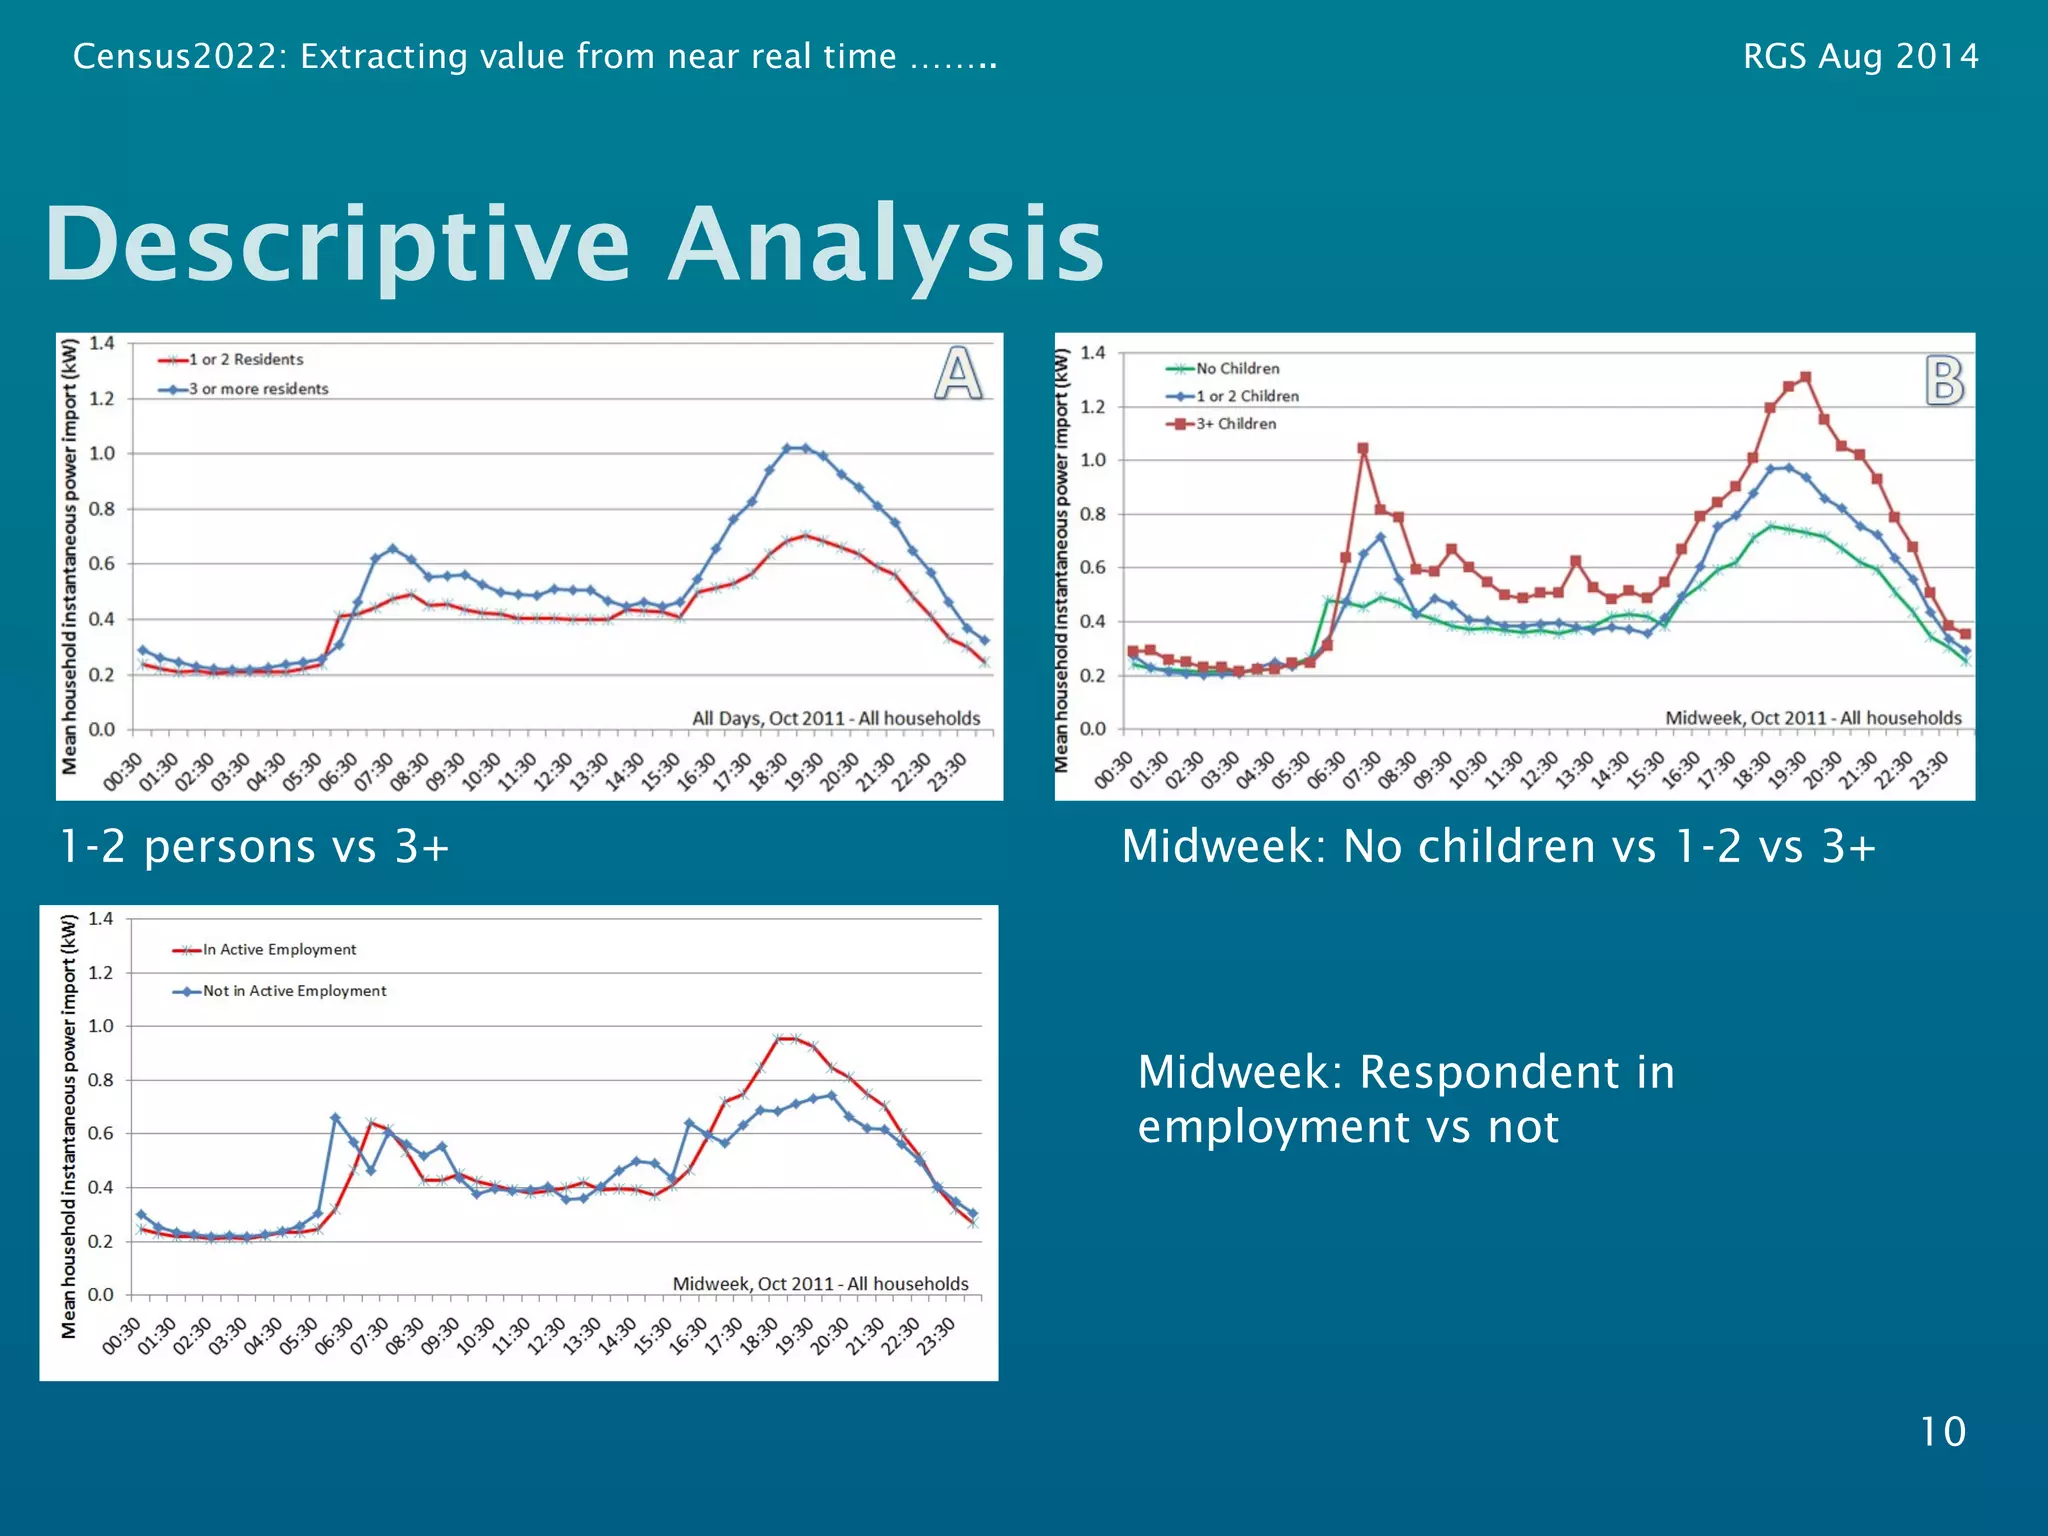
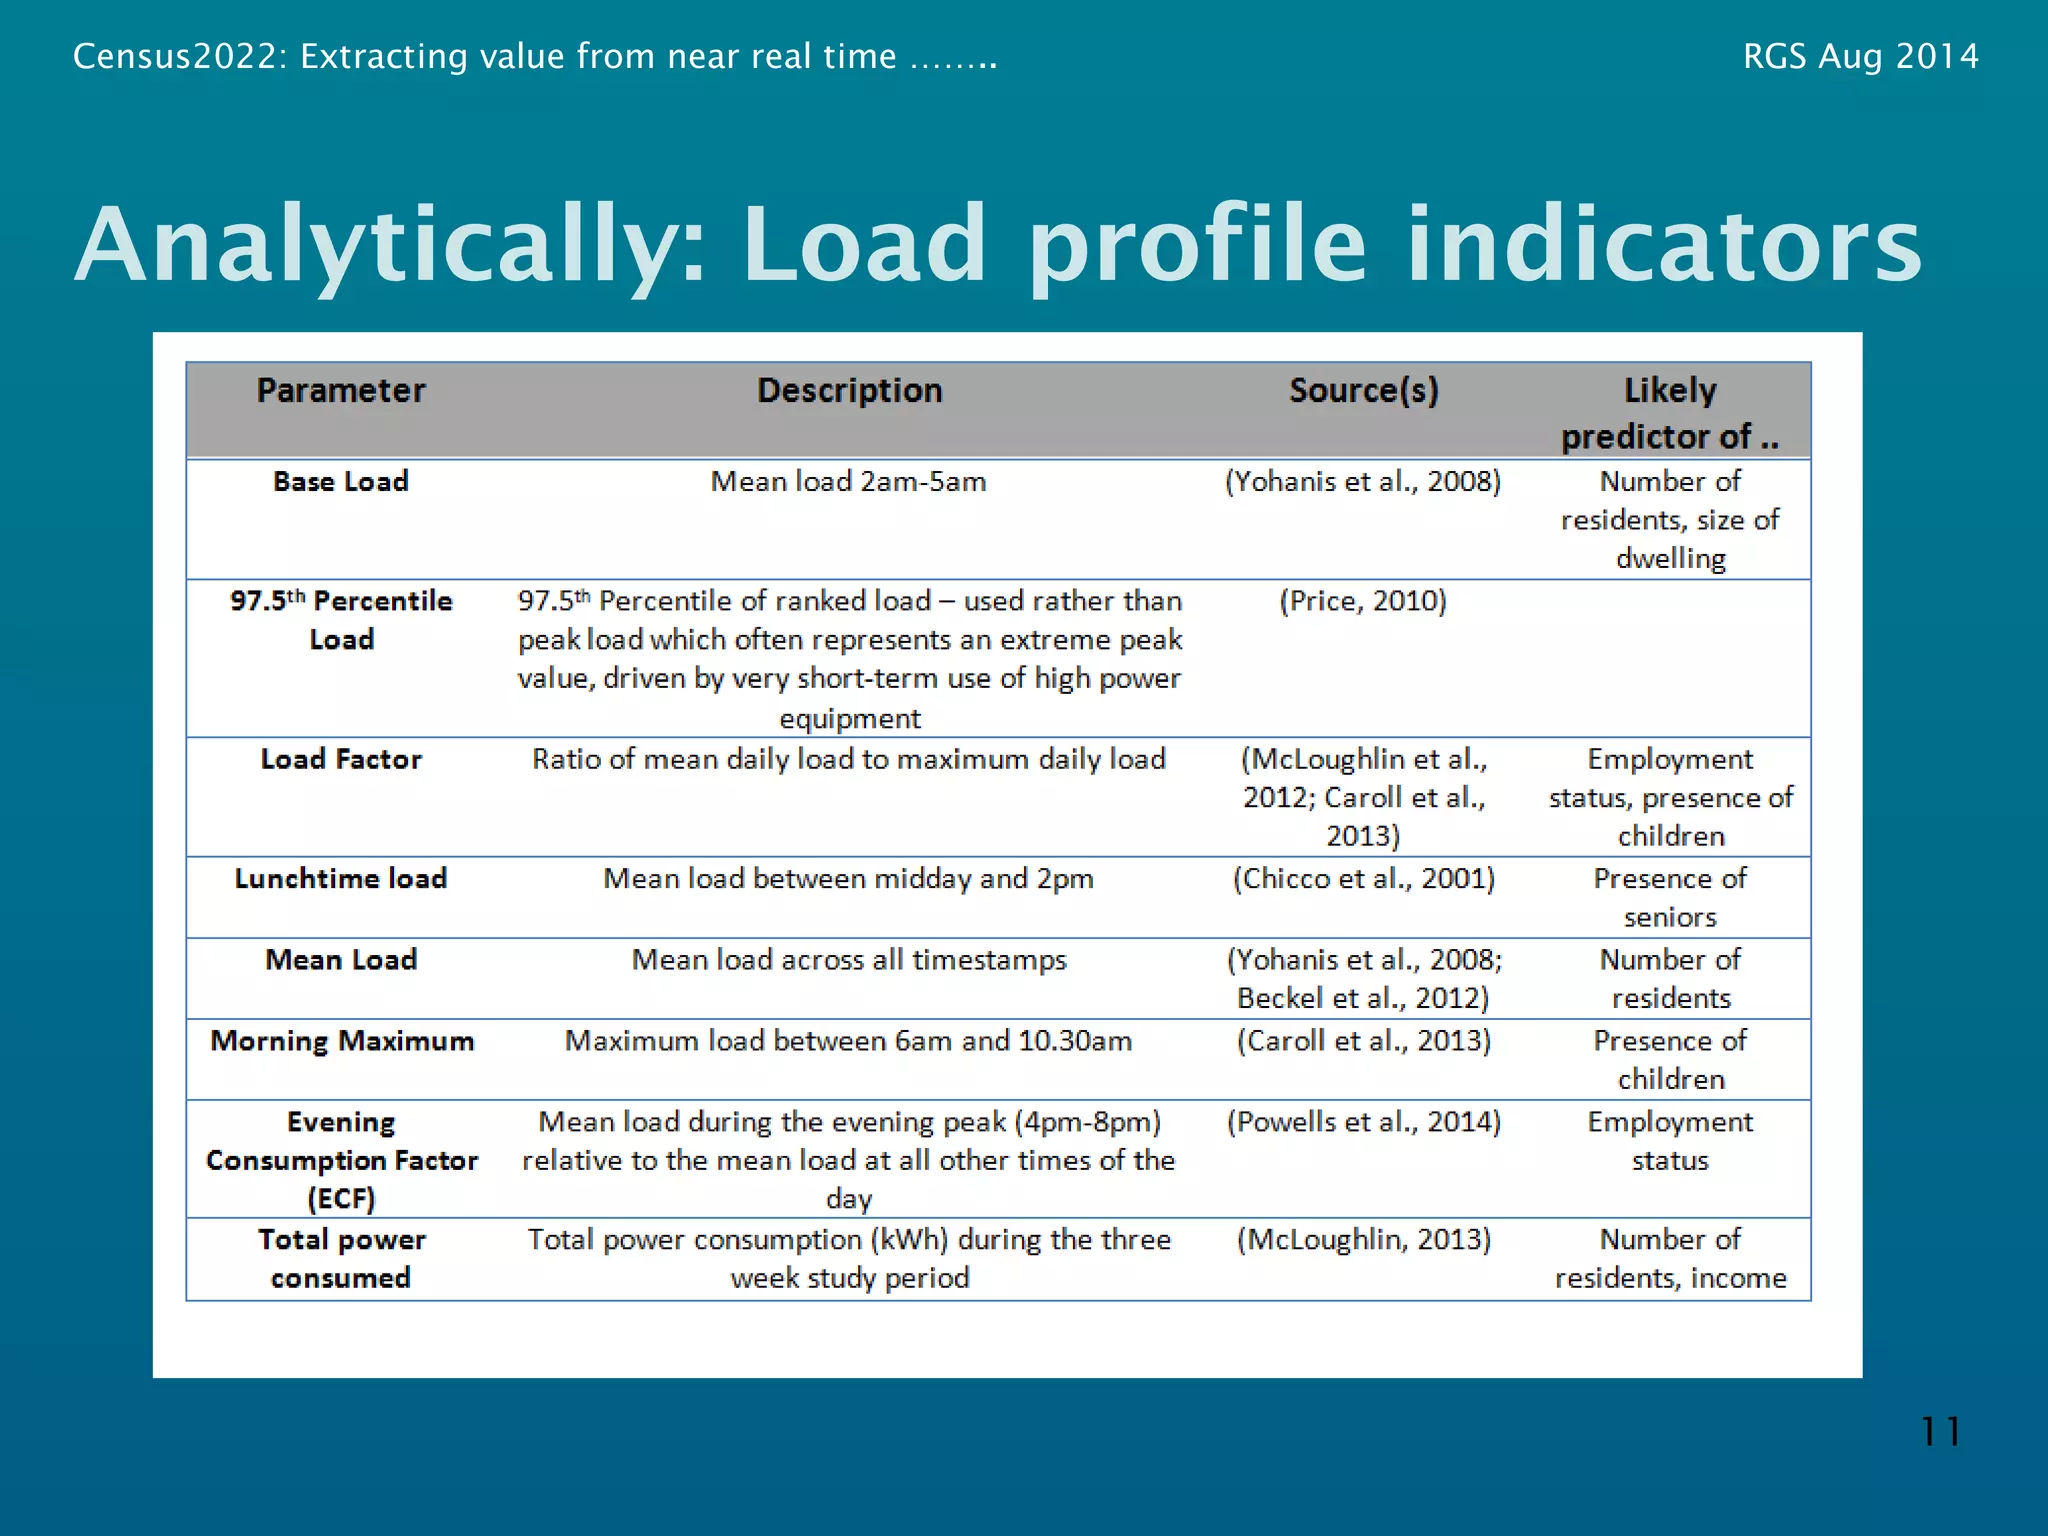
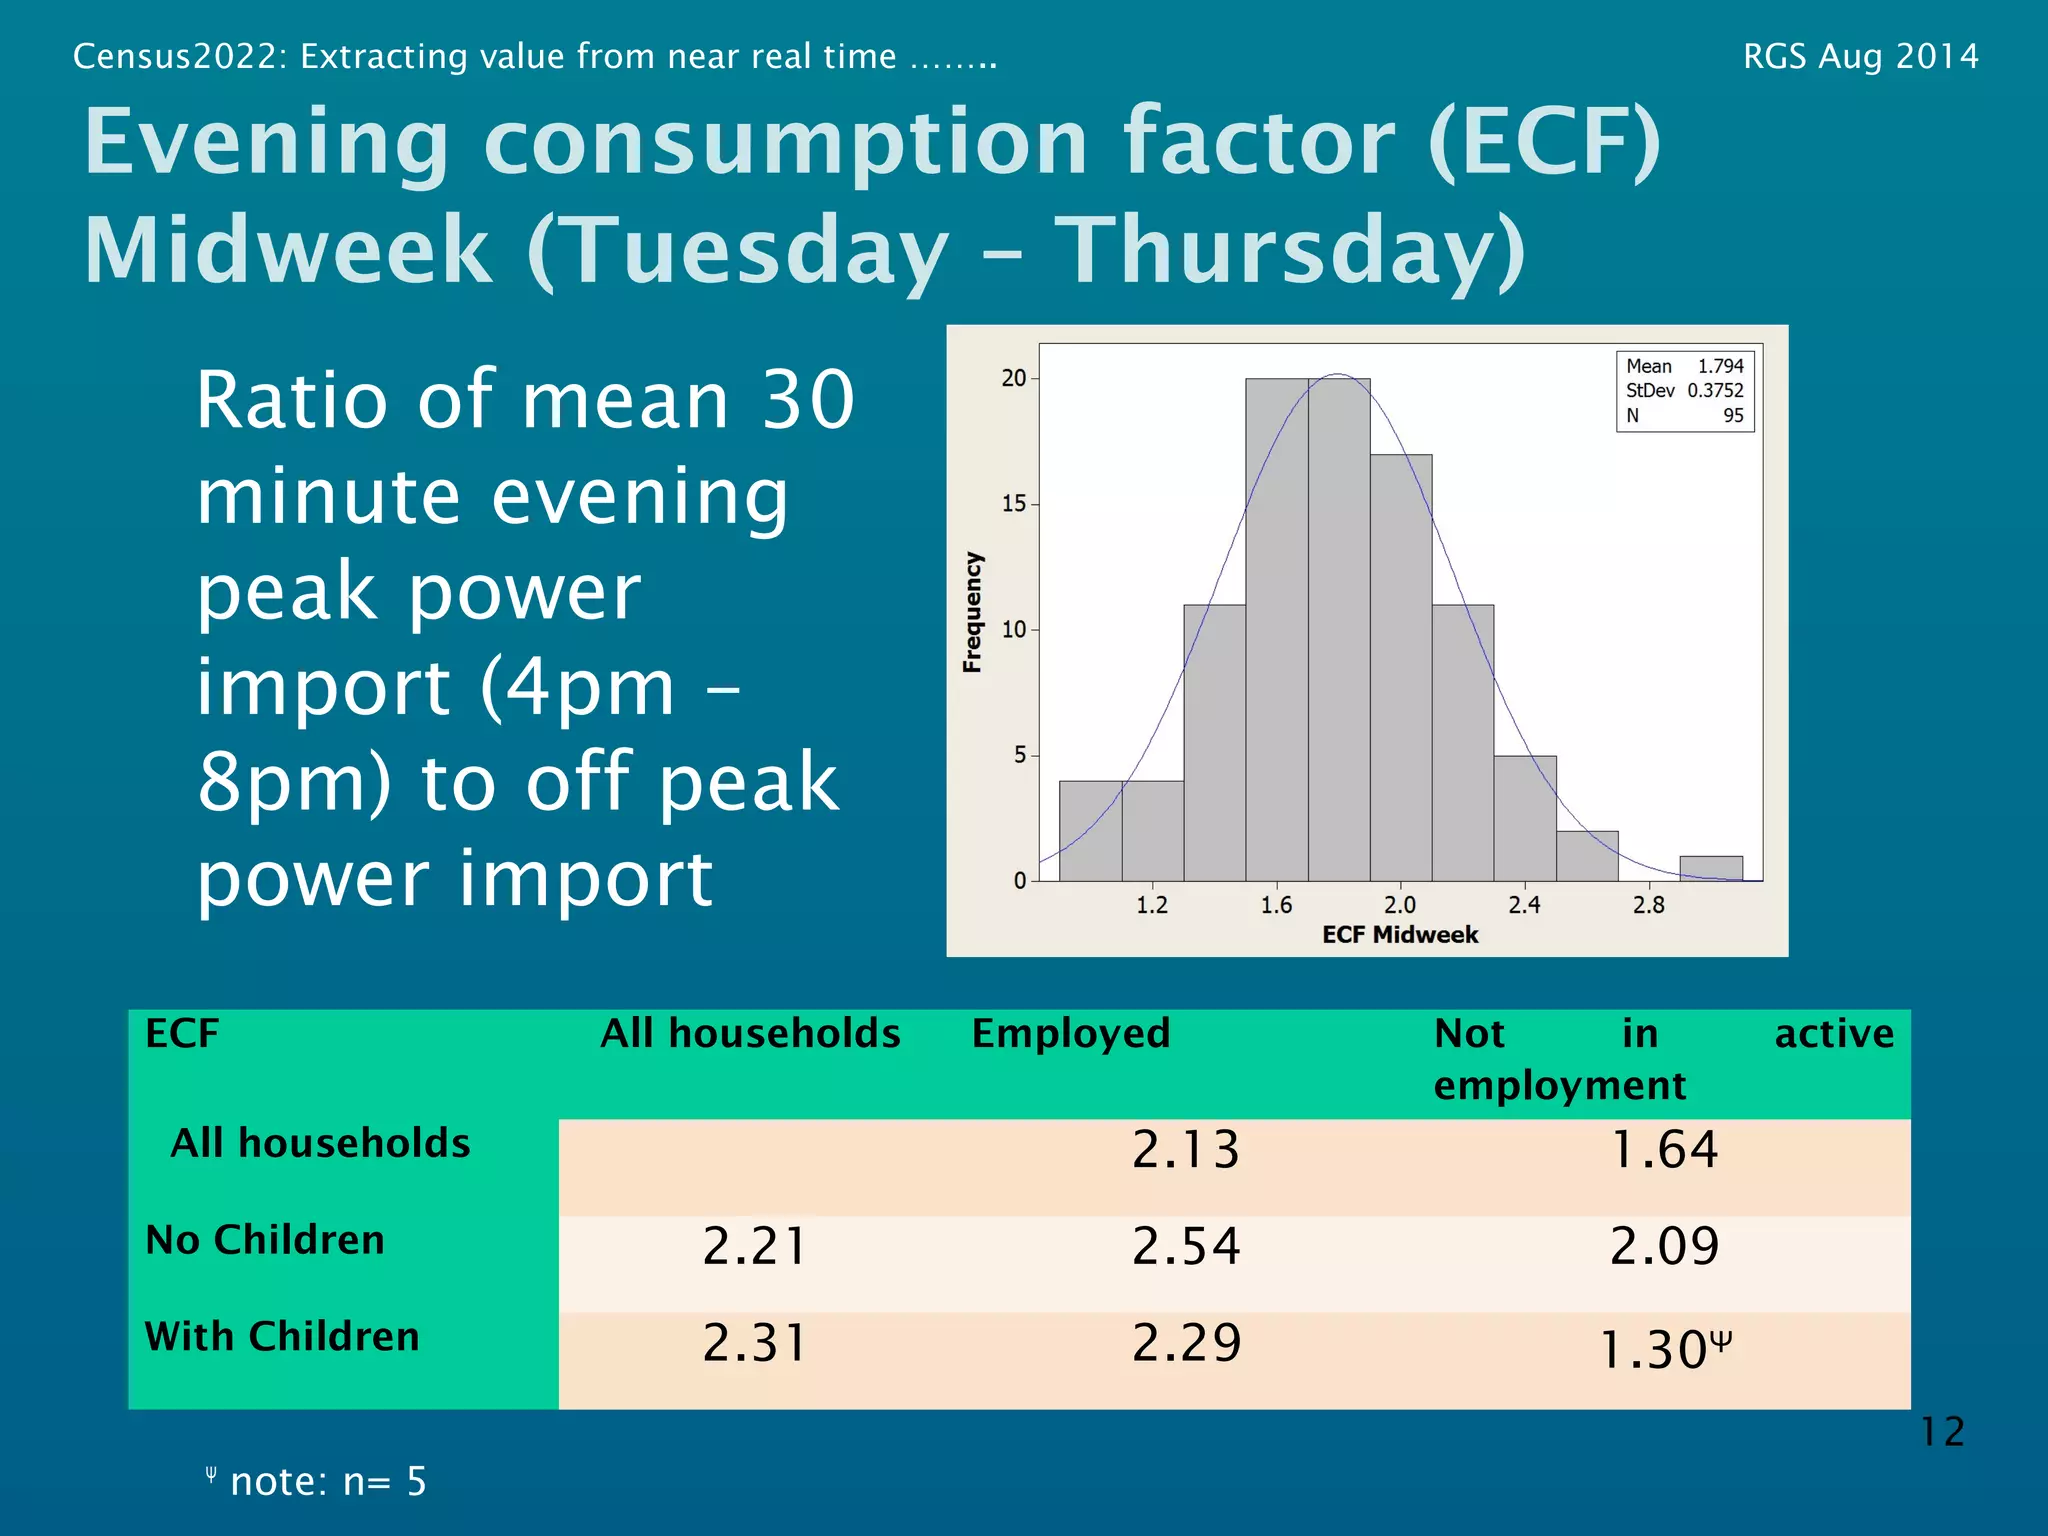
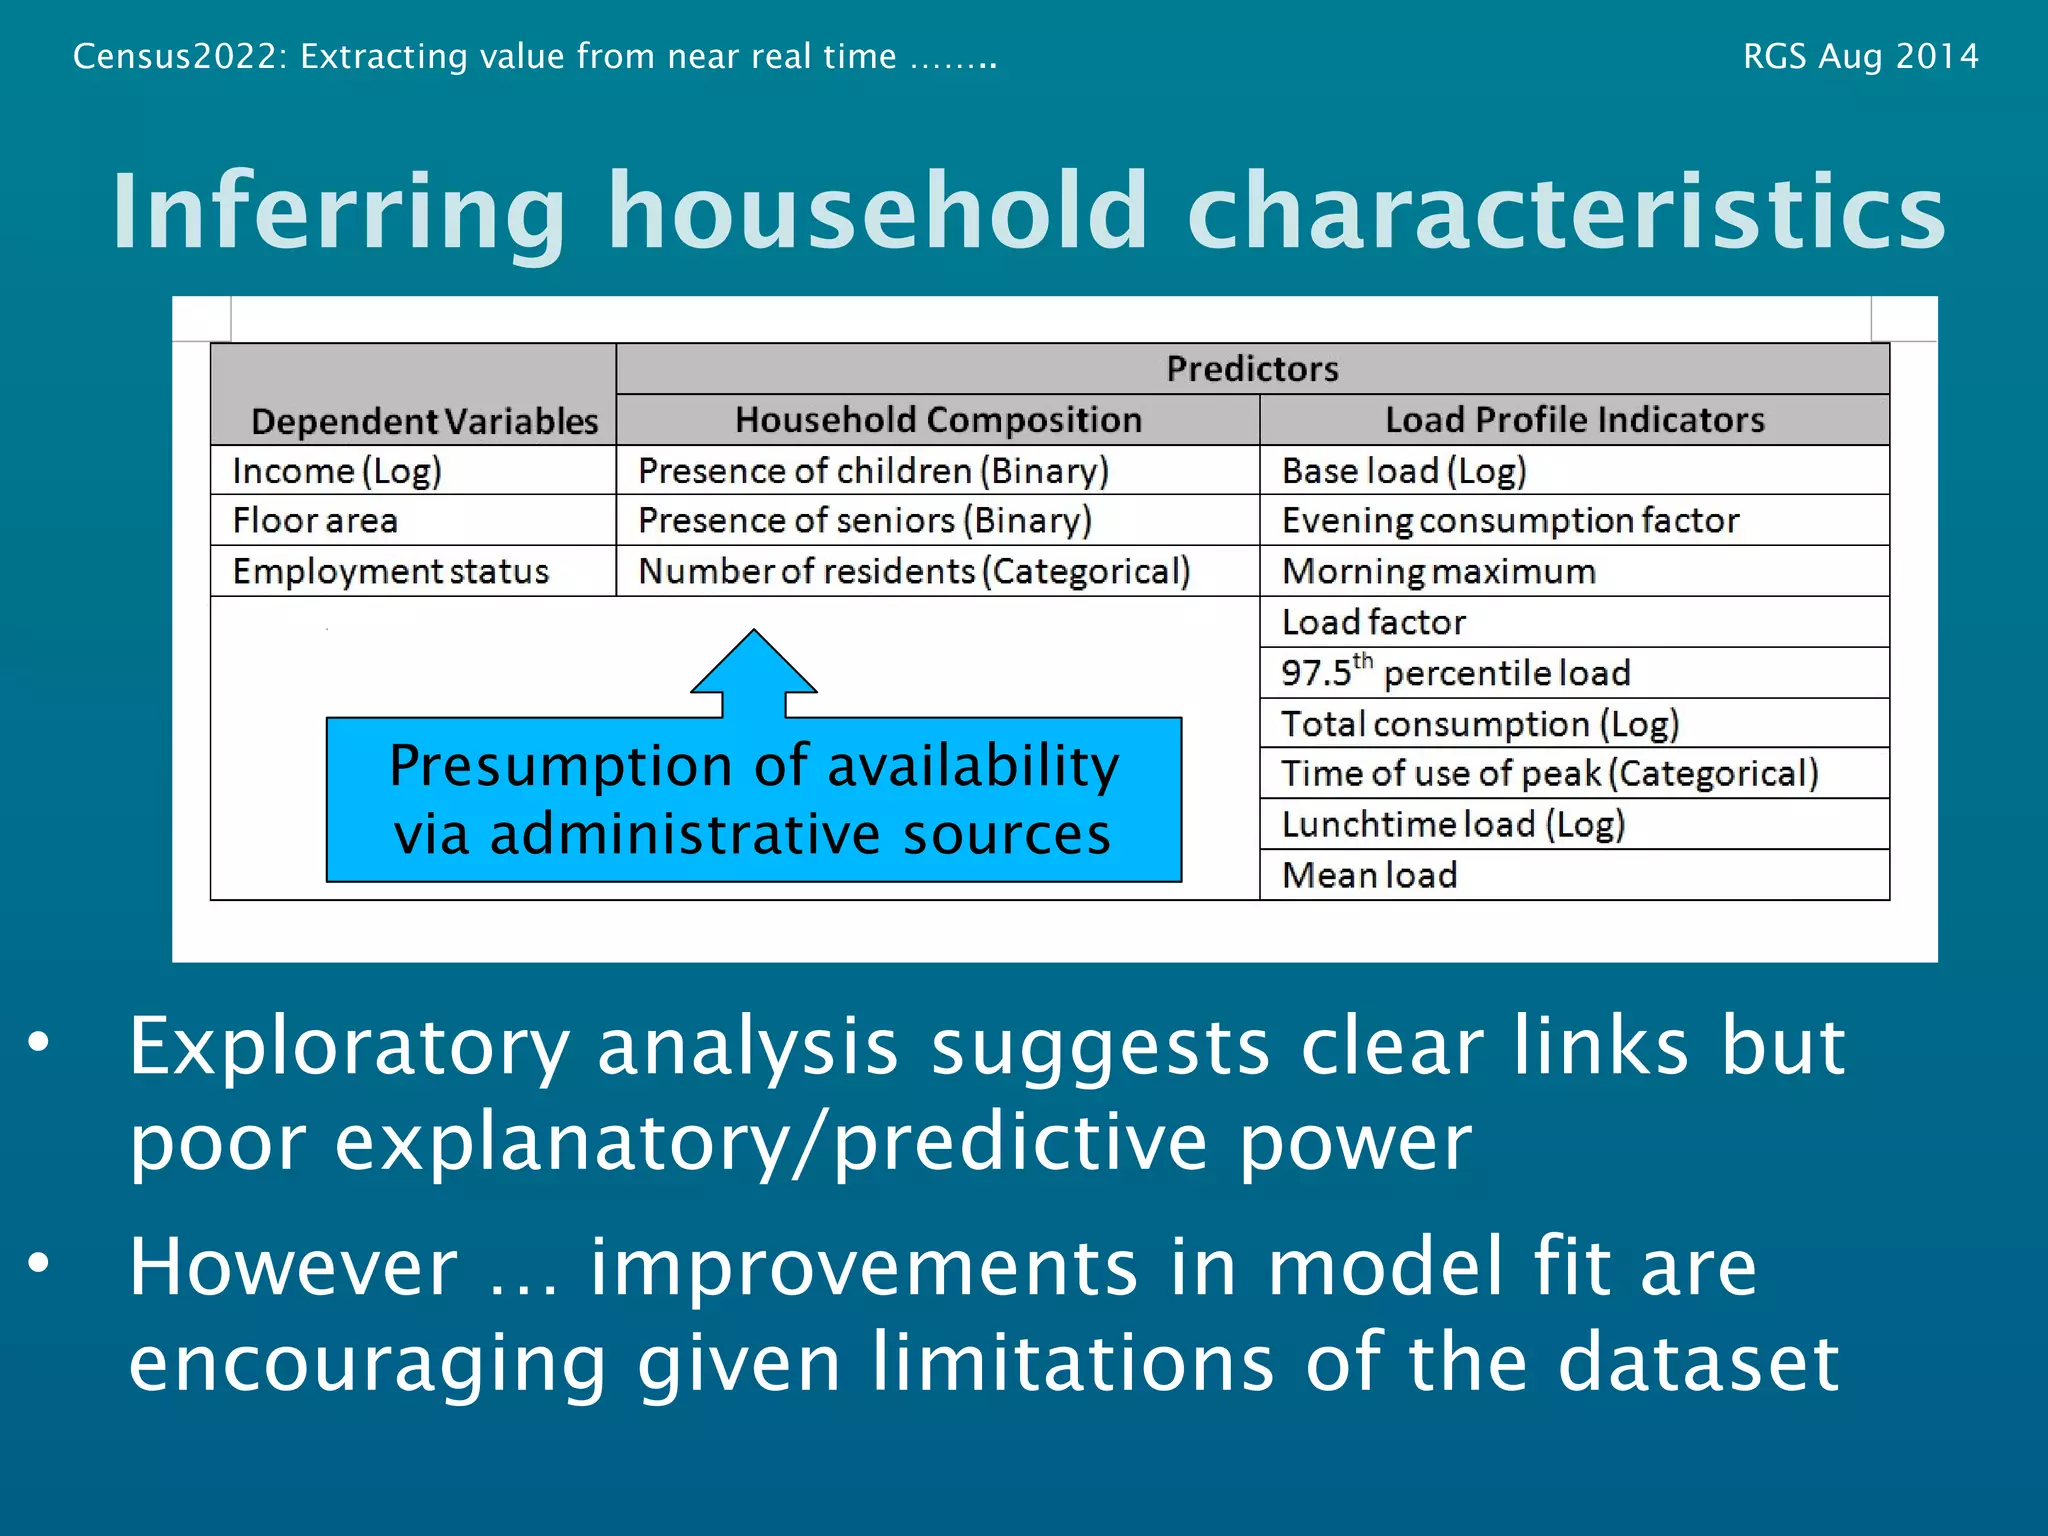
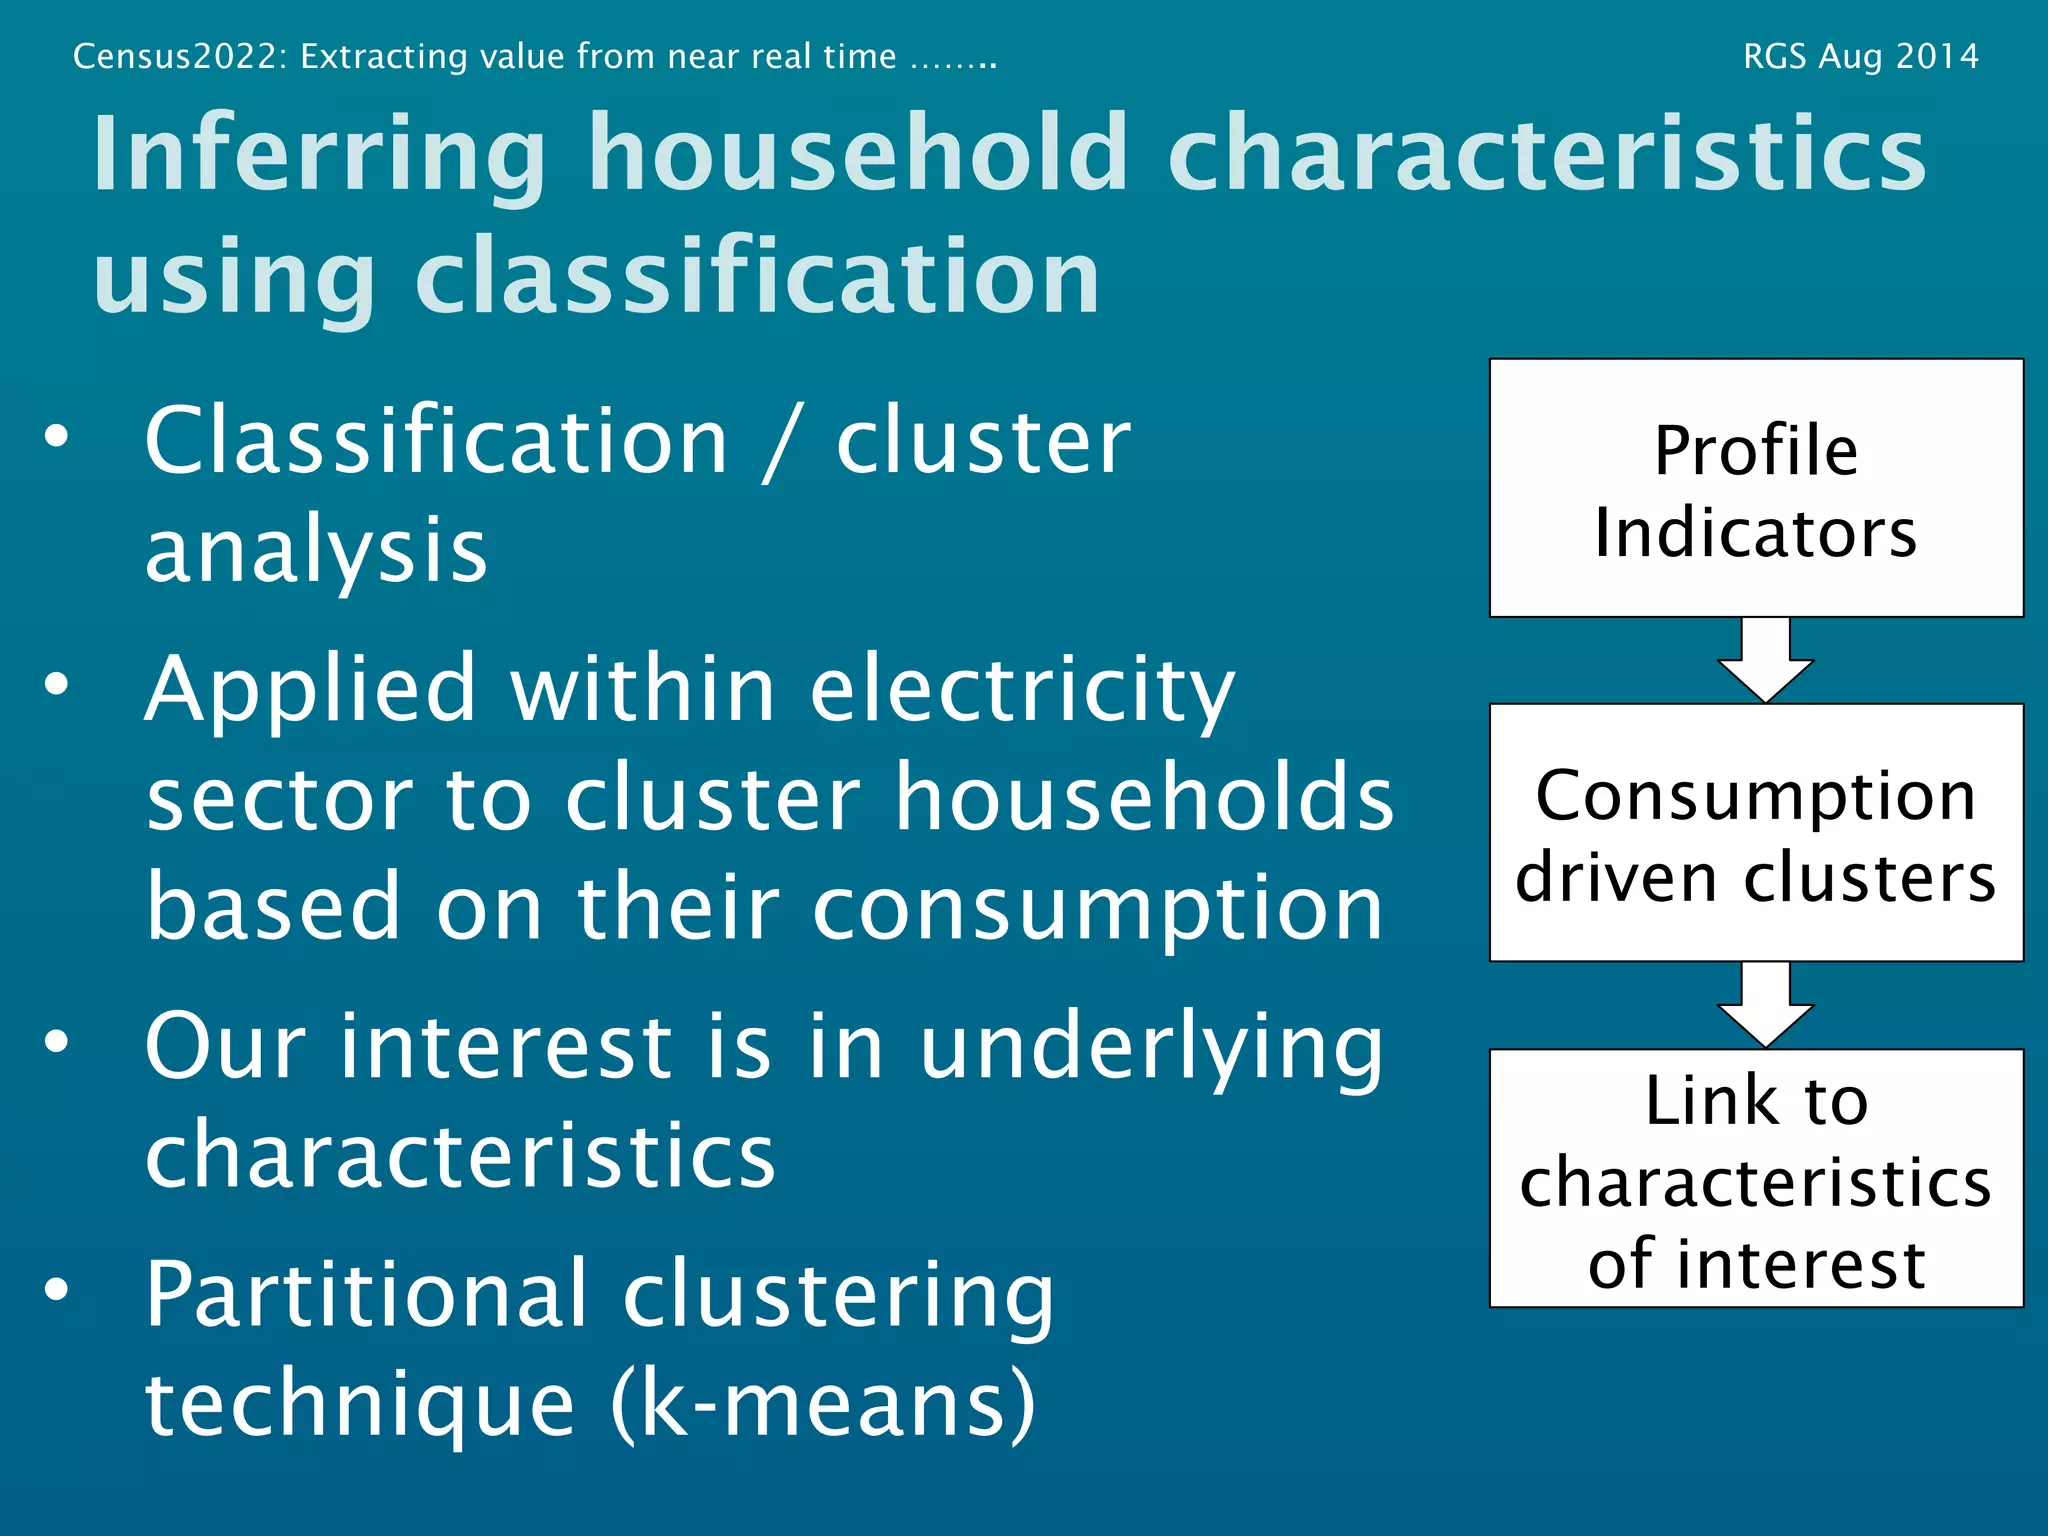
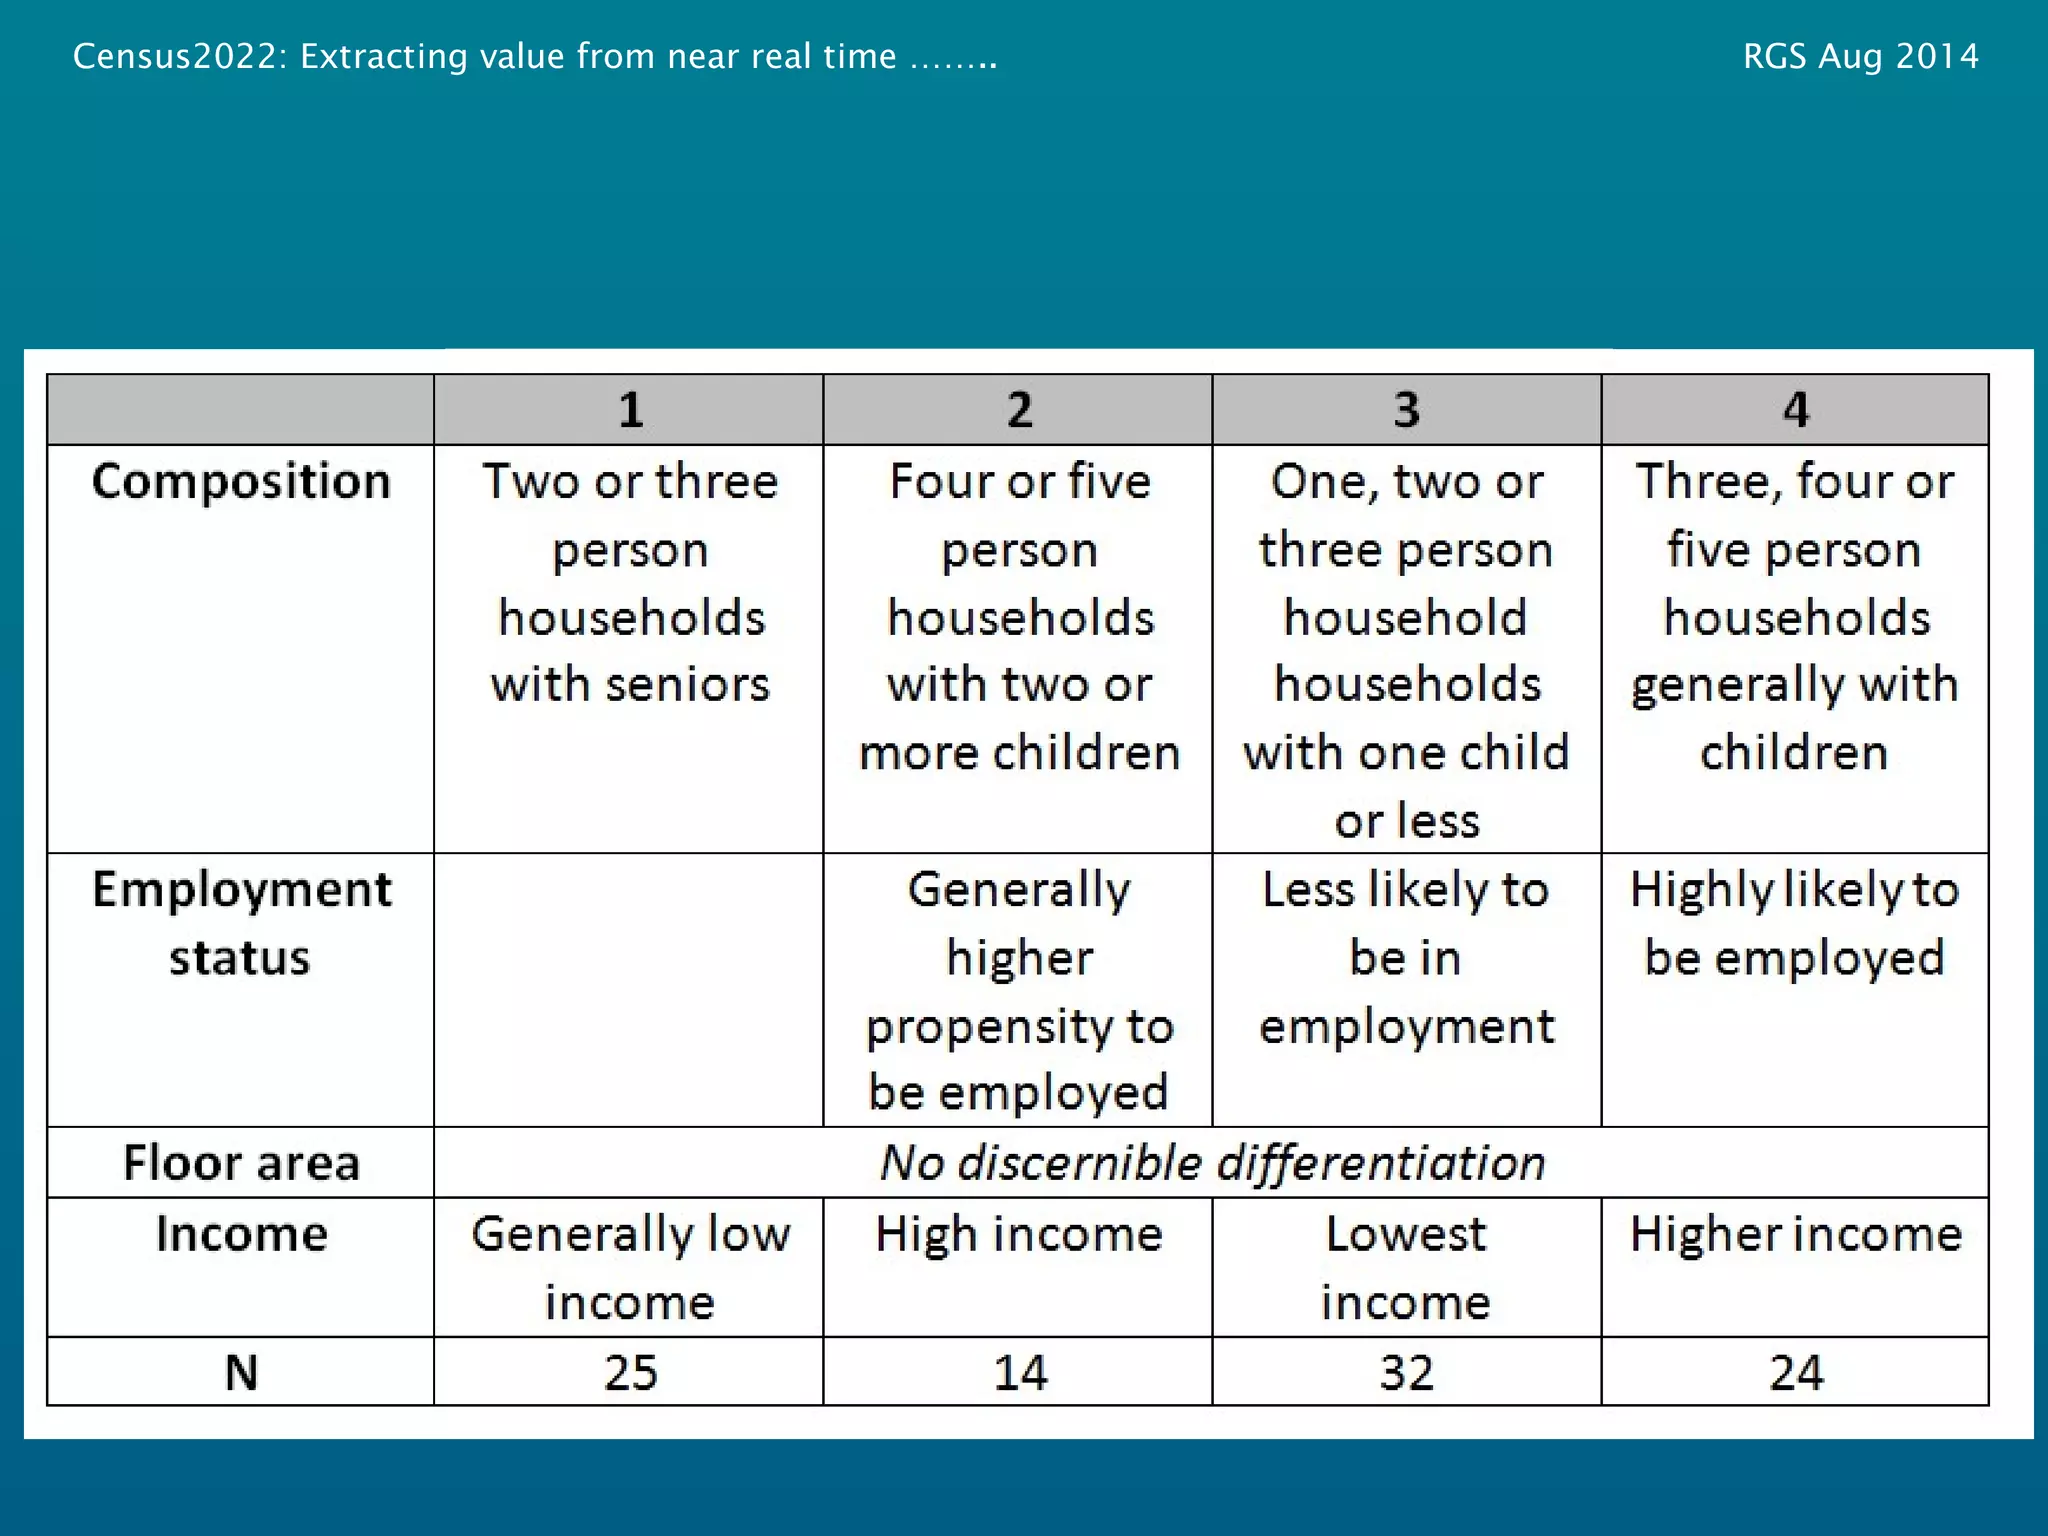
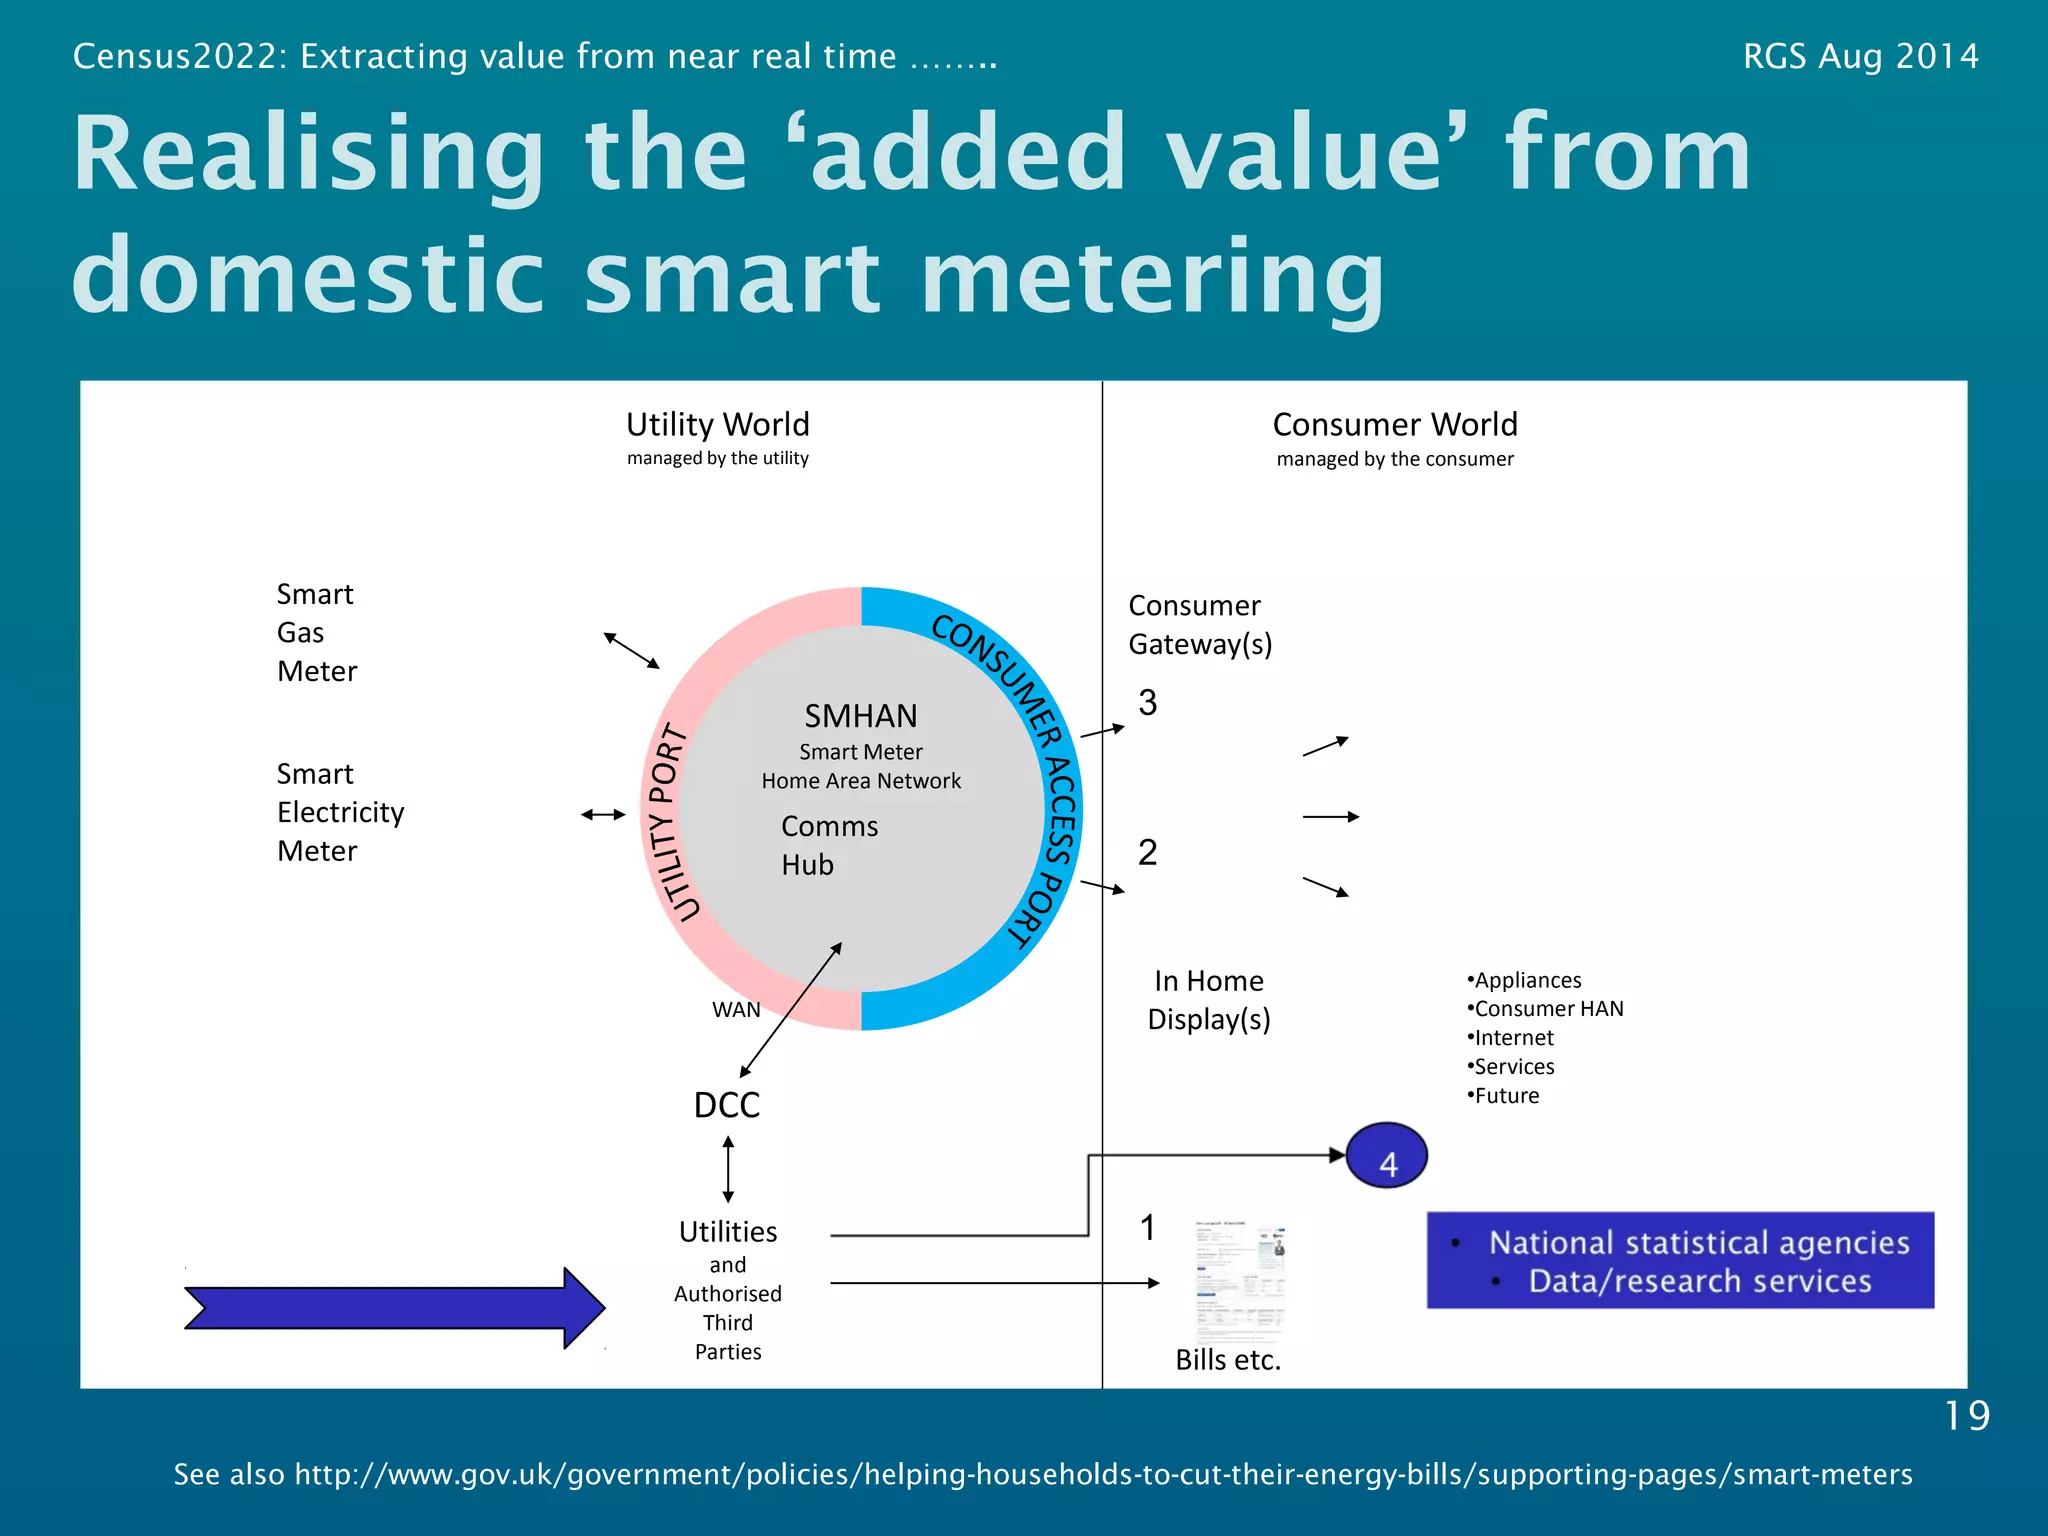
Census2022: Extracting value from domestic consumption data in a postcensus eraBen Anderson
Andy Newing a.newing@soton.ac.uk
Ben Anderson b.anderson@soton.ac.uk (@dataknut)
10 minute 'lightning' paper presented at BEHAVE 2014, Said Business School, Oxford, 4th September 2014.
VISUAL ANALYSIS OF ELECTRICITY DEMAND: ENERGY DASHBOARD GRAPHICS Graphical Da...Fatma ÇINAR
A real time interactive data management for Impulse and Response Analysis Technique using lattice and ggplot2 Graphical Packages embedded in R software has been employed. Average consumption, peak consumption and daily consumption data have been used while the temperature data is also employed to highlight the significance of relationship between consumption and the weather conditions. The demand for electricity by the factors affecting the demand with a multi-dimensional matrix graphics based on Energy Dashboard Software has been analysed leading to visualisation.
This guide is for Local Government Unit (LGU) readers. The topics contained here are meant to provide information on how Business Mapper products can be applied to your unit.
Real Time Interactive Data Management for the Effect and Response AnalysisTechnique; Lattice and ggplot2 Graphical Packages of R Software
Dataset: Financial Transactions of İzmir and Similar Cities of Turkey. (BRSA)*
Electricity consumption and household characteristics: Implications for censu...Ben Anderson
Presentation given at MRS Workshop "Can Big Data replace the Census? What does Big Data give us now?" , March 7, 2016, MRS, London (https://www.mrs.org.uk/event/conferences/can_big_data_replace_the_census/course/4088/id/10035)
An overview of the new ESRC Transformative research project given by Andy Newing to MRS Census and Geodemographic Group (CGG) hosted by GFK NOP, 19th November 2013 at Ludgate House, London
Join us for this ONS webinar with the Climate Change Coordination and Analysis team, in collaboration with the Integrated Data Service Dissemination team. It will showcase the latest version 2.0 of the UK Climate Change Statistics Portal, which launched on 27 October 2022.
This workshop was designed to inform local governments about the benefits and opportunities of private building energy benchmarking in small to medium-sized cities, and to answer questions and present tools to help communities take action.
The presentation of Bryan Buggey, Director (Strategic Initiatives&Sector Development) of Vancouver Economic Commission at the Green means Business - SmartClean Helsinki Metropolitan -event. It was hosted by the Directors of Economic Development of the cities Helsinki, Espoo and Vantaa and the Finnish Innovation Fund Sitra and held 1st of December 2015 at Sitra.
Kieran McQuinn delivered this presentation at an ESRI conference titled ‘Second annual conference on the Irish housing and mortgage market' on 13 November 2019.
There were two reports launched at the event.
This presentation contains key findings from a publication titled 'Assessing price sustainability in the Irish housing market: A county-level analysis’, which can be read here:
https://www.esri.ie/publications/assessing-price-sustainability-in-the-irish-housing-market-a-county-level-analysis
Photos from the conference are available to view on the ESRI website here:
https://www.esri.ie/events/save-the-date-esri-department-of-housing-conference-developments-in-the-irish-housing-and
Hunting for (energy) demanding practices using big & medium sized dataBen Anderson
Presentation given at 'Reshaping the Domestic Nexus: Analytical Insights and Methodologies', Manchester 23/11/2015 (see https://nexusathome.wordpress.com/2015/12/02/workshop-2-reshaping-the-domestic-nexus-manchester/)
Small Area Estimation as a tool for thinking about temporal and spatial varia...Ben Anderson
Anderson, B (2014) Small Area Estimation as a tool for thinking about temporal and spatial variation in energy demand. Paper presented at AURIN/NATSEM Microsimulation Workshop, University of Melbourne, Thursday 4th December 2014
The Time and Timing of UK Domestic Energy DEMANDBen Anderson
Anderson, B. (2014) The Time and Timing of UK Domestic Energy DEMAND. Keynote paper presented at the 2014 Otago Energy Research Centre Symposium, University of Otago, Dunedin, New Zealand, 28/11/2014.
PRACTICE HUNTING: Time Use Surveys for a quantification of practices distribu...Ben Anderson
Mathieu Durand-Daubin (EDF R&D-ECLEER)
Ben Anderson (Southampton University)
Paper presented at BEHAVE 2014, Said Business School, Oxford, 3rd September 2014
The Rhythms and Components of ‘Peak Energy’ DemandBen Anderson
Ben Anderson – University of Southampton (@dataknut)
Jacopo Torriti – University of Reading
Richard Hanna – University of Reading
Paper presented at BEHAVE 2014, Said Business School, Oxford, 3rd September 2014.
Tracking Social Practices with Big(ish) dataBen Anderson
Paper presented at 'Methodology' session of PRACTICES, THE BUILT ENVIRONMENT AND SUSTAINABILITY EARLY CAREER RESEARCHER NETWORK Workshop,
26-27 June 2014, Cambridge
Do ‘eco’ attitudes & behaviours explain the uptake of domestic energy product...Ben Anderson
"Do ‘eco’ attitudes & behaviours explain the uptake of domestic energy production technologies?"
Paper presented at "What Makes Us Act Green?", June 25 2014, London
Small Area Estimation as a tool for thinking about spatial variation in energ...Ben Anderson
Paper presented at "Spatial Variation in Energy Use, Attitudes and Behaviours: Implications for Smart Grids and Energy Demand", Policy Studies Institute, Friday, 7 February 2014, London, United Kingdom
The Distribution of Domestic Energy-Tech in Great Britain: 2008 – 2011Ben Anderson
Paper presented at 'What makes us act green?', Research & Policy Seminar, 17th December 2013, BIS Conference Centre, London. Uses @usociety survey data to analyse household uptake of solar PV and solar thermal in the UK 2008-2011
Patterns of Water: Thinking about diversity, demand and consumptionBen Anderson
Presentation on @ESRC funded water practices/demand research to @scotgov @GreenerScotland with @dralibrowne 4th December 2013, Scottish Government, Victoria Quay, Leith
Opendatabay - Open Data Marketplace.pptxOpendatabay
Opendatabay.com unlocks the power of data for everyone. Open Data Marketplace fosters a collaborative hub for data enthusiasts to explore, share, and contribute to a vast collection of datasets.
First ever open hub for data enthusiasts to collaborate and innovate. A platform to explore, share, and contribute to a vast collection of datasets. Through robust quality control and innovative technologies like blockchain verification, opendatabay ensures the authenticity and reliability of datasets, empowering users to make data-driven decisions with confidence. Leverage cutting-edge AI technologies to enhance the data exploration, analysis, and discovery experience.
From intelligent search and recommendations to automated data productisation and quotation, Opendatabay AI-driven features streamline the data workflow. Finding the data you need shouldn't be a complex. Opendatabay simplifies the data acquisition process with an intuitive interface and robust search tools. Effortlessly explore, discover, and access the data you need, allowing you to focus on extracting valuable insights. Opendatabay breaks new ground with a dedicated, AI-generated, synthetic datasets.
Leverage these privacy-preserving datasets for training and testing AI models without compromising sensitive information. Opendatabay prioritizes transparency by providing detailed metadata, provenance information, and usage guidelines for each dataset, ensuring users have a comprehensive understanding of the data they're working with. By leveraging a powerful combination of distributed ledger technology and rigorous third-party audits Opendatabay ensures the authenticity and reliability of every dataset. Security is at the core of Opendatabay. Marketplace implements stringent security measures, including encryption, access controls, and regular vulnerability assessments, to safeguard your data and protect your privacy.
Chatty Kathy - UNC Bootcamp Final Project Presentation - Final Version - 5.23...John Andrews
SlideShare Description for "Chatty Kathy - UNC Bootcamp Final Project Presentation"
Title: Chatty Kathy: Enhancing Physical Activity Among Older Adults
Description:
Discover how Chatty Kathy, an innovative project developed at the UNC Bootcamp, aims to tackle the challenge of low physical activity among older adults. Our AI-driven solution uses peer interaction to boost and sustain exercise levels, significantly improving health outcomes. This presentation covers our problem statement, the rationale behind Chatty Kathy, synthetic data and persona creation, model performance metrics, a visual demonstration of the project, and potential future developments. Join us for an insightful Q&A session to explore the potential of this groundbreaking project.
Project Team: Jay Requarth, Jana Avery, John Andrews, Dr. Dick Davis II, Nee Buntoum, Nam Yeongjin & Mat Nicholas
Show drafts
volume_up
Empowering the Data Analytics Ecosystem: A Laser Focus on Value
The data analytics ecosystem thrives when every component functions at its peak, unlocking the true potential of data. Here's a laser focus on key areas for an empowered ecosystem:
1. Democratize Access, Not Data:
Granular Access Controls: Provide users with self-service tools tailored to their specific needs, preventing data overload and misuse.
Data Catalogs: Implement robust data catalogs for easy discovery and understanding of available data sources.
2. Foster Collaboration with Clear Roles:
Data Mesh Architecture: Break down data silos by creating a distributed data ownership model with clear ownership and responsibilities.
Collaborative Workspaces: Utilize interactive platforms where data scientists, analysts, and domain experts can work seamlessly together.
3. Leverage Advanced Analytics Strategically:
AI-powered Automation: Automate repetitive tasks like data cleaning and feature engineering, freeing up data talent for higher-level analysis.
Right-Tool Selection: Strategically choose the most effective advanced analytics techniques (e.g., AI, ML) based on specific business problems.
4. Prioritize Data Quality with Automation:
Automated Data Validation: Implement automated data quality checks to identify and rectify errors at the source, minimizing downstream issues.
Data Lineage Tracking: Track the flow of data throughout the ecosystem, ensuring transparency and facilitating root cause analysis for errors.
5. Cultivate a Data-Driven Mindset:
Metrics-Driven Performance Management: Align KPIs and performance metrics with data-driven insights to ensure actionable decision making.
Data Storytelling Workshops: Equip stakeholders with the skills to translate complex data findings into compelling narratives that drive action.
Benefits of a Precise Ecosystem:
Sharpened Focus: Precise access and clear roles ensure everyone works with the most relevant data, maximizing efficiency.
Actionable Insights: Strategic analytics and automated quality checks lead to more reliable and actionable data insights.
Continuous Improvement: Data-driven performance management fosters a culture of learning and continuous improvement.
Sustainable Growth: Empowered by data, organizations can make informed decisions to drive sustainable growth and innovation.
By focusing on these precise actions, organizations can create an empowered data analytics ecosystem that delivers real value by driving data-driven decisions and maximizing the return on their data investment.
Explore our comprehensive data analysis project presentation on predicting product ad campaign performance. Learn how data-driven insights can optimize your marketing strategies and enhance campaign effectiveness. Perfect for professionals and students looking to understand the power of data analysis in advertising. for more details visit: https://bostoninstituteofanalytics.org/data-science-and-artificial-intelligence/
Levelwise PageRank with Loop-Based Dead End Handling Strategy : SHORT REPORT ...Subhajit Sahu
Abstract — Levelwise PageRank is an alternative method of PageRank computation which decomposes the input graph into a directed acyclic block-graph of strongly connected components, and processes them in topological order, one level at a time. This enables calculation for ranks in a distributed fashion without per-iteration communication, unlike the standard method where all vertices are processed in each iteration. It however comes with a precondition of the absence of dead ends in the input graph. Here, the native non-distributed performance of Levelwise PageRank was compared against Monolithic PageRank on a CPU as well as a GPU. To ensure a fair comparison, Monolithic PageRank was also performed on a graph where vertices were split by components. Results indicate that Levelwise PageRank is about as fast as Monolithic PageRank on the CPU, but quite a bit slower on the GPU. Slowdown on the GPU is likely caused by a large submission of small workloads, and expected to be non-issue when the computation is performed on massive graphs.
StarCompliance is a leading firm specializing in the recovery of stolen cryptocurrency. Our comprehensive services are designed to assist individuals and organizations in navigating the complex process of fraud reporting, investigation, and fund recovery. We combine cutting-edge technology with expert legal support to provide a robust solution for victims of crypto theft.
Our Services Include:
Reporting to Tracking Authorities:
We immediately notify all relevant centralized exchanges (CEX), decentralized exchanges (DEX), and wallet providers about the stolen cryptocurrency. This ensures that the stolen assets are flagged as scam transactions, making it impossible for the thief to use them.
Assistance with Filing Police Reports:
We guide you through the process of filing a valid police report. Our support team provides detailed instructions on which police department to contact and helps you complete the necessary paperwork within the critical 72-hour window.
Launching the Refund Process:
Our team of experienced lawyers can initiate lawsuits on your behalf and represent you in various jurisdictions around the world. They work diligently to recover your stolen funds and ensure that justice is served.
At StarCompliance, we understand the urgency and stress involved in dealing with cryptocurrency theft. Our dedicated team works quickly and efficiently to provide you with the support and expertise needed to recover your assets. Trust us to be your partner in navigating the complexities of the crypto world and safeguarding your investments.
As Europe's leading economic powerhouse and the fourth-largest hashtag#economy globally, Germany stands at the forefront of innovation and industrial might. Renowned for its precision engineering and high-tech sectors, Germany's economic structure is heavily supported by a robust service industry, accounting for approximately 68% of its GDP. This economic clout and strategic geopolitical stance position Germany as a focal point in the global cyber threat landscape.
In the face of escalating global tensions, particularly those emanating from geopolitical disputes with nations like hashtag#Russia and hashtag#China, hashtag#Germany has witnessed a significant uptick in targeted cyber operations. Our analysis indicates a marked increase in hashtag#cyberattack sophistication aimed at critical infrastructure and key industrial sectors. These attacks range from ransomware campaigns to hashtag#AdvancedPersistentThreats (hashtag#APTs), threatening national security and business integrity.
🔑 Key findings include:
🔍 Increased frequency and complexity of cyber threats.
🔍 Escalation of state-sponsored and criminally motivated cyber operations.
🔍 Active dark web exchanges of malicious tools and tactics.
Our comprehensive report delves into these challenges, using a blend of open-source and proprietary data collection techniques. By monitoring activity on critical networks and analyzing attack patterns, our team provides a detailed overview of the threats facing German entities.
This report aims to equip stakeholders across public and private sectors with the knowledge to enhance their defensive strategies, reduce exposure to cyber risks, and reinforce Germany's resilience against cyber threats.
Techniques to optimize the pagerank algorithm usually fall in two categories. One is to try reducing the work per iteration, and the other is to try reducing the number of iterations. These goals are often at odds with one another. Skipping computation on vertices which have already converged has the potential to save iteration time. Skipping in-identical vertices, with the same in-links, helps reduce duplicate computations and thus could help reduce iteration time. Road networks often have chains which can be short-circuited before pagerank computation to improve performance. Final ranks of chain nodes can be easily calculated. This could reduce both the iteration time, and the number of iterations. If a graph has no dangling nodes, pagerank of each strongly connected component can be computed in topological order. This could help reduce the iteration time, no. of iterations, and also enable multi-iteration concurrency in pagerank computation. The combination of all of the above methods is the STICD algorithm. [sticd] For dynamic graphs, unchanged components whose ranks are unaffected can be skipped altogether.
Developing insight from commercial data to support #Census2022
1. Developing insight from commercial
data to support #Census2022
BSPS Conference – September 2014
Andy Newing a.newing@soton.ac.uk
Ben Anderson b.anderson@soton.ac.uk (@dataknut)
Sustainable Energy Research Group
3. Census2022: Extracting value from near real time …….. RGS Aug 2014
What we are trying to do: Census2022
UK Census 2011/2021 evolution
Timeliness & cost
Challenges
Finding new ways to deliver the Census – ‘Census-like’
Opportunities
New kinds of data
New kinds of social indicators - ‘Census-plus’
More frequently
3
4. Census2022: Extracting value from near real time …….. RGS Aug 2014
Smart metering
• Universal mandate
• Quasi-real time
• High temporal resolution
• Geo-coded
• Reveals actual behaviors
• Near 100% coverage
4
5. Census2022: Extracting value from near real time …….. RGS Aug 2014
Smart metering
5
Smart
Gas
Meter
Smart
Electricity
Meter
WAN
DCC
Utilities
and
Authorised
Third
Parties
3
In Home
Display(s)
Utility World
managed by the utility
Consumer World
managed by the consumer
2
1
Bills etc.
SMHAN
Smart Meter
Home Area Network
Comms
Hub
Consumer
Gateway(s)
•Appliances
•Consumer HAN
•Internet
•Services
•Future
See also http://www.gov.uk/government/policies/helping-households-to-cut-their-energy-bills/supporting-pages/smart-meters
6. Census2022: Extracting value from near real time …….. RGS Aug 2014
Electricity Load profiles
• Household composition & characteristics
• Ownership and use of appliances
• Habits and routines
6
7. Census2022: Extracting value from near real time …….. RGS Aug 2014
Generating area based household
statistics and indicators
Household Load Profiles
Infer household characteristics
Aggregate to small area geographies
9. Census2022: Extracting value from near real time …….. RGS Aug 2014
UoS Energy Monitoring Study (UoS-E)
9
Smart meter-like household dataset
n=180
Repeated surveys:
characteristics, behaviors and attitudes
1 second level power import
Sample: October 2011
~ 500m records (1 second)
Cleaned & checked
Aggregated (mean power)
~ 250,000 records (half hourly)
10. Census2022: Extracting value from near real time …….. RGS Aug 2014
10
Descriptive Analysis
1-2 persons vs 3+ Midweek: No children vs 1-2 vs 3+
Midweek: Respondent in
employment vs not
12. Census2022: Extracting value from near real time …….. RGS Aug 2014
Evening consumption factor (ECF)
Midweek (Tuesday – Thursday)
Ratio of mean 30
minute evening
peak power
import (4pm –
8pm) to off peak
power import
Ψ note: n= 5
12
ECF All households Employed Not in active
employment
All households 2.13 1.64
No Children 2.21 2.54 2.09
With Children 2.31 2.29 1.30Ψ
14. Census2022: Extracting value from near real time …….. RGS Aug 2014
Inferring household characteristics
Presumption of availability
via administrative sources
• Exploratory analysis suggests clear links but
poor explanatory/predictive power
• However … improvements in model fit are
encouraging given limitations of the dataset
15. Census2022: Extracting value from near real time …….. RGS Aug 2014
Inferring household characteristics
using classification
• Classification / cluster
Profile
analysis
Indicators
• Applied within electricity
sector to cluster households
based on their consumption
• Our interest is in underlying
characteristics
• Partitional clustering
technique (k-means)
Consumption
driven clusters
Link to
characteristics
of interest
19. Census2022: Extracting value from near real time …….. RGS Aug 2014
Realising the ‘added value’ from
domestic smart metering
19
Smart
Gas
Meter
Smart
Electricity
Meter
WAN
DCC
Utilities
and
Authorised
Third
Parties
3
In Home
Display(s)
Utility World
managed by the utility
Consumer World
managed by the consumer
2
1
Bills etc.
SMHAN
Smart Meter
Home Area Network
Comms
Hub
Consumer
Gateway(s)
•Appliances
•Consumer HAN
•Internet
•Services
•Future
See also http://www.gov.uk/government/policies/helping-households-to-cut-their-energy-bills/supporting-pages/smart-meters
20. Census2022: Extracting value from near real time …….. RGS Aug 2014
Thank you
http://www.energy.soton.ac.uk/tag/census2022/
Ben Anderson b.anderson@soton.ac.uk (@dataknut)
Andy Newing a.newing@soton.ac.uk
20
Editor's Notes
Be very clear here that the DCC will be a ‘gateway’ rather than a warehouse.
Re-enforce the point that discussions between the likes of ONS and other Govt. Depts. to ensure appropriate data access.