Census 2000 showed
that the United States
population was 281.4
million on April 1,
2000. Of the total, 4.1
million, or 1.5 percent,
reported1 American
Indian and Alaska
Native. This number
included 2.5 million
people, or 0.9 percent,
who reported only
American Indian and
Alaska Native in addi-
tion to 1.6 million peo-
ple, or 0.6 percent,
who reported American
Indian and Alaska
Native as well as one
or more other races.
The term American
Indian is often used in the text of this
report to refer to the American Indian and
Alaska Native population, while American
Indian and Alaska Native is used in the
text tables and graphs. Census 2000
asked separate questions on race and
Hispanic or Latino origin. Hispanics who
reported their race as American Indian
and Alaska Native, either alone or in com-
bination with one or more races, are
included in the number of American
Indians.
This report, part of a series that analyzes
population and housing data collected
from Census 2000, provides a portrait of
the American Indian population in the
United States and discusses its distribution
at both the national and subnational levels.
It begins by discussing the characteristics
of the total American Indian population and
then focuses on selected tribal groupings,2
for example, Navajo, Cherokee, or Eskimo.
The report is based on data from the
Census 2000 Summary File 1.3 The text of
this report discusses data for the United
States, including the 50 states and the
District of Columbia.4
U S C E N S U S B U R E A U
Helping You Make Informed Decisions
U.S. Department of Commerce
Economics and Statistics Administration
U.S. CENSUS BUREAU
Issued February 2002
C2KBR/01-15
The American Indian and Alaska
Native Population: 2000
Census 2000 Brief
By
Stella U. OgunwoleFigure 1.
Reproduction of the Question on Race
From Census 2000
Source: U.S. Census Bureau, Census 2000 questionnaire.
What is this person's race? Mark one or more races to
indicate what this person considers himself/herself to be.
6.
White
Black, African Am., or Negro
American Indian or Alaska Native — Print name of enrolled or principal tribe.
Some other race — Print race.
Japanese
Korean
Vietnamese
Native Hawaiian
Guamanian or Chamorro
Samoan
Other Pacific Islander — Print race.
Asian Indian
Chinese
Filipino
Other Asian — Print race.
✗
1 In this report, the term “reported” is used to refer
to the answers provided by respondents, as well as
responses assigned during the editing and imputation
processes.
2 Tribal grouping refers to the combining of individ-
ual American Indian tribes, such as Alamo Navajo,
Tohajiileehee Navajo, and Ramah Navajo into the general
Navajo tribe, or the combining of individual Alaska
Native tribes such as American Eskimo, Eskimo and
Greenland Eskimo into the general Eskimo tribe.
3 Data from the Census 2000 Summary File 1 were
released on a state-by-state basis during the summer of
2001.
4 Data for the Commonwealth of Puerto Rico are
shown in Table 2 ...
Census 2000 showedthat the United Statespopulation on Apri.docxcravennichole326
Census 2000 showed
that the United States
population on April 1,
2000 was 281.4 mil-
lion. Of the total,
36.4 million, or
12.9 percent, reported1
Black or African
American. This number
includes 34.7 million
people, or 12.3 percent,
who reported only Black
in addition to 1.8 mil-
lion people, or 0.6 per-
cent, who reported
Black as well as one or
more other races. The
term Black is used in
the text of this report to
refer to the Black or
African American popu-
lation, while Black or
African American is used in the text tables
and graphs. Census 2000 asked separate
questions on race and Hispanic or Latino
origin. Hispanics who reported their race
as Black, either alone or in combination
with one or more other races, are includ-
ed in the numbers for Blacks.
This report, part of a series that analyzes
population and housing data collected
from Census 2000, provides a portrait of
the Black population in the United States
and discusses its distribution at both the
national and subnational levels. It is based
on the Census 2000 Redistricting Data
(Public Law 94-171) Summary File, which
was among the first Census 2000 data
products to be released and is used by
each state to draw boundaries for legisla-
tive districts.2
The term “Black or African American”
refers to people having origins in any of
the Black race groups of Africa. It includes
people who reported “Black, African Am.,
or Negro” or wrote in entries such as
African American, Afro American,
Nigerian, or Haitian.
Data on race has been collected since the
first U.S. decennial census in 1790.
U S C E N S U S B U R E A U
Helping You Make Informed Decisions
U.S. Department of Commerce
Economics and Statistics Administration
U.S. CENSUS BUREAU
Issued August 2001
C2KBR/01-5
The Black Population: 2000
Census 2000 Brief
By
Jesse McKinnonFigure 1.
Reproduction of the Question on Race
From Census 2000
Source: U.S. Census Bureau, Census 2000 questionnaire.
What is this person's race? Mark one or more races to
indicate what this person considers himself/herself to be.
6.
White
Black, African Am., or Negro
American Indian or Alaska Native — Print name of enrolled or principal tribe.
Some other race — Print race.
Japanese
Korean
Vietnamese
Native Hawaiian
Guamanian or Chamorro
Samoan
Other Pacific Islander — Print race.
Asian Indian
Chinese
Filipino
Other Asian — Print race.
✗
1 In this report, the term “reported” is used to refer
to the answers provided by respondents, as well as
responses assigned during the editing and imputation
processes.
2 This report discusses data for 50 states and the
District of Columbia, but not Puerto Rico. The Census
2000 Redistricting Data (Public Law 94-171) Summary
File was released on a state-by-state basis in March
2001.
2 U.S. Census Bureau
Blacks have been enumerated in
every census.
The question on race was
changed for Census 2000.
For Census 2000, the question on
race was asked of every individual
living in the United States ...
Perform an academic search and locate articles from peer-reviewed j.docxJUST36
*Perform an academic search and locate articles from peer-reviewed journals that discuss a health disparity found in the Asian American and Native American communities. Discuss your findings and the impact APNs can make to eliminate these disparities.
Make 2 post one for Asian Americans and the other for Native American communities. Both responses should be a minimum of 200 words each one , scholarly written, APA formatted, and referenced. A minimum of 2 references are required (other than your text).
Introduction
According to the 2010 US census, the Asian American/Pacific Islander (AAPI) community is made up of about 18.2 million people or 3.6% of the population of the U. S. there are five major Asian populations in the US: Chinese, Korean, Japanese, Filipino and Southeast Asian. The AAPIs have origins in at least 29 Asian countries and 20 Pacific Islander countries. There are as many languages, cultures and religions found in this population. More than 100 different languages spoken and just as many cultures and religions found in this population. The largest group of Asians is Chinese followed by Filipinos. Many Asians came to the U. S. seeking both a better life and employment.
Although Asian groups are very diverse in terms of culture, language, etiquette and rules for interaction, a common thread of Confucian, Buddhist and Taoist thought links their health care beliefs and practices and are derived from Chinese tradition. When planning for or providing care to the Pacific Islanders, the APN should utilize a Chinese frame of reference because less is known about this group.
The term Native American refers to the indigenous people of North, South, and Central American and includes American Indians and Alaska Natives (AI/AN) (Kosoko-Laski et al, 2009). About 5.2 million people identify as being American Indian or Alaska natives. This American Indian population is confined to 26 states in the US with most in the western part of the country. The largest AI populations by tribes are Cherokee, Navajo, Choctaw, Mexican American Indian, Chippewa, Sioux, Apache, Blackfeet, Cree, and Iroquois. The largest AN population are Yup’ik, Inupiat, Tlingit-Haida, Alaskan Athabascan, and Aleut and Tsimshian.
This population is highly diverse with 573 federally recognized tribes and several others not federally recognized. Federally recognized tribes are provided health and education assistance from the Indian Health Service, US Department of Health and Human Services. Depending on their geographical location, cultural practices, and language, life situations differ considerably.
Learning objectives for the module
:
At the end of this module, the student will be able to:
Discuss health and illness behaviors of Asians/Pacific Islanders
Identify current healthcare problems of Asians/Pacific Islanders
Describe cultural barriers to health care for the Native American
Discuss health disparities of the Native American population
Reading.
Write a 625- to 850-word analysis. The LatinoHispanic group is thvickeylintern
Write
a 625- to 850-word analysis. The Latino/Hispanic group is the only ethnic category counted separately by the United States Census. According to the U.S. Census, a Latino/Hispanic person can be of any race.
Describe
the variability within the larger "Latin American" group, as defined by the U.S. Census, including the racial differences.
Include
in the post:
When this census category became official (the first time it was used in the United States Census)
At least five distinctive subgroups that belong under this broad category
How people from Africa, both slaves and freemen, became part of the Latino population in Mexico, Central and South America, and the U.S.
How Africans in Mexico, Central and South America were absorbed into the Hispanic population, while generally being kept separate in the U.S.
How colorism affects membership within the Hispanic/Latino group today (i.e. a Mexican who is Black)
The role of language
The role of religion
The role of culture
...
TitleABC123 Version X1Racial Diversity Historical Wo.docxedwardmarivel
Title
ABC/123 Version X
1
Racial Diversity: Historical Worksheet
ETH/125 Version 8
2
Associate Program MaterialIRacial Diversity: Historical Worksheet
PART I: Answer the following questions in 100 to 250 words each. The answers should include research from University Library, course materials and quality sources. This is evidenced by summary, paraphrasing and/or quoting of sourced information to support points within the answer. Provide APA formatted cites and their associated references for all the sources you use.
1. Throughout most of U.S. history, in most locations, what race has been in the majority? What is the common ancestral background of most members of this group?
In most locations, the white race has been the majority (Schaefer, 2012), although this fact is not solely based upon how many of them are population. The white race came to the U.S. from varios parts of Europe (their common ancestral background), and have successfully made themselves the majority, by founding the country on what benefited them the most. This is how the white race became the majority.
2. What are some of the larger racial minorities in U.S. history? What have been the common ancestral backgrounds of each of these groups? When did each become a significant or notable minority group?
Some of the larger racial minorities in U.S. history would be African Americans, Native Americans. Native Americans who were first to be in North America. In 1871 the Federal Government declared them American Indians and were forced to move to reservations. This is where they were forced to adapt to Christianity instead of their own religion, schools that were done in English. African Americans were the other larger racial minorities. African Americans arrived with the first European explorers from Africa. Shortly after they arrived they became slaves due to their color in 1776. In 1865 Congress abolished slavery everywhere.
3. In what ways have laws been used to enforce discrimination? Provide examples. These laws were intended against which racial minorities?
4. In what ways have laws been used to eliminate discrimination? Provide examples. Did the laws work to eliminate discrimination?
Laws have been used to attempt to eliminate discrimination for many years. Some of these laws mak3s it illegal to refuse housing to people ased on their race or sex. Many of these laws prohibit not only discrimination based on race, but gender, age, religious affiliation, and other factors. Affirmative action of the courts and prison sysems which distrimiantes against Blacks, and hispancis and give them 20% longer sentences (Schaefer, 2012) is a great example of a laws that eliminated discrimination. Although discrimination still exists, the laws have helped to create equality among the different races.
PART 2: Identify one racial group from the list below and answer the questions (under the list from the perspective of the racial group selected). Search the Internet for groups ...
(£7 INVENTING HISPANICS A DIVERSE MINORITY RESISTS BEI.docxmercysuttle
\(£7
INVENTING HISPANICS: A DIVERSE MINORITY
RESISTS BEING LABELED
Amitai Etzioni
GOALS
To illustrate the complexity of Hisp a nic cultural identity in the United States
To present so me of the economi c and political issues that affect America's largest "minor
ity" group
Thirt y yea rs ago immig rant s fro m Latin America who seltled in the United States were perceived
in ter m s of their home nation-as, for example. Cuba n America ns or Mexican America ns, just as
European newcomers were seen as Itali a n America ns or Poli sh Americans. Today the immigrant
fl ow from Central a nd South America has grown substanti J l1 y. and the newcomers are known as
Hispa nics.
Some observers have exp ressed co ncern that efforts to make Hi spa nics a single minority
group-for purpo ses rang ing from el ec tions to education to the allocatio n of public funds-are
furth e r dividing America n society along racial lines . But attempts. both incide ntal and ideologi
cal, to fo rge these American immigran ts into a st ro ngl y d efin ed minority are encountering an
un anti cipated prob lem. Hi spanics by and large do not see th emselves as a di sti nct minority
grou p; they do see themselves as America ns.
HISPANICS AND AFRICAN AMERICANS
Hispan ics are p articularly important for understanding the future of diversity in American soci
~ty. ~lrea~y th ey have overtaken African Americans to beco m e the nati on's largest minority. and
Immig ra tIOn patte rns en sure that the number of H ispanics will continue to grow more rapidl y
than th a t of Africa n America n s.
U.S. race relations h ave long b een understood in term s of black and white. Until recently.
many books on th e subject did not even m e nti o n other races, or did so o nly as a brief after
thought. No w recognition is g row ing t ha t Hi spa nics a re replac ing blacks as the primary minorit y.
But whereas blacks have long been r aising their p o litical con sciousness, Hispanics have only just
begun to find th eir political legs.
. Recent inc reases in minority populations and a d ecline in the white majority in the
UOited States h ave driven seve ral African- America n leaders. including Jesse Jackson a nd form er
From Brookings Review \Vinter 200 2 10-11 C . .'~.J
R . db '" . ' pp. opy rl g ht 2002 by the IlW{Il..lllgS InstItution Pres... All nghts reserVl"U.
epnnle y permi SS ion. Reprinted with pcrmis~iOI1 from th e 8rookm~s In ..titutc.
90
91 Inventing 11i spanics: A Diverse Minority Resists Being Labeled
New York City Mayor David Dinkins, along with a few Hispanics, such as Fernando Ferrer, a
candidate for the 2002 mayoral election in New York City, and some on the white left (writing in
The American Prospect) to champion a coalition of minor ities to unseat the "white establishment"
and become the power-holders and shapers of America's future. The coalition's leaders are system
atically encouraging Hispanics (and Asian Americans) ...
Write a 600- to 750-word paper. The LatinoHispanic group is the o.docxShainaBoling829
Write
a 600- to 750-word paper. The Latino/Hispanic group is the only ethnic category counted separately by the United States Census. According to the U.S. Census, a Latino/Hispanic person can be of any race.
Describe
the variability within the larger "Latin American" group, as defined by the U.S. Census, including the racial differences.
Include
in the paper:
When this census category became official (the first time it was used in the United States Census)
At least five distinctive subgroups that belong under this broad category
How people from Africa, both slaves and freemen, became part of the Latino population in Mexico, Central and South America, and the U.S.
How Africans in Mexico, Central and South America were absorbed into the Hispanic population, while generally being kept separate in the U.S.
How colorism affects membership within the Hispanic/Latino group today (i.e. a Mexican who is Black)
The role of language
The role of religion
The role of culture
Format
your paper consistent with appropriate course-level APA guidelines.
.
[email protected] / Hispanic Americans
SOCY 3020-E01 Race and Ethnicity in the U.S.
Fall 2018
Latinos/Hispanics in the U.S.
By the numbers:
Approximately 56.6 Million as of July 1, 2015. (about 18% of the U.S. population & constantly
growing.) (U.S. Census Bureau)
65% are of Mexican background, 9% Puerto Rican, 3.5% Cuban. The rest are grouped as ‘other’
including the Caribbean people, South Americans, and Central Americans (Pew Research Center).
Of the 15+ million of undocumented immigrants in the U.S. approximately 10 million are Hispanic
immigrants of which 7 million are of Mexican nationality (Pew Research Center).
More than half of the Latino/Hispanic American population resides in these three states: California,
Texas, and Florida.
“California had the largest Hispanic population of any state (15.2 million) in 2015. Texas had the largest
numeric increase within the Hispanic population since July 1, 2014. New Mexico had the highest
percentage of Hispanics at 48.0 percent” (U.S. Census Bureau).
Stewart County in southwest Georgia experienced the most growth in the Hispanic population since
2000, growing 1,754% over 13 years (Pew Research Center).
Latino vs. Hispanics
Latino vs. Hispanic: The Terminology Conflict
What is “Latino?” A Latino is someone from Latin America.
What is “Hispanic?” A Hispanic is an “Hispano parlante” which translates into a Spanish-speaking
individual.
Why both terms? Both terms are used interchangeably in order to try to include as many Latin Ethnic
groups as possible.
Which one is used over the other depends on different parts of the country. Usually, Latino is
predominantly used as a term in the East Coast and Hispanic is used in the West Coast, even though
either term is being applied interchangeably nowadays.
Why does the government prefers “Latino” over “Hispanic?” It simply correlates to the federal
government being on the East Coast and using the term “Latino.”
Pan-Latinoness
Mexico
Mexico is divided in 31 states.
Pop: 124 million.
Ranked 10th most populated country in the world behind Russia and followed by Japan.
Central America & The Caribbean
U.K., U.S., French, Dutch, and independent countries.
Seven Central American countries.
South America
Twelve countries.
One French Territory.
One British Territory
Five different languages spoken:
Spanish,
Portuguese in Brazil.
French in French Guyana,
Dutch in Suriname,
English in Guyana.
“Pan-Latinoness:” Myth or Reality?
The Pan-Latino approach is an example of a panethnicity factor in U.S. society.
As Schaefer (2002) explains, panethnicity “refers to the development of solidarity among ethnic
subgroups.
Non-Hispanics often give single label to the diverse group of native-born Latino Americans and
immigrants.
This labeling by the out-group is similar to the dominant group’s wa.
THe Latinohispanic group is the only ethnic category counted separa.docxmallisonshavon
THe Latino/hispanic group is the only ethnic category counted separately by the United States Census, According to the U.S. Census, a Latino/Hispanic person can be of any race.
Describe the variability within the Larger "Latin American" group, as defined by the U.S. Census, including the racial differences.
Include the following:
* When this census category became official ( the first time it was used in tyhe United States Census)
* At least five distinctive subgroups that belong under this broad category
* How people from Africa, both slaves and freemen, became part of the Latino population in Mexico, Central and South America, and the U.S.
* How Africans in Mexico, Central and South America were absorbed into the Hispanic population, white generally being kept seperate in the U.S,
* How colorism affects membership within the Hispanic/Latino group today( i.e. a Mexican who is black)
* the role of language
* the role of religion
* the role of culture
Format your paper consistent with APA guidelines.
.
Oxford University Press is collaborating with JSTOR to digit.docxaryan532920
Oxford University Press is collaborating with JSTOR to digitize, preserve and extend access to Social Forces.
http://www.jstor.org
White, Black, or Puerto Rican? Racial Self-Identification among Mainland and Island Puerto
Ricans
Author(s): Nancy S. Landale and R.S. Oropesa
Source: Social Forces, Vol. 81, No. 1 (Sep., 2002), pp. 231-254
Published by: Oxford University Press
Stable URL: http://www.jstor.org/stable/3086533
Accessed: 09-04-2015 20:00 UTC
Your use of the JSTOR archive indicates your acceptance of the Terms & Conditions of Use, available at
http://www.jstor.org/page/info/about/policies/terms.jsp
JSTOR is a not-for-profit service that helps scholars, researchers, and students discover, use, and build upon a wide range of content
in a trusted digital archive. We use information technology and tools to increase productivity and facilitate new forms of scholarship.
For more information about JSTOR, please contact [email protected]
This content downloaded from 144.13.128.131 on Thu, 09 Apr 2015 20:00:29 UTC
All use subject to JSTOR Terms and Conditions
http://www.jstor.org
http://www.jstor.org/action/showPublisher?publisherCode=oup
http://www.jstor.org/stable/3086533
http://www.jstor.org/page/info/about/policies/terms.jsp
White, Black, or Puerto Rican?
Racial Self-Identification among Mainland
and Island Puerto Ricans*
NANCY S. LANDALE, Pennsylvania State University
R.S. OROPESA, Pennsylvania State University
Abstract
Recent studies have examined the implications of exposure to U.S. race relations for the
racial and ethnic identities of migrants to the U.S. Most investigations are based
exclusively on U.S. data. There arefew, if any, comparisons of the identities of migrants
and their offspring to those of nonmigrants in their country of origin. Using data from
a survey of Puerto Rican mothers in the U.S. and Puerto Rico, this study provides such
a comparison. Responses to an open-ended race question show that mainland and island
Puerto Ricans most often designate their "race" as Puerto Rican, but responses of women
who do not self-identify as Puerto Rican diverge between the U.S. and Puerto Rico.
Island women primarily identify themselves as white, black, or triguefa, while mainland
women identify themselves as Hispanic/Latina, Hispanic American, or American.
Mainland-island differences cannot be explained by parental ethnicity, skin tone,
demographic factors, and socioeconomic status. The findings suggest that mainland
Puerto Ricans more strongly reject the conventional U.S. notion of race than do their
island counterparts.
During the last several years, both the meaning and the measurement of race have
resurfaced as important academic and policy concerns. The growing diversity of
the U.S. population and an increase in the number of mixed-race individuals have
stimulated a reconsideration of the complexities of racial self-identification ...
Discussion - Week 3 Top of FormPrejudice, Discrimination, .docxowenhall46084
Discussion - Week 3
Top of Form
Prejudice, Discrimination, and Assimilation in the United States
Racial and ethnic groups have faced various challenges throughout their history in the United States. Many have had to deal with hardships and persecution and contend with prevalent sentiments of distrust and disapproval. Others have been able to gain quick success in climbing the economic and political ladder (Pew Research Center, 2016b). They have all had to make significant adjustments in order to secure health access, work, housing, and political rights and to come to terms with dominant cultural practices and expectations within the community. Understanding the journey of the multiple racial and ethnic groups in the United States helps shed light on the issues and vulnerabilities they face and provides greater comprehension of the complex movement of the United States as a nation of immigrants.
In this week’s Discussion, you will focus on
one
of the following groups regarding their historical experience with prejudice, discrimination, and assimilation within the United States:
Native Americans
African Americans
Hispanic Americans
Asian Americans
White ethnic Americans
Jewish Americans
Arab Americans
You will analyze the historical background and treatment of that racial or ethnic group in the
United States
and their current status with regard to access and participation.
Note:
In the Week 3 and Week 4 Discussions, you are required to choose different racial or ethnic groups to analyze (
a United States group in Week 3
and a Non-United States group in Week 4). For your Course Project you must use one of the groups you chose in either Week 3 or 4 to be the focus of your analysis.
To prepare:
Review Chapters 5 and 13 and the chapter you have chosen to examine related to your chosen specific group: Native Americans, African Americans, Hispanic Americans, Asian Americans, White ethnic Americans, Jewish Americans, or Arab Americans from Part 2 of the textbook.
Consider the issues related to the group you choose with regard to its challenges with prejudice, discrimination, and assimilation.
Post 350 word
analysis of the group you chose in which you do the following:
.
By Faanda DesirNUR 3655—Culture in Nursing Practice Profess.docxRAHUL126667
By: Faanda Desir
NUR 3655—Culture in Nursing Practice
Professor: Eddie Cruz, RN MSN
BSN HC 0517
Culture and Socio-culture groups
1
Haitians are people who are living in Haiti. Their ancestors were slaves from Africa and were taken to the nation by Spaniards (Laguerre, 2016).
In the 1790s, the slaves decided to revolt against the French colonies and they fled to American seaports.
The immigrants were very determined to survive in the new land, United States of America.
African-Americans are particular ethnic group of Americans who are totally of partially having an ancestry from the Black racial group in Africa.
Most of them descended from the enslaved Africans (Fatma et al., 2013).
African Americans is the third largest ethnic group in United States of America after White Americans and Latino Americans.
History
Black-Americans
Haitian Heritage
African-American history is the part of American history that looks at the African-American or Black American ethnic groups in the United States.
According to the United States Census of 1990, there were about 290,000 people who claimed Haitian ancestry.
2
This is the reason why they are called the Haitian Americans (Jackson, Maurice & Jacqueline, 2013).
The history of the Black Americans starts when people from West Africa were being taken as slaves to Spanish America in the 17th century.
Some of them were freed after the Civil war in 1865.
History cont.
Black-Americans
Haitian Heritage
Most African Americans are the descendants of Africans forcibly brought to and held captive in the United States from 1555 to 1865.
It was then that the black populace of the island revolted against slavery and there was a panicked exodus.
3
The Haitian American have strong belief in their homeland culture and traditions.
They believe that illness are from supernatural origin and they are caused by angry spirits (Laguerre, 2016).
A Haitian American family is supposed to provide a niche that would allow their descendants practice cultural continuity.
The distinct identity of African-American culture is rooted in the historical experience of the African-American people.
The culture is both distinct and enormously influential on American culture as a whole.
The Culture of African American people is majorly rooted in the Central and West Africa (Wizdom, 2012).
Values and worldview
Black-Americans
Haitian Heritage
Elaborate rituals and ceremonies were a significant part of African Americans' ancestral culture. Many West African societies traditionally believed that spirits dwelled in their surrounding nature.
Through the medium of the family, which influences the behaviors of Haitian American family members through the mechanism of socialization.
4
Haitian Americans speak three languages; French, English and Creole.
A great number of them speak only Creole.
This is a language which developed when the Africans slaves were taken from various places to Caribbean island (Jackson, Maurice & Jacqueline ...
8 Asian AmericansListen to Chapter 8 on MySocLab· 8-1 Identi.docxransayo
8 Asian Americans
Listen to Chapter 8 on MySocLab
· 8-1 Identify the role of diversity among Asian Americans.
· 8-2 List and describe the characteristics of political activity and pan-Asian identity.
· 8-3 Examine and explain the culture of Chinese Americans.
· 8-4 Summarize the characteristics of Asian Indians.
· 8-5 Explain the four distinct periods of Filipino immigration.
· 8-6 Address the current picture of Korean Americans today.
· 8-7 Examine the various characteristics of Japanese American identity and explain the consequences of the wartime evacuation.
· 8-8 Identify the challenges for Southeast Asian Americans in the United States.
· 8-9 Discuss the embodiment of cultural diversity in Hawaii.
If the diversity of racial and ethnic groups is not yet apparent in this book, one need only look at the diversity among those collectively labeled Asian Americans. Consider Priscilla Chan, who at the age of 27 in May of 2012 was married and had sushi and Mexican food served at the reception. Both her parents, ethnic Chinese from Vietnam who arrived in the United States via refugee camps in the 1970s, worked such long hours in Boston restaurants that her grandmothers, who spoke no English, raised her. Born in the United States, Priscilla graduated from Harvard majoring in biology and later taught grade school while attending medical school. Of special interest is that she married a non-Asian (Facebook founder Mark Zuckerberg) and thus is an example of the 29 percent of recent Asian American newlyweds who marry non-Asians.
Then, one could look at football in Texas. Friday night lights is synonymous with Texas high school football, but at one school, many of the players were born on the Pacific island of Tonga. As 6-foot-2, 297-pound Trinity High offensive tackle Uatakini Cocker takes the line, he screams, “Mate ma’a Tonga,” which means “I will die for Tonga.” He is one of sixteen Tongan Americans playing for the school. The school has won the state football championship three of the last six years and was runner-up in another year. Trinity is located in Euless, which adjoins the Dallas-Fort Worth Airport, where Tongans in the early 1970s first started working. The success among some of these first immigrants initiated a pattern of chain immigration, whereby Tongan immigrants sponsor later immigrants. Euless boasts about 4,000 people either born in Tonga or their descendants.
Los Angeles’s Little Tokyo is a happening place. Debbie Hazama, 35, a homemaker with three children, drove with her husband from the suburbs because not many Japanese Americans live where she does and she wants her children “to stay connected.” Little Tokyo threw a day-long party of Asian hip-hop along with traditional martial arts demonstrations to gather Japanese Americans scattered across Southern California. During one festival, a 24-year-old South Pasadena woman grabbed a heavy mallet and took a swing at a drum, just as she had practiced for months. Nicole Miyako Cherr.
Examine how nature is discussed throughout The Open Boat.” Loo.docxcravennichole326
Examine how nature is discussed throughout “The Open Boat.” Look at the literary critical piece by Anthony Channell Hilfer. Once you have established your own ideas, consider how Hilfer discusses nature in the short story and analyze the following questions: What does nature mean to the men aboard the boat? or Do their perceptions of nature shift throughout the story? Why or why not?
Do their perceptions of nature shift throughout the story? Why or why not?
Write down a loose response about what I think of the question and what I remember of the story.
ICE method.
I introduce the citation
C the citation itself
E explain its meaning to your argument.
The scenes shift with no discernable rhyme or reason. Crane invites every reader in. Critic Anthony Channell Hilfer disagrees with point, saying, “Crane’s image is an accusation of the putative picturesque spectators” (Hilfer 254). Hilfer’s challenge goes against what Crane is trying to do, by making nature a copilot through the reading.
3. Nature as Protagonist in “The Open Boat”
Anthony Channell Hilfer
Texas Studies in Literature and Language, Volume 54, Number 2, Summer
2012, pp. 248-257 (Article)
Published by University of Texas Press
DOI:
For additional information about this article
[ Access provided at 9 Apr 2020 17:36 GMT from Marymount University & (Viva) ]
https://doi.org/10.1353/tsl.2012.0012
https://muse.jhu.edu/article/476402
https://doi.org/10.1353/tsl.2012.0012
https://muse.jhu.edu/article/476402
Anthony Channell Hilfer248
3. Nature as Protagonist in “The Open Boat”
The bottom of the sea is cruel.
—Hart Crane, “Voyages”
As many critics have argued, questions of perspective and epistemology are
central to Stephen Crane’s “The Open Boat” (Kent; Hutchinson). The story’s
first sentence famously clues us to this: “None of them knew the color of
the sky” (68). But behind the uncertainties of perspective is a determinable
ontology, a presence, or rather, I shall argue, a sort of presence, the existence
of which implies a rectified aesthetic response. This response emerges, how-
ever, from negations, denials, and occultations: what is not seen, who is not
there, and what does not happen.3 Here again, when we look at nature we
behold things that are not there and miss “the nothing that is.”
Fully as much as Stevens in “The Snow Man,” Crane is concerned
with certain conventions of representation: personification, the pictur-
esque, the American sublime, and the melodramatic, which although it
does not inform “The Snow Man” is played on in Stevens’s “The Ameri-
can Sublime.” Crane’s story is intertextual with nature poetry, sentimental
poetry, hymns, and landscape art, as well as with Darwinism, theological
clichés, and, less obviously, theological actualities. For the most part these
conventions add up to what the Stevens poem declares is “not there.” To
get to “the nothing that is” we must first traverse this ocean of error. Doing
so helps keep our p.
Examine All Children Can Learn. Then, search the web for effec.docxcravennichole326
Examine
"All Children Can Learn"
. Then, search the web for effective, evidence-based differentiated strategies that are engaging, motivating, and address the needs of individual learners.
First, provide five evidence-based strategies:
Two instructional strategies (i.e., graphic organizers),
Two instructional tools (e.g., technology tool, device or iPad App, Web Quests, etc.),
One activity (e.g., Think-Pair-Share).
Second, for the two instructional strategies you listed explain how you can alter each to address the classroom needs you designed in Weeks One and Two and how the modification is relevant to the theory of differentiation.
.
More Related Content
Similar to Census 2000 showedthat the United Statespopulation was 281.docx
(£7 INVENTING HISPANICS A DIVERSE MINORITY RESISTS BEI.docxmercysuttle
\(£7
INVENTING HISPANICS: A DIVERSE MINORITY
RESISTS BEING LABELED
Amitai Etzioni
GOALS
To illustrate the complexity of Hisp a nic cultural identity in the United States
To present so me of the economi c and political issues that affect America's largest "minor
ity" group
Thirt y yea rs ago immig rant s fro m Latin America who seltled in the United States were perceived
in ter m s of their home nation-as, for example. Cuba n America ns or Mexican America ns, just as
European newcomers were seen as Itali a n America ns or Poli sh Americans. Today the immigrant
fl ow from Central a nd South America has grown substanti J l1 y. and the newcomers are known as
Hispa nics.
Some observers have exp ressed co ncern that efforts to make Hi spa nics a single minority
group-for purpo ses rang ing from el ec tions to education to the allocatio n of public funds-are
furth e r dividing America n society along racial lines . But attempts. both incide ntal and ideologi
cal, to fo rge these American immigran ts into a st ro ngl y d efin ed minority are encountering an
un anti cipated prob lem. Hi spanics by and large do not see th emselves as a di sti nct minority
grou p; they do see themselves as America ns.
HISPANICS AND AFRICAN AMERICANS
Hispan ics are p articularly important for understanding the future of diversity in American soci
~ty. ~lrea~y th ey have overtaken African Americans to beco m e the nati on's largest minority. and
Immig ra tIOn patte rns en sure that the number of H ispanics will continue to grow more rapidl y
than th a t of Africa n America n s.
U.S. race relations h ave long b een understood in term s of black and white. Until recently.
many books on th e subject did not even m e nti o n other races, or did so o nly as a brief after
thought. No w recognition is g row ing t ha t Hi spa nics a re replac ing blacks as the primary minorit y.
But whereas blacks have long been r aising their p o litical con sciousness, Hispanics have only just
begun to find th eir political legs.
. Recent inc reases in minority populations and a d ecline in the white majority in the
UOited States h ave driven seve ral African- America n leaders. including Jesse Jackson a nd form er
From Brookings Review \Vinter 200 2 10-11 C . .'~.J
R . db '" . ' pp. opy rl g ht 2002 by the IlW{Il..lllgS InstItution Pres... All nghts reserVl"U.
epnnle y permi SS ion. Reprinted with pcrmis~iOI1 from th e 8rookm~s In ..titutc.
90
91 Inventing 11i spanics: A Diverse Minority Resists Being Labeled
New York City Mayor David Dinkins, along with a few Hispanics, such as Fernando Ferrer, a
candidate for the 2002 mayoral election in New York City, and some on the white left (writing in
The American Prospect) to champion a coalition of minor ities to unseat the "white establishment"
and become the power-holders and shapers of America's future. The coalition's leaders are system
atically encouraging Hispanics (and Asian Americans) ...
Write a 600- to 750-word paper. The LatinoHispanic group is the o.docxShainaBoling829
Write
a 600- to 750-word paper. The Latino/Hispanic group is the only ethnic category counted separately by the United States Census. According to the U.S. Census, a Latino/Hispanic person can be of any race.
Describe
the variability within the larger "Latin American" group, as defined by the U.S. Census, including the racial differences.
Include
in the paper:
When this census category became official (the first time it was used in the United States Census)
At least five distinctive subgroups that belong under this broad category
How people from Africa, both slaves and freemen, became part of the Latino population in Mexico, Central and South America, and the U.S.
How Africans in Mexico, Central and South America were absorbed into the Hispanic population, while generally being kept separate in the U.S.
How colorism affects membership within the Hispanic/Latino group today (i.e. a Mexican who is Black)
The role of language
The role of religion
The role of culture
Format
your paper consistent with appropriate course-level APA guidelines.
.
[email protected] / Hispanic Americans
SOCY 3020-E01 Race and Ethnicity in the U.S.
Fall 2018
Latinos/Hispanics in the U.S.
By the numbers:
Approximately 56.6 Million as of July 1, 2015. (about 18% of the U.S. population & constantly
growing.) (U.S. Census Bureau)
65% are of Mexican background, 9% Puerto Rican, 3.5% Cuban. The rest are grouped as ‘other’
including the Caribbean people, South Americans, and Central Americans (Pew Research Center).
Of the 15+ million of undocumented immigrants in the U.S. approximately 10 million are Hispanic
immigrants of which 7 million are of Mexican nationality (Pew Research Center).
More than half of the Latino/Hispanic American population resides in these three states: California,
Texas, and Florida.
“California had the largest Hispanic population of any state (15.2 million) in 2015. Texas had the largest
numeric increase within the Hispanic population since July 1, 2014. New Mexico had the highest
percentage of Hispanics at 48.0 percent” (U.S. Census Bureau).
Stewart County in southwest Georgia experienced the most growth in the Hispanic population since
2000, growing 1,754% over 13 years (Pew Research Center).
Latino vs. Hispanics
Latino vs. Hispanic: The Terminology Conflict
What is “Latino?” A Latino is someone from Latin America.
What is “Hispanic?” A Hispanic is an “Hispano parlante” which translates into a Spanish-speaking
individual.
Why both terms? Both terms are used interchangeably in order to try to include as many Latin Ethnic
groups as possible.
Which one is used over the other depends on different parts of the country. Usually, Latino is
predominantly used as a term in the East Coast and Hispanic is used in the West Coast, even though
either term is being applied interchangeably nowadays.
Why does the government prefers “Latino” over “Hispanic?” It simply correlates to the federal
government being on the East Coast and using the term “Latino.”
Pan-Latinoness
Mexico
Mexico is divided in 31 states.
Pop: 124 million.
Ranked 10th most populated country in the world behind Russia and followed by Japan.
Central America & The Caribbean
U.K., U.S., French, Dutch, and independent countries.
Seven Central American countries.
South America
Twelve countries.
One French Territory.
One British Territory
Five different languages spoken:
Spanish,
Portuguese in Brazil.
French in French Guyana,
Dutch in Suriname,
English in Guyana.
“Pan-Latinoness:” Myth or Reality?
The Pan-Latino approach is an example of a panethnicity factor in U.S. society.
As Schaefer (2002) explains, panethnicity “refers to the development of solidarity among ethnic
subgroups.
Non-Hispanics often give single label to the diverse group of native-born Latino Americans and
immigrants.
This labeling by the out-group is similar to the dominant group’s wa.
THe Latinohispanic group is the only ethnic category counted separa.docxmallisonshavon
THe Latino/hispanic group is the only ethnic category counted separately by the United States Census, According to the U.S. Census, a Latino/Hispanic person can be of any race.
Describe the variability within the Larger "Latin American" group, as defined by the U.S. Census, including the racial differences.
Include the following:
* When this census category became official ( the first time it was used in tyhe United States Census)
* At least five distinctive subgroups that belong under this broad category
* How people from Africa, both slaves and freemen, became part of the Latino population in Mexico, Central and South America, and the U.S.
* How Africans in Mexico, Central and South America were absorbed into the Hispanic population, white generally being kept seperate in the U.S,
* How colorism affects membership within the Hispanic/Latino group today( i.e. a Mexican who is black)
* the role of language
* the role of religion
* the role of culture
Format your paper consistent with APA guidelines.
.
Oxford University Press is collaborating with JSTOR to digit.docxaryan532920
Oxford University Press is collaborating with JSTOR to digitize, preserve and extend access to Social Forces.
http://www.jstor.org
White, Black, or Puerto Rican? Racial Self-Identification among Mainland and Island Puerto
Ricans
Author(s): Nancy S. Landale and R.S. Oropesa
Source: Social Forces, Vol. 81, No. 1 (Sep., 2002), pp. 231-254
Published by: Oxford University Press
Stable URL: http://www.jstor.org/stable/3086533
Accessed: 09-04-2015 20:00 UTC
Your use of the JSTOR archive indicates your acceptance of the Terms & Conditions of Use, available at
http://www.jstor.org/page/info/about/policies/terms.jsp
JSTOR is a not-for-profit service that helps scholars, researchers, and students discover, use, and build upon a wide range of content
in a trusted digital archive. We use information technology and tools to increase productivity and facilitate new forms of scholarship.
For more information about JSTOR, please contact [email protected]
This content downloaded from 144.13.128.131 on Thu, 09 Apr 2015 20:00:29 UTC
All use subject to JSTOR Terms and Conditions
http://www.jstor.org
http://www.jstor.org/action/showPublisher?publisherCode=oup
http://www.jstor.org/stable/3086533
http://www.jstor.org/page/info/about/policies/terms.jsp
White, Black, or Puerto Rican?
Racial Self-Identification among Mainland
and Island Puerto Ricans*
NANCY S. LANDALE, Pennsylvania State University
R.S. OROPESA, Pennsylvania State University
Abstract
Recent studies have examined the implications of exposure to U.S. race relations for the
racial and ethnic identities of migrants to the U.S. Most investigations are based
exclusively on U.S. data. There arefew, if any, comparisons of the identities of migrants
and their offspring to those of nonmigrants in their country of origin. Using data from
a survey of Puerto Rican mothers in the U.S. and Puerto Rico, this study provides such
a comparison. Responses to an open-ended race question show that mainland and island
Puerto Ricans most often designate their "race" as Puerto Rican, but responses of women
who do not self-identify as Puerto Rican diverge between the U.S. and Puerto Rico.
Island women primarily identify themselves as white, black, or triguefa, while mainland
women identify themselves as Hispanic/Latina, Hispanic American, or American.
Mainland-island differences cannot be explained by parental ethnicity, skin tone,
demographic factors, and socioeconomic status. The findings suggest that mainland
Puerto Ricans more strongly reject the conventional U.S. notion of race than do their
island counterparts.
During the last several years, both the meaning and the measurement of race have
resurfaced as important academic and policy concerns. The growing diversity of
the U.S. population and an increase in the number of mixed-race individuals have
stimulated a reconsideration of the complexities of racial self-identification ...
Discussion - Week 3 Top of FormPrejudice, Discrimination, .docxowenhall46084
Discussion - Week 3
Top of Form
Prejudice, Discrimination, and Assimilation in the United States
Racial and ethnic groups have faced various challenges throughout their history in the United States. Many have had to deal with hardships and persecution and contend with prevalent sentiments of distrust and disapproval. Others have been able to gain quick success in climbing the economic and political ladder (Pew Research Center, 2016b). They have all had to make significant adjustments in order to secure health access, work, housing, and political rights and to come to terms with dominant cultural practices and expectations within the community. Understanding the journey of the multiple racial and ethnic groups in the United States helps shed light on the issues and vulnerabilities they face and provides greater comprehension of the complex movement of the United States as a nation of immigrants.
In this week’s Discussion, you will focus on
one
of the following groups regarding their historical experience with prejudice, discrimination, and assimilation within the United States:
Native Americans
African Americans
Hispanic Americans
Asian Americans
White ethnic Americans
Jewish Americans
Arab Americans
You will analyze the historical background and treatment of that racial or ethnic group in the
United States
and their current status with regard to access and participation.
Note:
In the Week 3 and Week 4 Discussions, you are required to choose different racial or ethnic groups to analyze (
a United States group in Week 3
and a Non-United States group in Week 4). For your Course Project you must use one of the groups you chose in either Week 3 or 4 to be the focus of your analysis.
To prepare:
Review Chapters 5 and 13 and the chapter you have chosen to examine related to your chosen specific group: Native Americans, African Americans, Hispanic Americans, Asian Americans, White ethnic Americans, Jewish Americans, or Arab Americans from Part 2 of the textbook.
Consider the issues related to the group you choose with regard to its challenges with prejudice, discrimination, and assimilation.
Post 350 word
analysis of the group you chose in which you do the following:
.
By Faanda DesirNUR 3655—Culture in Nursing Practice Profess.docxRAHUL126667
By: Faanda Desir
NUR 3655—Culture in Nursing Practice
Professor: Eddie Cruz, RN MSN
BSN HC 0517
Culture and Socio-culture groups
1
Haitians are people who are living in Haiti. Their ancestors were slaves from Africa and were taken to the nation by Spaniards (Laguerre, 2016).
In the 1790s, the slaves decided to revolt against the French colonies and they fled to American seaports.
The immigrants were very determined to survive in the new land, United States of America.
African-Americans are particular ethnic group of Americans who are totally of partially having an ancestry from the Black racial group in Africa.
Most of them descended from the enslaved Africans (Fatma et al., 2013).
African Americans is the third largest ethnic group in United States of America after White Americans and Latino Americans.
History
Black-Americans
Haitian Heritage
African-American history is the part of American history that looks at the African-American or Black American ethnic groups in the United States.
According to the United States Census of 1990, there were about 290,000 people who claimed Haitian ancestry.
2
This is the reason why they are called the Haitian Americans (Jackson, Maurice & Jacqueline, 2013).
The history of the Black Americans starts when people from West Africa were being taken as slaves to Spanish America in the 17th century.
Some of them were freed after the Civil war in 1865.
History cont.
Black-Americans
Haitian Heritage
Most African Americans are the descendants of Africans forcibly brought to and held captive in the United States from 1555 to 1865.
It was then that the black populace of the island revolted against slavery and there was a panicked exodus.
3
The Haitian American have strong belief in their homeland culture and traditions.
They believe that illness are from supernatural origin and they are caused by angry spirits (Laguerre, 2016).
A Haitian American family is supposed to provide a niche that would allow their descendants practice cultural continuity.
The distinct identity of African-American culture is rooted in the historical experience of the African-American people.
The culture is both distinct and enormously influential on American culture as a whole.
The Culture of African American people is majorly rooted in the Central and West Africa (Wizdom, 2012).
Values and worldview
Black-Americans
Haitian Heritage
Elaborate rituals and ceremonies were a significant part of African Americans' ancestral culture. Many West African societies traditionally believed that spirits dwelled in their surrounding nature.
Through the medium of the family, which influences the behaviors of Haitian American family members through the mechanism of socialization.
4
Haitian Americans speak three languages; French, English and Creole.
A great number of them speak only Creole.
This is a language which developed when the Africans slaves were taken from various places to Caribbean island (Jackson, Maurice & Jacqueline ...
8 Asian AmericansListen to Chapter 8 on MySocLab· 8-1 Identi.docxransayo
8 Asian Americans
Listen to Chapter 8 on MySocLab
· 8-1 Identify the role of diversity among Asian Americans.
· 8-2 List and describe the characteristics of political activity and pan-Asian identity.
· 8-3 Examine and explain the culture of Chinese Americans.
· 8-4 Summarize the characteristics of Asian Indians.
· 8-5 Explain the four distinct periods of Filipino immigration.
· 8-6 Address the current picture of Korean Americans today.
· 8-7 Examine the various characteristics of Japanese American identity and explain the consequences of the wartime evacuation.
· 8-8 Identify the challenges for Southeast Asian Americans in the United States.
· 8-9 Discuss the embodiment of cultural diversity in Hawaii.
If the diversity of racial and ethnic groups is not yet apparent in this book, one need only look at the diversity among those collectively labeled Asian Americans. Consider Priscilla Chan, who at the age of 27 in May of 2012 was married and had sushi and Mexican food served at the reception. Both her parents, ethnic Chinese from Vietnam who arrived in the United States via refugee camps in the 1970s, worked such long hours in Boston restaurants that her grandmothers, who spoke no English, raised her. Born in the United States, Priscilla graduated from Harvard majoring in biology and later taught grade school while attending medical school. Of special interest is that she married a non-Asian (Facebook founder Mark Zuckerberg) and thus is an example of the 29 percent of recent Asian American newlyweds who marry non-Asians.
Then, one could look at football in Texas. Friday night lights is synonymous with Texas high school football, but at one school, many of the players were born on the Pacific island of Tonga. As 6-foot-2, 297-pound Trinity High offensive tackle Uatakini Cocker takes the line, he screams, “Mate ma’a Tonga,” which means “I will die for Tonga.” He is one of sixteen Tongan Americans playing for the school. The school has won the state football championship three of the last six years and was runner-up in another year. Trinity is located in Euless, which adjoins the Dallas-Fort Worth Airport, where Tongans in the early 1970s first started working. The success among some of these first immigrants initiated a pattern of chain immigration, whereby Tongan immigrants sponsor later immigrants. Euless boasts about 4,000 people either born in Tonga or their descendants.
Los Angeles’s Little Tokyo is a happening place. Debbie Hazama, 35, a homemaker with three children, drove with her husband from the suburbs because not many Japanese Americans live where she does and she wants her children “to stay connected.” Little Tokyo threw a day-long party of Asian hip-hop along with traditional martial arts demonstrations to gather Japanese Americans scattered across Southern California. During one festival, a 24-year-old South Pasadena woman grabbed a heavy mallet and took a swing at a drum, just as she had practiced for months. Nicole Miyako Cherr.
Similar to Census 2000 showedthat the United Statespopulation was 281.docx (20)
Examine how nature is discussed throughout The Open Boat.” Loo.docxcravennichole326
Examine how nature is discussed throughout “The Open Boat.” Look at the literary critical piece by Anthony Channell Hilfer. Once you have established your own ideas, consider how Hilfer discusses nature in the short story and analyze the following questions: What does nature mean to the men aboard the boat? or Do their perceptions of nature shift throughout the story? Why or why not?
Do their perceptions of nature shift throughout the story? Why or why not?
Write down a loose response about what I think of the question and what I remember of the story.
ICE method.
I introduce the citation
C the citation itself
E explain its meaning to your argument.
The scenes shift with no discernable rhyme or reason. Crane invites every reader in. Critic Anthony Channell Hilfer disagrees with point, saying, “Crane’s image is an accusation of the putative picturesque spectators” (Hilfer 254). Hilfer’s challenge goes against what Crane is trying to do, by making nature a copilot through the reading.
3. Nature as Protagonist in “The Open Boat”
Anthony Channell Hilfer
Texas Studies in Literature and Language, Volume 54, Number 2, Summer
2012, pp. 248-257 (Article)
Published by University of Texas Press
DOI:
For additional information about this article
[ Access provided at 9 Apr 2020 17:36 GMT from Marymount University & (Viva) ]
https://doi.org/10.1353/tsl.2012.0012
https://muse.jhu.edu/article/476402
https://doi.org/10.1353/tsl.2012.0012
https://muse.jhu.edu/article/476402
Anthony Channell Hilfer248
3. Nature as Protagonist in “The Open Boat”
The bottom of the sea is cruel.
—Hart Crane, “Voyages”
As many critics have argued, questions of perspective and epistemology are
central to Stephen Crane’s “The Open Boat” (Kent; Hutchinson). The story’s
first sentence famously clues us to this: “None of them knew the color of
the sky” (68). But behind the uncertainties of perspective is a determinable
ontology, a presence, or rather, I shall argue, a sort of presence, the existence
of which implies a rectified aesthetic response. This response emerges, how-
ever, from negations, denials, and occultations: what is not seen, who is not
there, and what does not happen.3 Here again, when we look at nature we
behold things that are not there and miss “the nothing that is.”
Fully as much as Stevens in “The Snow Man,” Crane is concerned
with certain conventions of representation: personification, the pictur-
esque, the American sublime, and the melodramatic, which although it
does not inform “The Snow Man” is played on in Stevens’s “The Ameri-
can Sublime.” Crane’s story is intertextual with nature poetry, sentimental
poetry, hymns, and landscape art, as well as with Darwinism, theological
clichés, and, less obviously, theological actualities. For the most part these
conventions add up to what the Stevens poem declares is “not there.” To
get to “the nothing that is” we must first traverse this ocean of error. Doing
so helps keep our p.
Examine All Children Can Learn. Then, search the web for effec.docxcravennichole326
Examine
"All Children Can Learn"
. Then, search the web for effective, evidence-based differentiated strategies that are engaging, motivating, and address the needs of individual learners.
First, provide five evidence-based strategies:
Two instructional strategies (i.e., graphic organizers),
Two instructional tools (e.g., technology tool, device or iPad App, Web Quests, etc.),
One activity (e.g., Think-Pair-Share).
Second, for the two instructional strategies you listed explain how you can alter each to address the classroom needs you designed in Weeks One and Two and how the modification is relevant to the theory of differentiation.
.
Examine each of these items, which are available on the internet .docxcravennichole326
Examine each of these items, which are available on the internet:
1) for music, listen to the first movement of J.S. Bach's MAGNIFICAT; this is the High Baroque era. If you can find a performance with Sir John Eliot Gardiner and his Monteverdi Choir and the English Baroque soloists, go for it.
2) For art, find Giovanni Bellini's ST. FRANCIS IN THE DESERT; you might want to read up on the background of this wonderful painting. Not only St. Francis, but what else do you notice i the painting?
3) For architecture, look at the church at Melk Abbey, Austria; BE SURE to look at the interior shots. Again,
this is high Baroque--but in post-Reformation Catholicism, it had a political aim, too; can you figure it out?
After you have analyzed these, telling what you think the artists/musicians valued and were trying to express, tell me what
YOU think about them! Remember, if you read up on these items, LIST THE WORKS YOU CONSULTED! That way, you avoid plagiarism.
write a 1-page paper on each of these three, telling 1) where they found this value, 2) why it was important “back then,” and 3) is it still around today.
.
Examine a web browser interface and describe the various forms .docxcravennichole326
Examine a web browser interface and describe the various forms of analogy and composite interface metaphors that have been used in its design. What familiar knowledge has been combined with new functionality? need a couple of paragraphs.. and one reference
need this in the next 4 hours..
.
Examine a scenario that includes an inter-group conflict. In this sc.docxcravennichole326
Examine a scenario that includes an inter-group conflict. In this scenario, you are recognized as an authority in cross-cultural psychology and asked to serve as a consultant to help resolve the conflict. You will be asked to write up your recommendations in a 6-page paper not including your title and reference page.
Darley, J.M. & Latané, B. (1968). Bystander interview in emergencies: Diffusion of responsibility.
Journal of Personality and Social Psychology, 8
(4), 377-383.
Scenario: Culture, Psychology, and Community
Imagine an international organization has approached you to help resolve an inter-group conflict. You are an authority in cross-cultural psychology and have been asked to serve as a consultant based on a recent violent conflict involving a refugee community in your town and a local community organization. In the days, weeks, and months leading up to the violent conflict, there were incidents of discrimination and debates regarding the different views and practices people held about work, family, schools, and religious practice. Among the controversies has been the role of women’s participation in political, educational, and community groups
.
Part 1: Developing an Understanding
(2 pages)
Based on the scenario, explain how you can help integrate the two diverse communities so that there is increased understanding and appreciation of each group by the other group. (
Note
: Make sure to include in your explanation the different views and practices of cultural groups as well as the role of women.)
Based on your knowledge of culture and psychology, provide three possible suggestions/solutions that will help the community as a whole. In your suggestions make sure to include an explanation regarding group think and individualism vs. collectivism.
Part 2: Socio-Emotional, Cognitive, and Behavioral Aspects
(2 pages)
Based on your explanations in Part 1, how do your suggestions/solutions impact the socio-emotional, cognitive, and behavior aspects of the scenario and why?
Part 3: Gender, Cultural Values and Dimensions, and Group Dynamics
(2 pages)
Explain the impact of gender, cultural values and dimensions, and group dynamics in the scenario.
Further explain any implications that may arise from when working between and within groups.
Support your Assignment by citing all resources in APA style, including those in the Learning Resources.
.
Examine a current law, or a bill proposing a law, that has to do wit.docxcravennichole326
Examine a current law, or a bill proposing a law, that has to do with technology and criminal activity. The law can be at the state or federal level. Identify the law or bill, where it comes from, and its purpose or intent. Next, identify positive outcomes if the law is successful. Finally, identify at least two unintended consequences that the law could bring about. . . DUE 4/18, 2021
.
Exam IT 505Multiple Choice (20 questions , 2 points each)Pleas.docxcravennichole326
Exam IT 505
Multiple Choice (20 questions , 2 points each)
Please Submit a word document of your exam. Please DO NOT repeat the questions. Only submit your answers for example 1.A, 2. B……Ect
1. Which of the following is NOT one of the typical characteristics of back-end networks?
A. high data rate B. high-speed interface
C. distributed access D. extended distance
2. Problems with using a single Local Area Network (LAN) to interconnect devices
on a premise include:
A. insufficient reliability, limited capacity, and inappropriate network
interconnection devices
B. insufficient reliability, limited capacity, and limited distances
C. insufficient reliability, limited distances, and inappropriate network
interconnection devices
D. limited distances, limited capacity, and inappropriate network
interconnection devices
3. Which of following is NOT one of the designs that determines data rate and
distance?
A. the number of senders B. the number of receivers
C. transmission impairment D. bandwidth
4. The fact that signal strength falls off with distance is called ________________.
A. bandwidth B. attenuation
C. resistance D. propagation
5. Which of the following is NOT one of the distinguishing characteristics for optical
fiber cables compared with twisted pair or coaxial cables?
A. greater capacity B. lower attenuation
C. electromagnetic isolation D. heavier weight
6.________ is a set of function and call programs that allow clients and servers to intercommunicate.
A. IaaS B. SQL C. API D. Middleware
7. A computer that houses information for manipulation by networked clients is a __________.
A. server B. minicomputer C. PaaS D. broker
8. ________ is software that improves connectivity between a client application and a server.
A. SQL B. API C. Middleware D. SAP
9. The inability of frame relay to do hop by hop error control is offset by:
A. its gigabit speeds B. its high overhead
C. the extensive use of in-band signaling D. the increasing reliability of networks
10. All Frame Relay nodes contain which of the following protocols?
A. LAPB B. LAPD
C. LAPF Core D. LAPF Control
11. The technique employed by Frame Relay is called __________.
A. inband signaling B. outband signaling
C. common channel signaling D. open shortest path first routing
12. In ATM, the basic transmission unit is the ________.
A. frame B. cell
C. packet D. segment
13. When using ATM, which of the following is NOT one of the advantages for the
use of virtual paths?
A. less work is needed to set a virtual path
B. the network architecture is simplified
C.
EXAM
Estructura 8.1 - Miniprueba A
Verbos
Complete the chart with the correct verb forms.
infinitivo
seguir
(1) [removed]
yo
(2) [removed]
morí
tú
seguiste
(3) [removed]
nosotras
seguimos
(4) [removed]
ellos
(5) [removed]
murieron
Completar
Fill in the blanks with the correct preterite forms of the verbs in parentheses.
Diego y Javier [removed] (conseguir) un mapa.
Esta mañana usted [removed] (despedirse) de los estudiantes.
Tú [removed] (sentirse) mal ayer.
La semana pasada yo no [removed] (dormir) bien.
Amparo [removed] (preferir) comer en casa.
Oraciones
Write sentences using the information provided. Use the preterite and make any necessary changes.
Modelo
Edgar / preferir / pollo asado
Edgar prefirió el pollo asado.
Álvaro y yo / servir / los entremeses
[removed]
¿quién / repetir / las instrucciones?
[removed]
ayer / yo / despedirse / de / mis sobrinos
[removed]
ustedes / dormirse / a las diez
[removed]
La cena
Fill in the blanks with the preterite form of the appropriate verbs from the list. Four verbs will not be used.
abrir
conseguir
escoger
leer
mirar
pedir
preferir
probar
repetir
sentirse
servir
vestirse
Anoche Jorge, Iván y yo salimos a cenar a Mi Tierra, un restaurante guatemalteco. Nosotros
(1) [removed]
este lugar porque Jorge
(2) [removed]
una reseña (
review
) en Internet que decía (
said
) que la comida es auténtica y muy sabrosa. No es un restaurante elegante; entonces nosotros
(3) [removed]
de bluejeans. De verdad, en Mi Tierra mis amigos y yo
(4) [removed]
como (
like
) en casa. El camarero que nos
(5) [removed]
fue muy amable. Para empezar, Jorge e Iván
(6) [removed]
tamales, pero yo
(7) [removed]
esperar el plato principal: carne de res con arroz y frijoles. Comimos tanto (
so much
) que no
(8) [removed]
nada de postre (
dessert
). ¡Fue una cena deliciosa!
.
Examine current practice guidelines related to suicide screeni.docxcravennichole326
Examine current practice guidelines related to suicide screening and prevention and how they could pertain to John.
Choose two of the following questions to answer as part of your initial post.
What events in John's life created a "downward spiral" into homelessness and hopelessness? Which events were related to social needs, mental health needs, and medical needs, and which could health care have addressed?
What were some of the barriers John faced in accessing medical care and mental health care?
How does homelessness and mental illness intersect? Do you believe homelessness may develop because of a mental health issue, or do you believe those who become homeless eventually sink into psychological despair?
The tipping point for many people who live at the margins of society may be things that could have been managed given the right support. How can your role as an APRN help identify, alleviate, or support those who are in need like John?
In your own experience, have you encountered a homeless individual? What was that like? Do you recall what you were thinking?
Please include at least three scholarly sources within your initial post.
Rubric:
Discussion Question Rubric
Note:
Scholarly resources are defined as evidence-based practice, peer-reviewed journals; textbook (do not rely solely on your textbook as a reference); and National Standard Guidelines. Review assignment instructions, as this will provide any additional requirements that are not specifically listed on the rubric.
Discussion Question Rubric – 100 PointsCriteriaExemplary
Exceeds ExpectationsAdvanced
Meets ExpectationsIntermediate
Needs ImprovementNovice
InadequateTotal PointsQuality of Initial PostProvides clear examples supported by course content and references.
Cites three or more references, using at least one new scholarly resource that was not provided in the course materials.
All instruction requirements noted.
40 points
Components are accurate and thoroughly represented, with explanations and application of knowledge to include evidence-based practice, ethics, theory, and/or role. Synthesizes course content using course materials and scholarly resources to support importantpoints.
Meets all requirements within the discussion instructions.
Cites two references.
35 points
Components are accurate and mostly represented primarily with definitions and summarization. Ideas may be overstated, with minimal contribution to the subject matter. Minimal application to evidence-based practice, theory, or role development. Synthesis of course content is present but missing depth and/or development.
Is missing one component/requirement of the discussion instructions.
Cites one reference, or references do not clearly support content.
Most instruction requirements are noted.
31 points
Absent application to evidence-based practice, theory, or role development. Synthesis of course content is superficial.
Demonstrates incomplete understandin.
Examine Case Study Pakistani Woman with Delusional Thought Processe.docxcravennichole326
Examine Case Study: Pakistani Woman with Delusional Thought Processes.
You will be asked to make three decisions concerning the medication to prescribe to this client. Be sure to consider factors that might impact the client’s pharmacokinetic and pharmacodynamic processes.
At each decision point stop to complete the following:
Decision #1
Which decision did you select?
Why did you select this decision? Support your response with evidence and references to the Learning Resources.
What were you hoping to achieve by making this decision? Support your response with evidence and references to the Learning Resources.
Explain any difference between what you expected to achieve with Decision #1 and the results of the decision. Why were they different?
Decision #2
Why did you select this decision? Support your response with evidence and references to the Learning Resources.
What were you hoping to achieve by making this decision? Support your response with evidence and references to the Learning Resources.
Explain any difference between what you expected to achieve with Decision #2 and the results of the decision. Why were they different?
Decision #3
Why did you select this decision? Support your response with evidence and references to the Learning Resources.
What were you hoping to achieve by making this decision? Support your response with evidence and references to the Learning Resources.
Explain any difference between what you expected to achieve with Decision #3 and the results of the decision. Why were they different?
Also include how ethical considerations might impact your treatment plan and communication with clients.
BACKGROUND
The client is a 34-year-old Pakistani female who moved to the United States in her late teens/early 20s. She is currently in an “arranged” marriage (her husband was selected for her since she was 9 years old). She presents to your office today following a 21 day hospitalization for what was diagnosed as “brief psychotic disorder.” She was given this diagnosis as her symptoms have persisted for less than 1 month.
Prior to admission, she was reporting visions of Allah, and over the course of a week, she believed that she was the prophet Mohammad. She believed that she would deliver the world from sin. Her husband became concerned about her behavior to the point that he was afraid of leaving their 4 children with her. One evening, she was “out of control” which resulted in his calling the police and her subsequent admission to an inpatient psych unit.
During today’s assessment, she appears quite calm, and insists that the entire incident was “blown out of proportion.” She denies that she believed herself to be the prophet Mohammad and states that her husband was just out to get her because he never loved her and wanted an “American wife” instead of her. She tells you that she knows this because the television is telling her so.
She currently weighs .
Examination of Modern LeadershipModule 1 Leadership History, F.docxcravennichole326
Examination of Modern Leadership
Module 1: Leadership: History, Fundamentals, and the Modern Context
Module 1 content establishes the context for the entire course dedicated to the examination of modern and postmodern leadership. The introduction of critical theory and its use in ORG561 provides a framework for investigation. The context of social, economic, political, and technological environments informs an exploration of modern and postmodern leadership approaches. Emphasis on leader self-awareness sets the stage for reflection, introspection, and personal leadership development.
Learning Outcomes
1. Compare and contrast historical leadership concepts against modern and postmodern organization needs.
2. Analyze leadership approaches using a critical framework.
3. Construct a personal leadership biography.
For Your Success & Readings
A key to success in ORG561 is to start early, build, reflect, reinforce, build, reflect, and reinforce.
Begin each week’s study by reading and comprehending the learning outcomes. Learning outcomes are always revealed in assignments, discussions, and lectures. Likewise, learning outcomes are reflected in rubrics, which are used as objective measures for scoring and grading. Establish the learning outcomes as your checklist for success.
In Module 1 criticaltheory is introduced through the readings, lecture, discussion, and Critical Thinking Assignment. The critical approach provides new frameworks on which to research leadership. You may not be familiar with critical inquiry, so seize the opportunity to advance your analytic skills. You are expected to use one or more critical frames in each module of this course. Take the time this week to fully understand the reasoning and context of critical theory.
Studying the history of leadership requires reading publications from earlier eras. Notice that some of the required and recommended readings for Module 1 are not current publications, but these contribute to understanding the earlier periods of organization and leadership study.
Postmodern leadership literature expounds on the notion that self-awareness is a critical component required to lead. In ORG561, the thread of self-examination is woven throughout the course. You will have opportunities to move beyond reflection to develop a better understanding of personal assumptions and biases, skills and competencies, and professional development plans, all related to leadership. Embrace the opportunity!
Required
· Introduction and Chapters 1 & 2 in Leadership: A Critical Text
· Axley, S. R. (1990). The practical qualities of effective leaders. Industrial Management, 32(5), 29-31.
· Brocato, B., Jelen, J., Schmidt, T., & Gold, S. (2011). Leadership conceptual ambiguities.Journal of Leadership Studies, 5(1), 35-50. doi:10.1002/jls.20203
· Gandolfi, F., & Stone, S. (2016). Clarifying leadership: High-impact leaders in a time of leadership crisis. Revista De Management Comparat International, 17(3), 212-224.
· Blom, M. .
Examine current international OB issues that challenge organizat.docxcravennichole326
Examine current international OB issues that challenge organizational leaders to resolve critical issues involving cross-cultural communication, negotiation, leadership, motivation, decision-making, among others.
(1) identify the key organizational behavior issues facing management,
(2) what impact the international environment has on these issues,
(3) strategies management should use to overcome these issues,
(4) how these strategies will impact the overall organizational operations, and
(5) identify the potential costs and risks to the organizations of implementing the newly developed strategies.
Offer a set of recommendations, which must be derived from both data and theory. Teams must include aspects of global leadership, global motivation and global team-management in their work.
APA format, Times New Roman (12), 20-25 pages, No plagiarism.
.
Executive Program Practical Connection Assignment .docxcravennichole326
Executive Program Practical Connection Assignment
Component Proficient (15 to 20 points) Competent (8 to 14 points) Novice (1 to 7 points) Score
Assignment
Requirements
Student completed all required
portions of the assignment
Completed portions of the
assignment
Did not complete the required
assignment.
Writing Skills,
Grammar, and APA
Formatting
Assignment strongly demonstrates
graduate-level proficiency in
organization, grammar, and style.
Assignment is well written, and ideas
are well developed and explained.
Demonstrates strong writing skills.
Student paid close attention to spelling
and punctuation. Sentences and
paragraphs are grammatically correct.
Proper use of APA formatting. Properly
and explicitly cited outside resources.
Reference list matches citations.
Assignment demonstrates graduate-
level proficiency in organization,
grammar, and style.
Assignment is effectively
communicated, but some sections
lacking clarity. Student paid some
attention to spelling and
punctuation, but there are errors
within the writing. Needs attention
to proper writing skills.
Use of APA formatting and citations
of outside resources, but has a few
instances in which proper citations
are missing.
Assignment does not demonstrate
graduate-level proficiency in
organization, grammar, and style.
Assignment is poorly written and
confusing. Ideas are not
communicated effectively. Student
paid no attention to spelling and
punctuation. Demonstrates poor
writing skills.
The assignment lacks the use of APA
formatting and does not provide
proper citations or includes no
citations.
Maintains
purpose/focus
Submission is well organized and has a
tight and cohesive focus that is
integrated throughout the document
Submissions has an organizational
structure and the focus is clear
throughout.
Submission lacks focus or contains
major drifts in focus
Understanding of
Course Content
Student demonstrates understand of
course content and knowledge.
Student demonstrates some
understanding of course content
and knowledge.
Student does not demonstrate
understanding of course content and
knowledge.
Work Environment
Application
Student strongly demonstrates the
practical application, or ability to apply,
of course objectives within a work
environment.
Student demonstrates some
practical application, or ability to
apply, of course objectives within a
work environment.
Student does not demonstrate the
practical application, or ability to
apply, of course objectives within a
work environment.
Executive Program Practical Connection Assignment
At UC, it is a priority that students are provided with strong educational programs and courses that
allow them to be servant-leaders in their disciplines and communities, linking research with practice and
kn.
Executive Program Practical Connection Assignment Component .docxcravennichole326
Executive Program Practical Connection Assignment
Component
Proficient (15 to 20 points)
Competent (8 to 14 points)
Novice (1 to 7 points)
Score
Assignment Requirements
Student completed all required portions of the assignment
Completed portions of the assignment
Did not complete the required assignment.
Writing Skills, Grammar, and APA Formatting
Assignment strongly demonstrates graduate-level proficiency in organization, grammar, and style.
Assignment is well written, and ideas are well developed and explained. Demonstrates strong writing skills. Student paid close attention to spelling and punctuation. Sentences and paragraphs are grammatically correct.
Proper use of APA formatting. Properly and explicitly cited outside resources. Reference list matches citations.
Assignment demonstrates graduate-level proficiency in organization, grammar, and style.
Assignment is effectively communicated, but some sections lacking clarity. Student paid some attention to spelling and punctuation, but there are errors within the writing. Needs attention to proper writing skills.
Use of APA formatting and citations of outside resources, but has a few instances in which proper citations are missing.
Assignment does not demonstrate graduate-level proficiency in organization, grammar, and style.
Assignment is poorly written and confusing. Ideas are not communicated effectively. Student paid no attention to spelling and punctuation. Demonstrates poor writing skills.
The assignment lacks the use of APA formatting and does not provide proper citations or includes no citations.
Maintains purpose/focus
Submission is well organized and has a tight and cohesive focus that is integrated throughout the document
Submissions has an organizational structure and the focus is clear throughout.
Submission lacks focus or contains major drifts in focus
Understanding of Course Content
Student demonstrates understand of course content and knowledge.
Student demonstrates some understanding of course content and knowledge.
Student does not demonstrate understanding of course content and knowledge.
Work Environment Application
Student strongly demonstrates the practical application, or ability to apply, of course objectives within a work environment.
Student demonstrates some practical application, or ability to apply, of course objectives within a work environment.
Student does not demonstrate the practical application, or ability to apply, of course objectives within a work environment.
.
Executive Program Group Project Assignment Component Profi.docxcravennichole326
Executive Program Group Project Assignment
Component
Proficient (15 to 20 points)
Competent (8 to 14 points)
Novice (1 to 7 points)
Score
Assignment Requirements
Student completed all required portions of the assignment
Completed portions of the assignment
Did not complete the required assignment.
Writing Skills, Grammar, and APA Formatting
Assignment strongly demonstrates graduate-level proficiency in organization, grammar, and style.
Assignment is well written, and ideas are well developed and explained. Demonstrates strong writing skills. Student paid close attention to spelling and punctuation. Sentences and paragraphs are grammatically correct.
Proper use of APA formatting. Properly and explicitly cited outside resources. Reference list matches citations.
Assignment demonstrates graduate-level proficiency in organization, grammar, and style.
Assignment is effectively communicated, but some sections lacking clarity. Student paid some attention to spelling and punctuation, but there are errors within the writing. Needs attention to proper writing skills.
Use of APA formatting and citations of outside resources, but has a few instances in which proper citations are missing.
Assignment does not demonstrate graduate-level proficiency in organization, grammar, and style.
Assignment is poorly written and confusing. Ideas are not communicated effectively. Student paid no attention to spelling and punctuation. Demonstrates poor writing skills.
The assignment lacks the use of APA formatting and does not provide proper citations or includes no citations.
Maintains purpose/focus
Submission is well organized and has a tight and cohesive focus that is integrated throughout the document
Submissions has an organizational structure and the focus is clear throughout.
Submission lacks focus or contains major drifts in focus
Understanding of Course Content
Student demonstrates understand of course content and knowledge.
Student demonstrates some understanding of course content and knowledge.
Student does not demonstrate understanding of course content and knowledge.
Work Environment Application
Student strongly demonstrates the practical application, or ability to apply, of course objectives within a work environment.
Student demonstrates some practical application, or ability to apply, of course objectives within a work environment.
Student does not demonstrate the practical application, or ability to apply, of course objectives within a work environment.
Criteria Excellent Satisfactory Less than Satisfactory Not Completed
Log
Completion
4 points
Food logs are
complete with detailed
food/beverage items
3 points
Food logs are
complete but lack
some detail on
food/beverage items
(3 pts)
2 points
Food logs are
complete are missing
substantial detail on
food/beverage items
0 points
Student did not
complete this
component of the
project.
/ 4
Por.
Executive Practical Connection Activityit is a priority that stu.docxcravennichole326
Executive Practical Connection Activity
it is a priority that students are provided with strong educational programs and courses that allow them to be servant-leaders in their disciplines and communities, linking research with practice and knowledge with ethical decision-making. This assignment is a written assignment where students will demonstrate how this course research has connected and put into practice within their own career.
Assignment:
Provide a reflection of at least 500 words (or 2 pages double spaced) of how the knowledge, skills, or theories of this course have been applied, or could be applied, in a practical manner to your current work environment. If you are not currently working, share times when you have or could observe these theories and knowledge could be applied to an employment opportunity in your field of study.
Requirements:
· Provide a 500 word (or 2 pages double spaced) minimum reflection.
· Use of proper APA formatting and citations. If supporting evidence from outside resources is used those must be properly cited.
· Share a personal connection that identifies specific knowledge and theories from this course.
· Demonstrate a connection to your current work environment. If you are not employed, demonstrate a connection to your desired work environment.
· You should NOT, provide an overview of the assignments assigned in the course. The assignment asks that you reflect how the knowledge and skills obtained through meeting course objectives were applied or could be applied in the workplace.
MY ROLE: BIGDATA/KAFKA ADMIN
Need Plagiarism report for this Assignement.
****Directions
Choose from one of the following tweets and answer the 4 questions, Include at least one scholarly source***** The link is included in each tweet for more information.
1. Identify a healthcare issue within your community and explain the issue to your class colleagues. (You may use the same issue you identified in Week 2, but please expand your responses to address this week's focus).
2. Describe the type of healthcare policy you would advocate for in an effort to change this issue.
3. What type of campaign would you need to launch in order to gather a network of support?
4. Compose a Tweet that describes what you have shared with your class colleagues. Remember, Twitter only allows for 140 characters so you will need to be concise.
1. NR708HealthPol Retweeted
Tara Heagele, PhD, RN, PCCN, EMT@TaraHeagele
#NurseTwitter Hurricane season starts today! Helping Vulnerable People Before Disasters Strike | Campaign for Action https://campaignforaction.org/helping-vulnerable-people-before-disasters-strike/#.XtUB00-UAZ4.twitter …
Helping Vulnerable People Before Disasters Strike | Campaign for Action
Floods, tornadoes, heat waves, blizzards, earthquakes, and hurricanes threaten the health and well-being of millions of people each year
campaignforaction.org
13h
·
·
2. NR708HealthPol Retweeted
Diana Mason@djmasonrn
By @AmyAnderso.
Executive FunctionThe Search for an Integrated AccountMari.docxcravennichole326
Executive Function
The Search for an Integrated Account
Marie T. Banich
Department of Psychology & Neuroscience, and Institute of Cognitive Science, University of Colorado at Boulder;
Department of Psychiatry, University of Colorado Denver
ABSTRACT—In general, executive function can be thought
of as the set of abilities required to effortfully guide be-
havior toward a goal, especially in nonroutine situations.
Psychologists are interested in expanding the under-
standing of executive function because it is thought to be a
key process in intelligent behavior, it is compromised in a
variety of psychiatric and neurological disorders, it varies
across the life span, and it affects performance in compli-
cated environments, such as the cockpits of advanced
aircraft. This article provides a brief introduction to the
concept of executive function and discusses how it is
assessed and the conditions under which it is compromised.
A short overview of the diverse theoretical viewpoints re-
garding its psychological and biological underpinnings is
also provided. The article concludes with a consideration
of how a multilevel approach may provide a more inte-
grated account of executive function than has been previ-
ously available.
KEYWORDS—executive function; frontal lobe; prefrontal
cortex; inhibition; task switching; working memory; atten-
tion; top-down control
Like other psychological constructs, such as memory, executive
function is multidimensional. As such, there exists a variety of
models that provide varying viewpoints as to its basic component
processes. Nonetheless, common across most of them is the idea
that executive function is a process used to effortfully guide
behavior toward a goal, especially in nonroutine situations.
Various functions or abilities are thought to fall under the rubric
of executive function. These include prioritizing and sequencing
behavior, inhibiting familiar or stereotyped behaviors, creating
and maintaining an idea of what task or information is most
relevant for current purposes (often referred to as an attentional
or mental set), providing resistance to information that is dis-
tracting or task irrelevant, switching between task goals, uti-
lizing relevant information in support of decision making,
categorizing or otherwise abstracting common elements across
items, and handling novel information or situations. As can be
seen from this list, the functions that fall under the category of
executive function are indeed wide ranging.
ASSESSING EXECUTIVE FUNCTION
The very nature of executive function makes it difficult to
measure in the clinic or the laboratory; it involves an individual
guiding his or her behavior, especially in novel, unstructured,
and nonroutine situations that require some degree of judgment.
In contrast, standard testing situations are structured—partic-
ipants are explicitly told what the task is, given rules for per-
forming the task, and provide.
Executive Compensation and IncentivesMartin J. ConyonEx.docxcravennichole326
Executive Compensation and Incentives
Martin J. Conyon*
Executive Overview
The objective of a properly designed executive compensation package is to attract, retain, and motivate
CEOs and senior management. The standard economic approach for understanding executive pay is the
principal-agent model. This paper documents the changes in executive pay and incentives in U.S. firms
between 1993 and 2003. We consider reasons for these transformations, including agency theory, changes
in the managerial labor markets, shifts in firm strategy, and theories concerning managerial power. We show that
boards and compensation committees have become more independent over time. In addition, we demonstrate
that compensation committees containing affiliated directors do not set greater pay or fewer incentives.
Introduction
E
xecutive compensation is a complex and con-
troversial subject. For many years, academics,
policymakers, and the media have drawn atten-
tion to the high levels of pay awarded to U.S.
chief executive officers (CEOs), questioning
whether they are consistent with shareholder in-
terests.1 Some academics have further argued that
flaws in CEO pay arrangements and deviations
from shareholders’ interests are widespread and
considerable.2 For example, Lucian Bebchuk and
Jesse Fried provide a lucid account of the mana-
gerial power view and accompanying evidence.3
Marianne Bertrand and Sendhil Mullainathan too
provide an analysis of the ‘skimming view’ of CEO
pay.4 In contrast, John Core et al. present an
economic contracting approach to executive pay
and incentives, assessing whether CEOs receive
inefficient pay without performance.5 In this pa-
per, we show what has happened to CEO pay in
the United States. We do not claim to distinguish
between the contracting and managerial power
views of executive pay. Instead, we document the
pattern of executive pay and incentives in the
United States, investigating whether this pattern
is consistent with economic theory.
The Context: Who Sets Executive Pay?
B
efore examining the empirical evidence pre-
sented in this paper, it is important to consider
the pay-setting process and who sets executive
pay. The standard economic theory of executive
compensation is the principal-agent model.6 The
theory maintains that firms seek to design the most
efficient compensation packages possible in order to
attract, retain, and motivate CEOs, executives, and
managers.7 In the agency model, shareholders set
pay. In practice, however, the compensation com-
mittee of the board determines pay on behalf of
shareholders. A principal (shareholder) designs a
contract and makes an offer to an agent (CEO/
manager). Executive compensation ameliorates a
moral hazard problem (i.e., manager opportunism)
arising from low firm ownership. By using stock
options, restricted stock, and long-term contracts,
shareholders motivate the CEO to maximize firm
value. In other words, shareholders try to design
optimal compensation packages .
Executing the StrategyLearning ObjectivesAfter reading.docxcravennichole326
Executing the Strategy
Learning Objectives
After reading this chapter, you should be able to:
• Distinguish good operational plans from weak ones.
• Detail the value of tracking progress on all operational plans.
• Discuss why emergent strategies occur and how they might affect an organization’s
current strategy.
• Implement the ten basic steps of a generic strategic formulation process.
• Manage, improve, and evaluate an existing strategic management process.
Chapter 9
Neil Webb/Ikon Images/Getty Images
spa81202_09_c09.indd 247 1/16/14 10:08 AM
CHAPTER 9Section 9.1 Managing Operational Plans
Implementing a strategy (see Figure 1.1) in the real world is not a leisurely swim across
a calm pond on a sunny day, but rather like crossing from one bank of a raging river to
the other, encountering hidden eddies, fog, driving rain, lightning, and riptides along the
way. While it is not impossible to reach the other bank (the goal), the task often becomes
one of overcoming obstacles and making constant adjustments without losing sight of the
goal. Implementation is like that. Even the most brilliant strategy is worthless if it cannot
be implemented.
This chapter focuses on strategy execution and its difficulties. Part of the chapter is devoted
to assessing, improving, and managing the strategy formulation process itself.
9.1 Managing Operational Plans
The process for obtaining board approval of operational plans is covered in this chapter.
Exactly what is it that gets approved? An operational plan is a document that specifies the
projects or tasks that must be accomplished to achieve particular operational objectives.
Many of these plans will contain activities that are ongoing. Some will include plans for
enhanced or new services. Details specified in operational plans include the names of those
who will be involved and the indi-
vidual responsible for each one, what
equipment will be needed, when each
will start and end, and the estimated
costs for each activity. Given the level
of detail required, it should come as
no surprise that an operational plan
for a large functional unit, such as the
nursing department in a hospital, can
run to many pages, as there are lots of
activities to be detailed. Operational
plans for small HSOs such as physi-
cian clinics and community health
centers may be just a few pages long
unless new strategic initiatives are to
be undertaken.
It takes contributions from everyone
who will be involved in that HSO’s
operations to create such plans. They
will make sure that continuing cur-
rent operations are included in the plans, which is easily done. What adds a level of com-
plexity and difficulty is incorporating additional tasks demanded by a change in strategy.
Consider the following scenarios, which illustrate the difficulty in creating operational
plans that involve more than simply repeating what was done the previous year:
Javier Larrea/age fotostock/Getty Ima.
Executing Strategies in a Global Environment Examining the Case of .docxcravennichole326
Executing Strategies in a Global Environment: Examining the Case of Federal Express 5-7 pages
Requirements:
1.
An
al
yz
e
Fe
d
era
l
E
x
pre
ss
’
s
v
a
lu
e
cr
e
atio
n
f
r
ont
i
e
r
,
a
n
d
deter
m
in
e
w
h
i
ch
o
f
th
e
f
ou
r
bu
i
l
d
i
ngb
l
oc
k
s
o
f
c
o
m
pet
i
t
i
v
e
a
d
v
a
nta
g
e
t
h
e
co
m
pa
n
y
n
eed
s
i
n
orde
r
t
o
con
t
i
n
u
e
t
o
m
a
i
n
t
a
i
n
a
b
o
v
e-a
v
er
a
g
e
pro
f
ita
b
i
l
i
t
y
.
Provi
d
ea
ra
ti
o
n
aletosup
p
orttheresponse.
2.
Deter
m
i
n
e
th
e
m
a
i
n
aspe
ct
o
f
produc
t
d
i
ff
erent
i
atio
n
a
n
d
capac
i
t
y
c
o
ntr
o
l
t
h
a
t
Fe
d
era
l
E
x
pre
s
s
c
oul
d
us
e
i
n
or
d
e
r
t
o
m
a
i
n
t
a
i
n
a
n
ed
g
eo
v
e
r
i
tsr
i
v
a
l
s
.J
u
st
i
f
y
t
h
er
e
sp
on
se.
3.
A
ss
es
s
th
e
e
f
f
i
c
i
en
c
y
o
f
Federa
l
E
x
pre
ss
’
s
c
ur
r
en
t
bu
s
i
ne
ss
m
odel
,
a
n
d
reco
m
m
en
d
o
n
e
(1
)
ne
w
bu
s
i
n
es
s
-leve
l
stra
t
e
g
y
t
h
a
t
gi
v
e
s
t
h
e
co
m
pa
n
ya
co
m
p
et
i
t
i
ve
a
dvant
a
g
e
ove
r
it
s
r
i
v
a
l
s.
P
r
o
v
i
d
earat
i
o
n
ale
f
o
rthereco
m
m
enda
ti
on.
4.
E
x
a
m
in
e
th
e
m
anne
r
i
n
wh
i
c
h
overa
l
l
g
l
o
b
a
l
co
m
pet
i
t
i
o
n
m
a
y
i
m
pa
ct
th
e
n
e
w
bu
s
i
ne
ss
strate
g
y
tha
t
y
o
u
re
c
o
m
m
ende
d
i
n
Que
s
t
i
o
n
3
.
Next
,
su
g
ge
st
on
e
(1
)
si
g
n
i
f
i
c
an
t
w
a
y
t
ha
t
Feder
a
l
E
x
pre
s
s
m
a
y
c
on
f
r
on
t
i
ts
g
l
ob
a
lc
o
m
pet
it
i
o
n
.
Acetabularia Information For Class 9 .docxvaibhavrinwa19
Acetabularia acetabulum is a single-celled green alga that in its vegetative state is morphologically differentiated into a basal rhizoid and an axially elongated stalk, which bears whorls of branching hairs. The single diploid nucleus resides in the rhizoid.
Macroeconomics- Movie Location
This will be used as part of your Personal Professional Portfolio once graded.
Objective:
Prepare a presentation or a paper using research, basic comparative analysis, data organization and application of economic information. You will make an informed assessment of an economic climate outside of the United States to accomplish an entertainment industry objective.
How to Make a Field invisible in Odoo 17Celine George
It is possible to hide or invisible some fields in odoo. Commonly using “invisible” attribute in the field definition to invisible the fields. This slide will show how to make a field invisible in odoo 17.
Introduction to AI for Nonprofits with Tapp NetworkTechSoup
Dive into the world of AI! Experts Jon Hill and Tareq Monaur will guide you through AI's role in enhancing nonprofit websites and basic marketing strategies, making it easy to understand and apply.
Read| The latest issue of The Challenger is here! We are thrilled to announce that our school paper has qualified for the NATIONAL SCHOOLS PRESS CONFERENCE (NSPC) 2024. Thank you for your unwavering support and trust. Dive into the stories that made us stand out!
Francesca Gottschalk - How can education support child empowerment.pptxEduSkills OECD
Francesca Gottschalk from the OECD’s Centre for Educational Research and Innovation presents at the Ask an Expert Webinar: How can education support child empowerment?
Unit 8 - Information and Communication Technology (Paper I).pdfThiyagu K
This slides describes the basic concepts of ICT, basics of Email, Emerging Technology and Digital Initiatives in Education. This presentations aligns with the UGC Paper I syllabus.
Unit 8 - Information and Communication Technology (Paper I).pdf
Census 2000 showedthat the United Statespopulation was 281.docx
1. Census 2000 showed
that the United States
population was 281.4
million on April 1,
2000. Of the total, 4.1
million, or 1.5 percent,
reported1 American
Indian and Alaska
Native. This number
included 2.5 million
people, or 0.9 percent,
who reported only
American Indian and
Alaska Native in addi-
tion to 1.6 million peo-
ple, or 0.6 percent,
who reported American
Indian and Alaska
Native as well as one
or more other races.
The term American
Indian is often used in the text of this
report to refer to the American Indian and
Alaska Native population, while American
Indian and Alaska Native is used in the
text tables and graphs. Census 2000
asked separate questions on race and
Hispanic or Latino origin. Hispanics who
reported their race as American Indian
and Alaska Native, either alone or in com-
bination with one or more races, are
included in the number of American
2. Indians.
This report, part of a series that analyzes
population and housing data collected
from Census 2000, provides a portrait of
the American Indian population in the
United States and discusses its distribution
at both the national and subnational levels.
It begins by discussing the characteristics
of the total American Indian population and
then focuses on selected tribal groupings,2
for example, Navajo, Cherokee, or Eskimo.
The report is based on data from the
Census 2000 Summary File 1.3 The text of
this report discusses data for the United
States, including the 50 states and the
District of Columbia.4
U S C E N S U S B U R E A U
Helping You Make Informed Decisions
U.S. Department of Commerce
Economics and Statistics Administration
U.S. CENSUS BUREAU
Issued February 2002
C2KBR/01-15
The American Indian and Alaska
Native Population: 2000
Census 2000 Brief
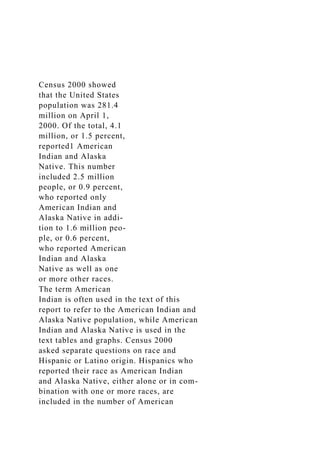
3. By
Stella U. OgunwoleFigure 1.
Reproduction of the Question on Race
From Census 2000
Source: U.S. Census Bureau, Census 2000 questionnaire.
What is this person's race? Mark one or more races to
indicate what this person considers himself/herself to be.
6.
White
Black, African Am., or Negro
American Indian or Alaska Native — Print name of enrolled or
principal tribe.
Some other race — Print race.
Japanese
Korean
Vietnamese
Native Hawaiian
Guamanian or Chamorro
Samoan
Other Pacific Islander — Print race.
Asian Indian
Chinese
Filipino
Other Asian — Print race.
✗
4. 1 In this report, the term “reported” is used to refer
to the answers provided by respondents, as well as
responses assigned during the editing and imputation
processes.
2 Tribal grouping refers to the combining of individ-
ual American Indian tribes, such as Alamo Navajo,
Tohajiileehee Navajo, and Ramah Navajo into the general
Navajo tribe, or the combining of individual Alaska
Native tribes such as American Eskimo, Eskimo and
Greenland Eskimo into the general Eskimo tribe.
3 Data from the Census 2000 Summary File 1 were
released on a state-by-state basis during the summer of
2001.
4 Data for the Commonwealth of Puerto Rico are
shown in Table 2 and Figure 3.
2 U.S. Census Bureau
The term “American Indian and
Alaska Native” refers to people hav-
ing origins in any of the original peo-
ples of North and South America
(including Central America), and who
maintain tribal affiliation or commu-
nity attachment. It includes people
who reported “American Indian and
Alaska Native” or wrote in their prin-
cipal or enrolled tribe.
Data on race have been collected
since the first U.S. decennial census in
5. 1790. American Indians were first
enumerated as a separate group in
the 1860 census. The 1890 census
was the first to count American
Indians throughout the country. Prior
to 1890, enumeration of American
Indians was limited to those living in
the general population of the various
states; American Indians in American
Indian Territory and on American
Indian reservations were not included.
Alaska Natives, in Alaska, have been
counted since 1880, but until 1940,
they were generally reported in the
“American Indian” racial category.
They were enumerated separately
(as Eskimo and Aleut) in 1940 in
Alaska. In the 1970 census, sepa-
rate response categories were used
to collect data on the Eskimo and
Aleut population only in Alaska.
The 1980 census was the first in
which data were collected separately
for Eskimos and Aleuts in all states.
The 1990 census used three sepa-
rate response categories to collect
data on the American Indian and
Alaska Native population.
Census 2000 used a combined
“American Indian or Alaska Native”
response category to collect data on
both the American Indian and Alaska
Native population. Also, respondents
6. were asked to provide the name of
their enrolled or principal tribes.
Previous decennial censuses collect-
ed data on both American Indian and
Alaska Native tribes. However,
Census 2000 provides more exten-
sive data for tribes than ever before.
The question on race was
changed for Census 2000.
All U.S. censuses have obtained
information on race for every indi-
vidual and for the past several cen-
suses, the responses reflect self-
identification. For Census 2000,
however, respondents were asked to
report one or more races they con-
sidered themselves and other mem-
bers of their households to be.5
Because of these changes, the
Census 2000 data on race are not
directly comparable with data from
the 1990 census or earlier census-
es. Caution must be used when
interpreting changes in the racial
composition of the United States
population over time.
The Census 2000 question on race
included 15 separate response cate-
gories and 3 areas where respon-
dents could write in a more specific
race (see Figure 1). For some pur-
7. poses, including this report, the
response categories and write-in
answers were combined to create
the five standard Office of
Management and Budget race cate-
gories, plus the Census Bureau cate-
gory of “Some other race.” The six
race categories include:
• White;
• Black or African American;
• American Indian and Alaska
Native;
• Asian;
• Native Hawaiian and Other
Pacific Islander; and
• Some other race
For a complete explanation of the
race categories used in Census
2000, see the Census 2000 Brief,
Overview of Race and Hispanic
Origin.6
The data collected by Census
2000 on race can be divided
into two broad categories: the
race alone population and the
race in combination population.
People who responded to the ques-
8. tion on race by indicating only one
race are referred to as the race
alone population. For example,
respondents who reported their
race only as American Indian or
Alaska Native on the census ques-
tionnaire would be included in the
American Indian alone population.
Individuals who reported more than
one of the six races are referred to
as the race in combination popula-
tion. For example, respondents who
reported they were “American
Indian and White” or “American
Indian and Black or African
American and Asian”7 would be
included in the American Indian in
combination population.
5 Other changes included terminology
and formatting changes, such as spelling out
“American” instead of “Amer.” for the
American Indian or Alaska Native category
and adding “Native” to the Hawaiian
response category. In the layout of the
Census 2000 questionnaire, the seven Asian
response categories were alphabetized and
grouped together, as were the four Pacific
Islander categories after the Native Hawaiian
category. The three separate American
Indian and Alaska Native identifiers in the
1990 census (i.e., Indian (Amer.), Eskimo,
and Aleut) were combined into a single iden-
tifier in Census 2000. Also, American
Indians and Alaska Natives could report
9. more than one tribe.
6 Overview of Race and Hispanic Origin:
2000, U.S. Census Bureau, Census 2000
Brief, C2KBR/01-1, March 2001, is available
on the U.S. Census Bureau’s Internet site at
www.census.gov/population/www/cen2000/
briefs.html.
7 The race in combination categories are
denoted by quotations around the combina-
tions with the conjunction and in bold and
italicized print to indicate the separate races
that comprise the combination.
The maximum number of
people reporting American
Indian is reflected in the
American Indian alone or in
combination population.
One way to define the American
Indian population is to combine
those respondents who reported
only American Indian with those
who reported American Indian as
well as one or more other races.
This creates the American Indian
alone or in combination popula-
tion. Another way to think of the
American Indian alone or in combi-
nation population is the total num-
ber of people who identified entire-
ly or partially as American Indian.
10. This group is also described as
people who reported American
Indian, whether or not they report-
ed any other races.
Census 2000 provides a
snapshot of the American
Indian population.
Table 1 shows the number and per-
centage of Census 2000 respon-
dents who reported American
Indian alone as well as those who
reported American Indian and at
least one other race.
Of the total United States popula-
tion, 2.5 million people, or 0.9 per-
cent, reported only American
Indian. An additional 1.6 million
people reported American Indian
and at least one other race. Within
this group, the most common com-
binations were “American Indian
and Alaska Native and White”
(66 percent), followed by
“American Indian and Alaska Native
and Black or African American”
(11 percent), “American Indian and
Alaska Native and White and Black
or African American” (6.8 percent),
and “American Indian and Alaska
Native and Some other race”
(5.7 percent). These four combina-
tion categories accounted for
11. 90 percent of all American Indians
who reported two or more races.
Thus 4.1 million people, or
1.5 percent, of the total popula-
tion, reported American Indian
alone or in combination with one
or more races.
The American Indian
population increased faster
than the total population
between 1990 and 2000.
Because of the changes made to the
question on race for Census 2000,
there are at least two ways to pres-
ent the change in the total number
of American Indians in the United
States. They include: 1) the differ-
ence in the American Indian popula-
tion between 1990 and 2000 using
the race alone concept for 2000
and 2) the difference in the
American Indian population
between 1990 and 2000 using the
race alone or in combination con-
cept for 2000. These comparisons
provide a “minimum-maximum”
range for the change in the
American Indian population
between 1990 and 2000.
The 1990 census showed there
were nearly 2 million American
Indians. Using the American Indian
alone population in 2000, this pop-
12. ulation increased by 516,722, or 26
percent, between 1990 and 2000.
If the American Indian alone or in
combination population is used, an
increase of 2.2 million, or 110 per-
cent, results. Thus, from 1990 to
2000, the range for the increase in
the American Indian population was
26 percent to 110 percent. In com-
parison, the total population grew
by 13 percent from 248.7 million in
1990 to 281.4 million in 2000.
THE GEOGRAPHIC
DISTRIBUTION OF THE
AMERICAN INDIAN
POPULATION
The following discussion of the geo-
graphic distribution of the American
Indian population focuses on the
American Indian alone or in combi-
nation population in the text. As the
upper bound of the American Indian
population, this group includes all
respondents who reported
American Indian, whether or not
U.S. Census Bureau 3
Table 1.
American Indian and Alaska Native Population: 2000
(For information on confidentiality protection, nonsampling
error, and definitions, see
www.census.gov/prod/cen2000/doc/sf1.pdf)
13. Race
Number
Percent of
total
population
Total population . . . . . . . . . . . . . . . . . . . . . . . . . . . . . . . . . . .
. . . . . 281,412,906 100.0
American Indian and Alaska Native alone or in combination
with
one or more other races . . . . . . . . . . . . . . . . . . . . . . . . . . . . . .
. . . . . 4,119,301 1.5
American Indian and Alaska Native alone . . . . . . . . . . . . . . . .
. . . 2,475,956 0.9
American Indian and Alaska Native in combination with one or
more other races. . . . . . . . . . . . . . . . . . . . . . . . . . . . . . . . . . .
. . . . . 1,643,345 0.6
American Indian and Alaska Native; White . . . . . . . . . . . . . . .
. . 1,082,683 0.4
American Indian and Alaska Native; Black or African
American . . . . . . . . . . . . . . . . . . . . . . . . . . . . . . . . . . . . . . . .
. . . . . 182,494 0.1
American Indian and Alaska Native; White; Black or African
American . . . . . . . . . . . . . . . . . . . . . . . . . . . . . . . . . . . . . . . .
. . . . . 112,207 -
American Indian and Alaska Native; Some other race . . . . . . .
93,842 -
All other combinations including American Indian and Alaska
Native . . . . . . . . . . . . . . . . . . . . . . . . . . . . . . . . . . . . . . . . . .
. . . . . . 172,119 0.1
Not American Indian and Alaska Native alone or in combination
14. with one or more other races . . . . . . . . . . . . . . . . . . . . . . . . . .
. . . . . 277,293,605 98.5
- Percentage rounds to 0.0.
Source: U.S. Census Bureau, Census 2000 Summary File 1.
they reported any other race.8
Hereafter in the text of this section,
the term “American Indian” will be
used to refer to those who reported
American Indian, whether they
reported one race or more than one
race. However, in the tables and
graphs, data for both the American
Indian alone and American Indian
alone or in combination populations
are shown.
Four out of ten American
Indians lived in the West.9
According to Census 2000, of all
respondents who reported
American Indian, 43 percent lived in
the West, 31 percent lived in the
South, 17 percent lived in the
Midwest, and 9 percent lived in the
Northeast (see Figure 2).
The West had the largest American
Indian population, as well as the
highest proportion of American
15. Indians in its total population:
2.8 percent of all respondents in
the West and 1.3 percent in the
South reported American Indian and
Alaska Native, compared with
1.1 percent in the Midwest, and
0.7 percent in the Northeast.
Over half of all people who
reported American Indian
lived in just ten states.
The ten states with the largest
American Indian populations in
2000, in order, were California,
Oklahoma, Arizona, Texas, New
Mexico, New York, Washington,
North Carolina, Michigan, and
Alaska (see Table 2). Florida was the
only other state with greater than
100,000 American Indian popula-
tion. Combined, these 11 states
included 62 percent of the total
American Indian population, but
only 44 percent of the total popula-
tion. California (627,562) and
Oklahoma (391,949) combined
included about 25 percent of the
total American Indian population.
There were 19 states where the
American Indian population exceed-
ed the U.S. proportion of 1.5 per-
cent, led by the western state of
Alaska (19 percent), followed by the
southern state of Oklahoma
16. (11 percent), and the western state
of New Mexico (10 percent). The
other 16 states included the west-
ern states of Arizona, California,
Colorado, Idaho, Montana, Nevada,
Hawaii, Oregon, Utah, Washington,
and Wyoming; the midwestern
states of Kansas, Minnesota, North
Dakota, and South Dakota; and the
southern state of North Carolina.
No northeastern state had more
than 1.5 percent of its population
reporting as American Indian. Five
states, Alaska, Oklahoma, New
Mexico, Arizona, and Washington
were represented in the top ten
states in both number and percent
reporting as American Indian.
American Indians were less than
1 percent of the total population in
21 states including Pennsylvania,
New Jersey, West Virginia, Illinois,
Massachusetts, Kentucky, Iowa,
New Hampshire, Indiana, Georgia,
Ohio, South Carolina, Mississippi,
Tennessee, Connecticut, Florida,
Maryland, Virginia, Delaware, New
York, and the District of Columbia,
a state equivalent. While Texas had
the fourth largest American Indian
population of all states, it ranked
26th in percent of American Indian
among the 50 states and the
District of Columbia, with only
17. 1 percent of respondents reporting
American Indian. Wyoming had the
44th largest American Indian popu-
lation, but ranked 8th in percent of
the American Indian population
among the 50 states and the
District of Columbia.
The American Indian
population was concentrated
in counties in the West and
Midwest.
American Indians were the majority
of the population in 14 counties in
the West and 12 counties in the
Midwest (see Figure 3). In the West,
the counties were in four states:
Alaska, Arizona, Montana, and Utah.
In the Midwest, the counties were
also in four states: South Dakota,
Wisconsin, North Dakota, and
Nebraska.
Of the 3,141 counties or county
equivalents in the United States,
786 counties met or exceeded the
U.S. level of 1.5 percent of the total
American Indian population, while
the proportion reporting American
Indian was below the national aver-
age in 2,355 counties.
The counties with their proportion
reporting American Indian above the
national average were located mostly
18. west of the Mississippi River. Within
this area, several clusters of counties
with high percentages of American
Indians were distinctly noticeable.
Alaska Natives accounted for over
50 percent of the population in near-
ly all of the boroughs and census
areas (county equivalents) in north-
ern and western Alaska. In the
Southwest, American Indians were
represented in high percentages (and
4 U.S. Census Bureau
8 The use of the alone or in combination
population in this section does not imply
that it is the preferred method of presenting
or analyzing data. In general, either the
alone population or the alone or in combina-
tion population can be used, depending on
the purpose of the analysis. The Census
Bureau uses both approaches.
9 The West region includes the states of
Alaska, Arizona, California, Colorado, Hawaii,
Idaho, Montana, Nevada, New Mexico,
Oregon, Utah, Washington, and Wyoming.
The South region includes the states of
Alabama, Arkansas, Delaware, Florida,
Georgia, Kentucky, Louisiana, Maryland,
Mississippi, North Carolina, Oklahoma, South
Carolina, Tennessee, Texas, Virginia, West
Virginia, and the District of Columbia, a state
equivalent. The Midwest region includes the
states of Illinois, Indiana, Iowa, Kansas,
Michigan, Minnesota, Missouri, Nebraska,
19. North Dakota, Ohio, South Dakota, and
Wisconsin. The Northeast region includes the
states of Connecticut, Maine, Massachusetts,
New Hampshire, New Jersey, New York,
Pennsylvania, Rhode Island, and Vermont.
Table 2.
American Indian and Alaska Native Population for the United
States, Regions, and States,
and for Puerto Rico: 1990 and 2000
(For information on confidentiality protection, nonsampling
error, and definitions, see
www.census.gov/prod/cen2000/doc/sf1.pdf)
Area
1990 2000
Total
population
American Indian and Alaska
Native population
Total
population
American Indian and
Alaska Native alone
population
American Indian and
Alaska Native alone or
20. in combination
population
American Indian and
Alaska Native in
combination population
Number
Percent of
total
population Number
Percent of
total
population Number
Percent of total
population Number
Percent of
American
Indian and
Alaska Native
alone or in
combination
population
United States . . . . . . . . . . 248,709,873 1,959,234 0.8
24. 93,301 1.6 158,940 2.7 65,639 41.3
West Virginia . . . . . . . . . 1,793,477 2,458 0.1 1,808,344 3,606
0.2 10,644 0.6 7,038 66.1
Wisconsin . . . . . . . . . . . 4,891,769 39,387 0.8 5,363,675
47,228 0.9 69,386 1.3 22,158 31.9
Wyoming . . . . . . . . . . . . 453,588 9,479 2.1 493,782 11,133 2.3
15,012 3.0 3,879 25.8
Puerto Rico . . . . . . . . . . . 3,522,037 (X) (X) 3,808,610 13,336
0.4 26,871 0.7 13,535 50.4
X Not applicable.
Source: U.S. Census Bureau, Census 2000 Summary File 1;
1990 Census of Population, General Population Characteristics
(1990 CP-1).
U.S. Census Bureau 5
6 U.S. Census Bureau
also in large numbers) in the coun-
ties in the Four Corners area of
Arizona, New Mexico, Utah, and
Colorado (where the boundaries of
these four states meet). In the Great
Plains, American Indians were con-
centrated in a cluster of counties in
central and western South Dakota,
southeastern Montana, and in sever-
al counties along the U.S.-Canadian
border in Montana and North
Dakota. In the southern Plains,
American Indians accounted for rela-
tively high percentages of the popu-
25. lation in a cluster of counties in east-
ern Oklahoma. American Indians
accounted for more than the U.S.
level of 1.5 percent in all but one
county (Harper County) in
Oklahoma.
East of the Mississippi, counties in
which American Indians were repre-
sented in percentages higher than
the U.S. level of 1.5 percent were
scattered throughout the South,
Northeast, and upper Midwest. Two
clusters of counties in North
Carolina — one in the extreme
southwest of the state and the
other in the southeast — were evi-
dent; each cluster was anchored by
a county in which American Indians
accounted for over 25 percent of
the population. Elsewhere in the
South, groups of counties in which
American Indians were represented
at greater than the U.S. proportion
were found in central Louisiana,
portions of the Gulf Coast, northern
Alabama, and in eastern Virginia.
In the Northeast, counties meeting
or exceeding the national proportion
of American Indians tended to be
nonmetropolitan and along the U.S.
and Canadian border of New York,
Vermont, and Maine, although con-
centrations were found in the New
York city area, metropolitan Rhode
26. Island and Connecticut, and in west-
ern New York. In the Midwest, coun-
ties with high percentages of
American Indians were located
primarily across northern Minnesota,
Wisconsin, and Michigan. In general,
counties throughout most of the
lower Midwest, upper South, and
Northeast were distinguished by
very low percentages of American
Indians.
The places with the largest
American Indian populations
were New York and Los
Angeles.
Census 2000 showed that, of all
places in the United States with
100,000 or more population,10 New
York and Los Angeles had the largest
American Indian populations with
87,241 and 53,092, respectively (see
Table 3). The next eight places with
the largest American Indian popula-
tions had between 15,743 and
35,093 American Indians. Five of the
top ten places — Los Angeles,
Phoenix, San Diego, Anchorage, and
Albuquerque — were in the West.
The ten largest places for American
Indians together accounted for
8.2 percent of the total U.S.
American Indian population. New
27. York and Los Angeles accounted for
3.4 percent of the total American
Indian population (see Table 3). Of
the ten largest places in the United
States, Phoenix (2.7 percent) had
the largest proportion of American
Indians, followed by Los Angeles
(1.4 percent), and San Diego and
San Antonio, each with 1.3 percent.
Among places of 100,000 or more
population, the highest proportion of
American Indians was in Anchorage
(10 percent) as shown in Figure 4.
Tulsa was the second highest. Six of
the top ten places with the highest
proportion of American Indians were
in the West, with two each in the
Midwest and South.
ADDITIONAL FINDINGS ON
THE AMERICAN INDIAN
AND ALASKA NATIVE
POPULATION
What proportion of American
Indians and Alaska Natives
reported a tribe?
In Census 2000, people who identi-
fied themselves as American Indian
Figure 2.
Percent Distribution of the American Indian and
Alaska Native Population by Region: 2000
28. Source: U.S. Census Bureau, Census 2000 Summary File 1.
(For information on confidentiality protection, nonsampling
error, and definitions,
see www.census.gov/prod/cen2000/doc/sf1.pdf)
American Indian
and Alaska Native
alone or in
combination
American Indian
and Alaska
Native alone
Northeast WestSouthMidwest
9.1 17.4 30.6 43.0
6.6 16.1 29.3 48.0
10 Census 2000 showed 245 places in the
United States with 100,000 or more popula-
tion. They included 238 incorporated places
(including 4 city-county consolidations) and
7 census designated places that are not
legally incorporated. For a list of these
places by state, see www.census.gov/
population/www/cen2000/phc-t6.html.
19.0 (AK)
29. 5.0 to 12.8
1.5 to 4.9
0.4 to 1.4
U.S. percent 1.5
Percent American Indian and
Alaska Native Alone or
In Combination: 2000
People indicating
one or more races
including AIAN as a
percent of total
population by state
People indicating
one or more races
including
American Indian
and Alaska Native
(AIAN), as a
percent of total
population by
county
75.0 to 95.1
50.0 to 74.9
25.0 to 49.9
1.5 to 24.9
30. 0.0 to 1.4
U.S. percent 1.5
Figure 3.
(For information on confidentiality protection, nonsampling
error, and
definitions, see www.census.gov/prod/cen2000/doc/sf1.pdf)
Source: U.S. Census Bureau, Census 2000 Summary
File 1. American FactFinder at factfinder.census.gov
provides census data and mapping tools.
0 100 Miles0 100 Miles0 100 Miles
0 100 Miles
U
.S
. C
e
n
su
s B
u
re
a
u
7
31. or Alaska Native on the question-
naire were asked to report their
enrolled or principal tribe.
Additionally, respondents could
report one or more tribes (see Table
4). Among respondents who report-
ed as American Indian, 79 percent,
or 2.0 million people, specified a
tribe. For those who reported
American Indian in any combination,
67 percent, or 1.1 million people,
reported a tribe. For all people
reporting American Indian either
alone or in any combination, 74 per-
cent, or 3.1 million people, identified
a tribe.
Which American Indian tribal
groupings were the largest?
According to Census 2000, the
American Indian tribal groupings
with 100,000 or more people or
responses were Cherokee, Navajo,
Latin American Indian,11 Choctaw,
Sioux, and Chippewa (see Figure 5
and Table 5).12 These six tribal
groups accounted for 40 percent of
all respondents who reported a sin-
gle grouping or race. Of all
American Indian tribal groupings in
any combination, these six tribal
groups accounted for 42 percent of
all responses. There were 281,069
respondents who reported
32. Cherokee alone and an additional
448,464 who reported Cherokee
with at least one other race or
American Indian tribal grouping. A
total of 729,533 people reported
Cherokee alone or in combination
with one or more other race or
American Indian tribal groupings.
Navajo and Latin American were the
next two largest specified American
Indian tribal groupings. There were
269,202 people who reported
Navajo alone and an additional
28,995 people who reported Navajo
in combination with one or more
other races or American tribal
groupings. This gives a total of
298,197 people who reported
Navajo alone or in combination with
at least one other race or American
Indian tribal groupings. There were
104,354 people who reported only
Latin American Indian and an addi-
tional 76,586 who reported Latin
American in combination with one
or more other races or American
Indian tribal groupings. A total of
180,940 people reported Latin
American Indian alone or in combi-
nation with at least one other race
or American Indian tribal groupings.
Which Alaska Native tribal
groupings were the largest?
33. In 2000, Eskimo was the largest
Alaska Native tribal grouping alone
or in any combination, followed by
Tlingit-Haida, Alaska Athabascan,
and Aleut. These four tribal group-
ings combined accounted for
3.6 percent of all American Indian
8 U.S. Census Bureau
Table 3.
Ten Largest Places in Total Population and in American Indian
and Alaska Native
Population: 2000
(For information on confidentiality protection, nonsampling
error, and definitions, see
www.census.gov/prod/cen2000/doc/sf1.pdf)
Place
Total population
American Indian and
Alaska Native alone
American Indian and
Alaska Native alone
or in combination
Percent of total population
Rank Number Rank Number Rank Number
American
Indian and
34. Alaska
Native alone
American
Indian and
Alaska Native
alone or in
combination
New York, NY. . . . . . . . 1 8,008,278 1 41,289 1 87,241 0.5 1.1
Los Angeles, CA . . . . . 2 3,694,820 2 29,412 2 53,092 0.8 1.4
Chicago, IL . . . . . . . . . . 3 2,896,016 9 10,290 8 20,898 0.4 0.7
Houston, TX . . . . . . . . . 4 1,953,631 11 8,568 10 15,743 0.4
0.8
Philadelphia, PA. . . . . . 5 1,517,550 24 4,073 21 10,835 0.3 0.7
Phoenix, AZ . . . . . . . . . 6 1,321,045 3 26,696 3 35,093 2.0 2.7
San Diego, CA . . . . . . . 7 1,223,400 13 7,543 9 16,178 0.6 1.3
Dallas, TX . . . . . . . . . . . 8 1,188,580 18 6,472 18 11,334 0.5
1.0
San Antonio, TX. . . . . . 9 1,144,646 10 9,584 12 15,224 0.8 1.3
Detroit, MI . . . . . . . . . . . 10 951,270 40 3,140 25 8,907 0.3 0.9
Oklahoma, OK . . . . . . . 29 506,132 6 17,743 5 29,001 3.5 5.7
Tucson, AZ . . . . . . . . . . 30 486,699 8 11,038 11 15,358 2.3 3.2
Albuquerque, NM. . . . . 35 448,607 7 17,444 7 22,047 3.9 4.9
Tulsa, OK . . . . . . . . . . . 43 393,049 5 18,551 4 30,227 4.7 7.7
Anchorage, AK . . . . . . . 65 260,283 4 18,941 6 26,995 7.3 10.4
Source: U.S. Census Bureau, Census 2000 Summary File 1.
11 In 1997, the Office of Management and
Budget definition of American Indian or Alaska
Native included the original peoples of North
and South America (including Central America).
35. 12 Table 5 contains all American Indian and
Alaska Native tribal groupings that contained at
least 7,000 people according to the 1990 cen-
sus. Additional information on individual tribes
is forthcoming.
and Alaska Native tribal responses
alone and 2.7 percent alone or in
any combination (see Figure 6 and
Table 5).
There were 45,919 respondents
who reported Eskimo alone and an
additional 8,842 who reported
Eskimo with at least one other race
or American Indian or Alaska Native
tribal grouping. A total of 54,761
people reported Eskimo alone or in
combination with one or more other
races or American Indian or Alaska
Native tribal groupings.
Tlingit-Haida, Alaska Athabascan,
and Aleut were the next three
largest specified Alaska Native tribal
groupings. There were 14,825 peo-
ple who reported Tlingit-Haida
alone and an additional 7,540 who
reported Tlingit-Haida with at least
one other race or American Indian
or Alaska Native tribal groupings. A
total of 22,365 people reported
36. Tlingit-Haida alone or in combina-
tion with one or more other races
or American Indian or Alaska Native
tribal groupings.
There were 14,520 people who
reported only Alaska Athabascan
and an additional 4,318 people who
reported Alaska Athabascan with
one or more other races or
American Indian or Alaska Native
tribal groupings. A total of 18,838
people reported Alaska Athabascan
alone or in combination with at
least one or more other races or
American Indian or Alaska Native
tribal groupings.
Also, there were 11,941 people who
reported only Aleut and an addition-
al 5,037 people who reported Aleut
with one or more other races or
American Indian or Alaska Native
tribal groupings. A total of 16,978
people reported Aleut alone or in
combination with at least one or
more other races or American Indian
or Alaska Native tribal groupings.
What proportion of American
Indians and Alaska Natives
reported more than one tribal
grouping?
The proportion of respondents
37. reporting a tribe with at least one
other race or American Indian tribal
grouping varied among the ten
largest American Indian tribal
groupings (see Table 5). Of all the
respondents who reported more
than one race or American Indian
tribal grouping, the Blackfeet tribal
grouping had the highest propor-
tion, with 68 percent. The next two
tribal groupings with the highest
proportion of respondents reporting
at least one other race or American
Indian tribal grouping were
Cherokee (62 percent) and Choctaw
(45 percent). Of the ten largest
American Indian tribal groupings,
the Navajo had the lowest propor-
tion (9.7 percent) reporting more
than one race or American Indian
tribal grouping, followed by Pueblo
(19.6 percent).
Among the largest Alaska Native
tribal groupings, the highest pro-
portion of all respondents who
reported more than one race or
American Indian or Alaska Native
tribal groupings was the Tlingit-
Haida with 34 percent. The other
tribal groupings with respondents
reporting at least one other race or
American Indian or Alaska Native
tribal grouping were Aleut (30 per-
cent) and Alaska Athabascan
(23 percent). The Eskimo had the
38. lowest proportion of respondents
(16 percent) reporting more than
one race or American Indian tribal
grouping.
U.S. Census Bureau 9
Figure 4.
Ten Places of 100,000 or More Population With the
Highest Percentage of American Indians and
Alaska Natives: 2000
Source: U.S. Census Bureau, Census 2000 Summary File 1.
(For information on confidentiality protection, nonsampling
error, and definitions
see www.census.gov/prod/cen2000/doc/sf1.pdf)
American Indian and Alaska Native alone or in combination
American Indian and Alaska Native alone
Sacramento, CA
Spokane, WA
Tucson, AZ
Minneapolis, MN
Tacoma, WA
Green Bay, WI
Albuquerque, NM
39. Oklahoma City, OK
Tulsa, OK
Anchorage, AK
2.8
7.3
10.4
4.7
7.7
3.5
5.7
3.9
4.9
3.3
4.1
2.0
3.6
2.2
3.3
2.3
3.2
1.8
3.0
40. 1.3
ABOUT CENSUS 2000
Why did Census 2000 ask the
question on race?
The Census Bureau collects data on
race to fulfill a variety of legislative
and program requirements. Data on
race are used in the legislative redis-
tricting process carried out by the
states and in monitoring local juris-
dictions’ compliance with the Voting
Rights Act. These data are also
essential for evaluating federal pro-
grams that promote equal access to
employment, education, and hous-
ing and for assessing racial dispari-
ties in health and exposure to envi-
ronmental risks. More broadly, data
on race are critical for research that
underlies many policy decisions at
all levels of government.
How do data from the
question on race benefit me,
my family, and my
community?
All levels of government need infor-
mation on race to implement and
evaluate programs or enforce laws.
41. Examples include: the Native
American Programs Act, the Equal
Employment Opportunity Act, the
Civil Rights Act, the Voting Rights
Act, the Public Health Act, the
Healthcare Improvement Act, the
Job Partnership Training Act, the
Equal Credit Opportunity Act, the
Fair Housing Act, and the Census
Redistricting Data Program.
Both public and private organiza-
tions use race information to find
areas where groups may need spe-
cial services and to plan and imple-
ment education, housing, health,
and other programs that address
these needs. For example, a school
system might use this information to
design cultural activities that reflect
the diversity in their community. Or
a business could use it to select the
mix of merchandise it will sell in a
new store. Census information also
helps identify areas where residents
might need services of particular
importance to certain racial or ethnic
groups, such as screening for hyper-
tension or diabetes.
FOR MORE INFORMATION
For more information on race in
the United States, visit the U.S.
Census Bureau’s Internet site at
42. www.census.gov/population/www/
socdemo/race.html.
10 U.S. Census Bureau
Table 4.
Specified Tribe Reported by American Indians and Alaska
Natives: 2000
(For information on confidentiality protection, nonsampling
error, and definitions, see
www.census.gov/prod/cen2000/doc/sf1.pdf)
American Indian and Alaska Native
Whether or not
tribe specified
Total Alone In combination
Number Percent Number Percent Number Percent
Total. . . . . . . . . . . . . 4,119,301 100.0 2,475,956 100.0
1,643,345 100.0
Tribe specified . . . . 3,062,844 74.4 1,963,996 79.3 1,098,848
66.9
Tribe not specified . 1,056,457 25.6 511,960 20.7 544,497 33.1
Source: U.S. Census Bureau, Census 2000 Summary File 1.
Figure 5.
Ten Largest American Indian Tribal Groupings: 2000
Source: U.S. Census Bureau, Census 2000 Summary File 1.
(For information on confidentiality protection, nonsampling
43. error, and definitions,
see www.census.gov/prod/cen2000/doc/sf1.pdf)
American Indian tribal grouping alone or in any combination
American Indian tribal grouping alone
Pueblo
Iroquois
Blackfeet
Apache
Chippewa
Sioux
Choctaw
Latin American
Indian
Navajo
Cherokee
74,085
281,069
729,533
269,202
298,197
180,940
45. American and Alaska
Native alone
American Indian and Alaska
Native in combination
with one or more races
American Indian
and Alaska Native
tribal grouping
alone or in any
combination1
One tribal
grouping
reported
More than one
tribal grouping
reported1
One tribal
grouping
reported
More than one
tribal grouping
reported1
Total. . . . . . . . . . . . . . . . . . . . . . . . . . . 2,423,531 52,425
1,585,396 57,949 4,119,301
Apache . . . . . . . . . . . . . . . . . . . . . . . . . . . . 57,060 7,917
48. 195,902
Alaska Athabascan . . . . . . . . . . . . . . . . . . 14,520 815 3,218
285 18,838
Aleut. . . . . . . . . . . . . . . . . . . . . . . . . . . . . . . 11,941 832
3,850 355 16,978
Eskimo. . . . . . . . . . . . . . . . . . . . . . . . . . . . . 45,919 1,418
6,919 505 54,761
Tlingit-Haida . . . . . . . . . . . . . . . . . . . . . . . . 14,825 1,059
6,047 434 22,365
Other specified Alaska Native tribes . . . 2,552 435 841 145
3,973
Alaska Native tribe, not specified2 . . . . . . 6,161 370 2,053 118
8,702
American Indian or Alaska Native
tribes, not specified
3
. . . . . . . . . . . . . . . . 511,960 (X) 544,497 (X) 1,056,457
X Not applicable.
1The numbers by American Indian and Alaska Native tribal
grouping do not add to the total population. This is because the
American
Indian and Alaska Native tribal groupings are tallies of the
number of American Indian and Alaska Native responses rather
than the number
of American Indian and Alaska Native respondents.
Respondents reporting several American Indian and Alaska
Native tribes are counted
several times. For example, a respondent reporting ‘‘Apache
and Blackfeet’’ would be included in the Apache as well as
Blackfeet numbers.
2Includes respondents who checked the ‘‘American Indian or
Alaska Native’’ response category on the census questionnaire
49. or wrote in
a tribe not specified in the American Indian and Alaska Native
Tribal Detailed Classification List for Census 2000.
3Includes respondents who checked the ‘‘American Indian or
Alaska Native’’ response category on the census questionnaire
or wrote in
the generic term ‘‘American Indian’’ or ‘‘Alaska Native,’ ’ or
tribal entries not elsewhere classified.
Source: U.S. Census Bureau, Census 2000, special tabulations.
U.S. Census Bureau 11
Race data from Census 2000
Summary File 1 were released on a
state-by-state basis during the sum-
mer of 2001, including data for
selected American and Alaska
Native tribal groupings.
The Census 2000 Summary File 1
data are available on the Internet
via factfinder.census.gov and for
purchase on CD-ROM and on DVD.
For information on confidentiality
protection, nonsampling error, and
definitions, also see
www.census.gov/prod/cen2000/doc/
sf1.pdf or contact our Customer
Services Center at 301-763-INFO
(4636).
50. For more information on specific
races in the United States, go to
www.census.gov and click on
“Minority Links.” This Web page
includes information about Census
2000 and provides links to reports
based on past censuses and surveys
focusing on the social and economic
characteristics of the Black or African
American, American Indian and
Alaska Native, Asian, and Native
Hawaiian and Other Pacific Islander
populations.
Information on other population
and housing topics is presented in
the Census 2000 Brief series, locat-
ed on the U.S. Census Bureau’s Web
site at
www.census.gov/population/www/
cen2000/briefs.html. This series
presents information on race,
Hispanic origin, age, sex, household
type, housing tenure, and other
social, economic, and housing char-
acteristics.
For more information about Census
2000, including data products, call
our Customer Services Center at
301-763-INFO (4636), or e-mail
[email protected]
Figure 6.
Largest Alaska Native Tribal Groupings: 2000
51. Source: U.S. Census Bureau, Census 2000 Summary File 1.
(For information on confidentiality protection, nonsampling
error, and definitions,
see www.census.gov/prod/cen2000/doc/sf1.pdf)
Aleut
Alaska Athabascan
Tlingit-Haida
Eskimo
Alaska Native tribal
grouping alone
Alaska Native tribal grouping alone
or in any combination
22,365
14,520
11,941
16,978
18,838
14,825
45,919
54,761
62. late 20th century policies contained some elements of
recognizing tribal self-rule, the government continued to design
paternalistic policies for native peoples even when they
conflicted with what the native peoples themselves wanted.
The diversity of the Native American people in terms of tribe,
urban versus rural, reservation v. non-reservation, and degree of
mixed ancestry may be without parallel to any other subordinate
group. Not unexpectedly, such a diverse people respond to their
unique position in a number of different and sometimes
contradictory ways. Resistance through collective action is
found in pan-Indianism in the form of social protests and
cultural protection.
The continued conflict between the dominant culture and Native
Americans into the 21st century is seen in land rights, tribal
hunting and fishing rights, environmental justice, economic
Lecture Notes
Removal Act, 1830
What was the goal of the Indian Removal Act of 1830?
The Indian Removal Act and the "Trail of Tears" ware examples
of forced migration of the Indians to the west.
This Act intended to relocate the Native Americans west of the
Mississippi River. And it allowed the annexation of traditional
Indian lands and the colonization by white settlers.
The Dawes Act know as General Allotment Act of 1887
The Allotment Act intended to impose upon the Native
Americans the European concept of private property ownership.
Reorganization Act 1934
The Indian Reorganization Act forced the tribal people to adopt
the European way of voting and the election of leaders.
The Allotment Act and the Indian Reorganization Act were
based on the idea of force assimilation of the American Indians.
Termination Act 1953-1975
Ended the reservation federal tax immunity, cut federal for
basic health care services and favored Native Americans self-
governance within the structure of the BIA (without
sovereignty)