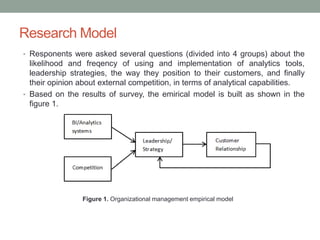
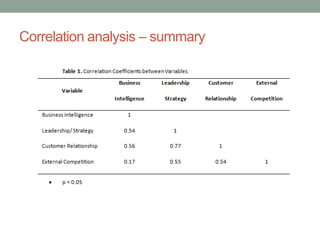
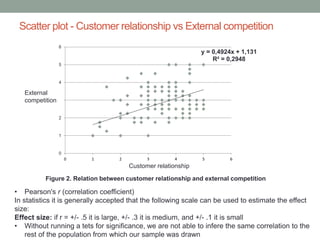
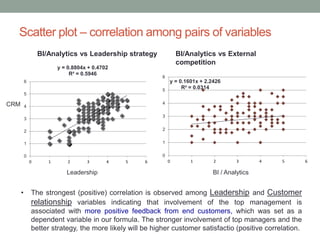
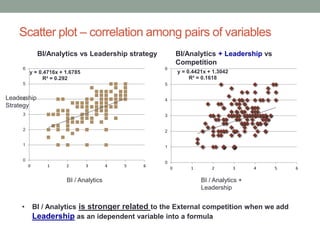
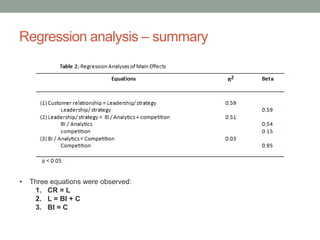
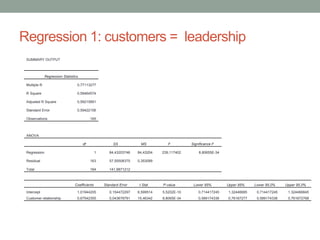
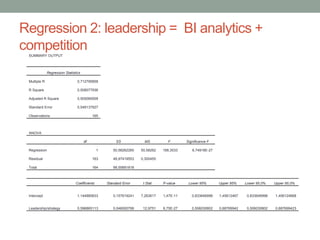
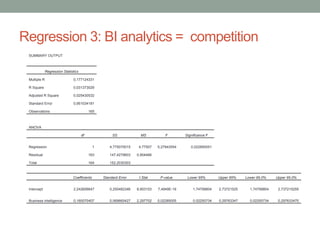
CEN 652 – BUSINESS
INTELLIGENCE
International Burch University Sarajevo –
Assignment 3
Correlation and regression analysis
Nihad Omerbegović
Assignment 3 – Task
• Analyse provided set of data collected from managers in a
variety of Bosnian organisations using correlation and
regression tests.
• Build a plausible empirical model from data and present the
model graphically with main elements and relationships among
them.
• Prepare presentation (powerpoint slides) explaining obtained
objectives, method and findings.
Objectives & Methodology
• Objectives: Find out if there is relation (positive or negative)
between several (pairs of) variables that were provided in the
form of excel sheet data, collected from managers in a variety
of Bosnian organisations. Survey items were measured on 5-
point likert scales.
• Methods: Descriptive statistics (Correlation and regression
analysis)
• Tools used: Microsoft Excel 2010
Research Model
• Responents were asked several questions (divided into 4 groups) about the
likelihood and freqency of using and implementation of analytics tools,
leadership strategies, the way they position to their customers, and finally
their opinion about external competition, in terms of analytical capabilities.
• Based on the results of survey, the emirical model is built as shown in the
figure 1.
Figure 1. Organizational management empirical model
Correlation analysis – summary
Scatter plot - Customer relationship vs External competition
y = 0,4924x + 1,131
R² = 0,2948
0
1
2
3
4
5
6
0 1 2 3 4 5 6
Customer relationship
External
competition
Figure 2. Relation between customer relationship and external competition
• Pearson's r (correlation coefficient)
In statistics it is generally accepted that the following scale can be used to estimate the effect
size:
Effect size: if r = +/- .5 it is large, +/- .3 it is medium, and +/- .1 it is small
• Without running a tets for significance, we are not able to infere the same correlation to the
rest of the population from which our sample was drawn
Scatter plot – correlation among pairs of variables
BI/Analytics vs Leadership strategy
Leadership
CRM
BI/Analytics vs External
competition
BI / Analytics
• The strongest (positive) correlation is observed among Leadership and Customer
relationship variables indicating that involvement of the top management is
associated with more positive feedback from end customers, which was set as a
dependent variable in our formula. The stronger involvement of top managers and the
better strategy, the more likely will be higher customer satisfactio (positive correlation.
y = 0.8804x + 0.4702
R² = 0.5946
0
1
2
3
4
5
6
0 1 2 3 4 5 6
y = 0.1601x + 2.2426
R² = 0.0314
0
1
2
3
4
5
6
0 1 2 3 4 5 6
Scatter plot – correlation among pairs of variables
BI/Analytics vs Leadership strategy
BI / Analytics
Leadership
Strategy
y = 0.4716x + 1.6785
R² = 0.292
0
1
2
3
4
5
6
0 1 2 3 4 5 6
y = 0.4421x + 1.3042
R² = 0.1618
0
1
2
3
4
5
6
0 1 2 3 4 5 6
BI/Analytics + Leadership vs
Competition
BI / Analytics +
Leadership
• BI / Analytics is stronger related to the External competition when we add
Leadership as an idependent variable into a formula
Regression analysis – summary
• Three equations were observed:
1. CR = L
2. L = BI + C
3. BI = C
Regression 1: customers = leadership
SUMMARY OUTPUT
Regression Statistics
Multiple R 0,77113277
R Square 0,59464574
Adjusted R Square 0,59215891
Standard Error 0,59422106
Observations 165
ANOVA
df SS MS F Significance F
Regression 1 84,43203746 84,43204 239,117402 8,80655E-34
Residual 163 57,55508375 0,353099
Total 164 141,9871212
Coefficients Standard Error t Stat P-value Lower 95% Upper 95% Lower 95,0% Upper 95,0%
Intercept 1,01944205 0,154472297 6,599514 5,5202E-10 0,714417245 1,32446685 0,714417245 1,324466845
Customer relationship 0,67542355 0,043678791 15,46342 8,8065E-34 0,589174336 0,76167277 0,589174336 0,761672768
Regression 2: leadership = BI analytics +
competitionSUMMARY OUTPUT
Regression Statistics
Multiple R 0,712795858
R Square 0,508077936
Adjusted R Square 0,505060009
Standard Error 0,548137927
Observations 165
ANOVA
df SS MS F Significance F
Regression 1 50,58262265 50,58262 168,3533 6,74918E-27
Residual 163 48,97419553 0,300455
Total 164 99,55681818
Coefficients Standard Error t Stat P-value Lower 95% Upper 95% Lower 95,0% Upper 95,0%
Intercept 1,144885833 0,157619241 7,263617 1,47E-11 0,833646998 1,45612467 0,833646998 1,456124668
Leadership/strategy 0,596865113 0,046000799 12,9751 6,75E-27 0,506030802 0,68769942 0,506030802 0,687699423
Regression 3: BI analytics = competition
SUMMARY OUTPUT
Regression Statistics
Multiple R 0,177124331
R Square 0,031373029
Adjusted R Square 0,025430532
Standard Error 0,951034181
Observations 165
ANOVA
df SS MS F Significance F
Regression 1 4,775070015 4,77507 5,27943554 0,022850051
Residual 163 147,4279603 0,904466
Total 164 152,2030303
Coefficients Standard Error t Stat P-value Lower 95% Upper 95% Lower 95,0% Upper 95,0%
Intercept 2,242606647 0,250482346 8,953153 7,4849E-16 1,74799804 2,73721525 1,74799804 2,737215255
Business intelligence 0,160070407 0,069665427 2,297702 0,02285005 0,02250734 0,29763347 0,02250734 0,297633475
Findings – summary
• In 2014. large survey was conducted among Managers in several Organizations in
Bosnia and Herzegovina, with aim to find out what effects are in relation for successful
organization management.
• There were total 165 participants; survey contained 16 questions, dividied into 4
independent groups ( BI/ analytics, Leadership/ strategy, Customer relationship and
external competition).
• Correlation and regression analysis showed that the strongest (positive) relationship (R =
0,77) is among leadership/strategies and customer care. We can conclude that when top
managers are more involved, and the better their strategy is, it will likely result in higher
customer satisfaction.
• A bit weaker relationship exists among remaining two pairs (BI analytics vs leadership
and customer relationship vs external competition) – both with the same coefficient R =
0,54 (rounded to 2 decimals).
• The weakest relation (R = 0,17) which is really small is seen between usage of business
analytics tools in a company and managers’ opinion about competition and tools they use.
• If we add into previous result „Leadership” as an independent variable, we notice that this
relationship increases (from tiny R = 0,17 to R = 0,41) meaning that managers’
involvement drastically impacts on competition relationships, as well as customer
relationship, which was mentioned earlier.

Correlation and regression analysis - summary

  • 1.
    CEN 652 –BUSINESS INTELLIGENCE International Burch University Sarajevo – Assignment 3 Correlation and regression analysis Nihad Omerbegović
  • 2.
    Assignment 3 –Task • Analyse provided set of data collected from managers in a variety of Bosnian organisations using correlation and regression tests. • Build a plausible empirical model from data and present the model graphically with main elements and relationships among them. • Prepare presentation (powerpoint slides) explaining obtained objectives, method and findings.
  • 3.
    Objectives & Methodology •Objectives: Find out if there is relation (positive or negative) between several (pairs of) variables that were provided in the form of excel sheet data, collected from managers in a variety of Bosnian organisations. Survey items were measured on 5- point likert scales. • Methods: Descriptive statistics (Correlation and regression analysis) • Tools used: Microsoft Excel 2010
  • 4.
    Research Model • Responentswere asked several questions (divided into 4 groups) about the likelihood and freqency of using and implementation of analytics tools, leadership strategies, the way they position to their customers, and finally their opinion about external competition, in terms of analytical capabilities. • Based on the results of survey, the emirical model is built as shown in the figure 1. Figure 1. Organizational management empirical model
  • 5.
  • 6.
    Scatter plot -Customer relationship vs External competition y = 0,4924x + 1,131 R² = 0,2948 0 1 2 3 4 5 6 0 1 2 3 4 5 6 Customer relationship External competition Figure 2. Relation between customer relationship and external competition • Pearson's r (correlation coefficient) In statistics it is generally accepted that the following scale can be used to estimate the effect size: Effect size: if r = +/- .5 it is large, +/- .3 it is medium, and +/- .1 it is small • Without running a tets for significance, we are not able to infere the same correlation to the rest of the population from which our sample was drawn
  • 7.
    Scatter plot –correlation among pairs of variables BI/Analytics vs Leadership strategy Leadership CRM BI/Analytics vs External competition BI / Analytics • The strongest (positive) correlation is observed among Leadership and Customer relationship variables indicating that involvement of the top management is associated with more positive feedback from end customers, which was set as a dependent variable in our formula. The stronger involvement of top managers and the better strategy, the more likely will be higher customer satisfactio (positive correlation. y = 0.8804x + 0.4702 R² = 0.5946 0 1 2 3 4 5 6 0 1 2 3 4 5 6 y = 0.1601x + 2.2426 R² = 0.0314 0 1 2 3 4 5 6 0 1 2 3 4 5 6
  • 8.
    Scatter plot –correlation among pairs of variables BI/Analytics vs Leadership strategy BI / Analytics Leadership Strategy y = 0.4716x + 1.6785 R² = 0.292 0 1 2 3 4 5 6 0 1 2 3 4 5 6 y = 0.4421x + 1.3042 R² = 0.1618 0 1 2 3 4 5 6 0 1 2 3 4 5 6 BI/Analytics + Leadership vs Competition BI / Analytics + Leadership • BI / Analytics is stronger related to the External competition when we add Leadership as an idependent variable into a formula
  • 9.
    Regression analysis –summary • Three equations were observed: 1. CR = L 2. L = BI + C 3. BI = C
  • 10.
    Regression 1: customers= leadership SUMMARY OUTPUT Regression Statistics Multiple R 0,77113277 R Square 0,59464574 Adjusted R Square 0,59215891 Standard Error 0,59422106 Observations 165 ANOVA df SS MS F Significance F Regression 1 84,43203746 84,43204 239,117402 8,80655E-34 Residual 163 57,55508375 0,353099 Total 164 141,9871212 Coefficients Standard Error t Stat P-value Lower 95% Upper 95% Lower 95,0% Upper 95,0% Intercept 1,01944205 0,154472297 6,599514 5,5202E-10 0,714417245 1,32446685 0,714417245 1,324466845 Customer relationship 0,67542355 0,043678791 15,46342 8,8065E-34 0,589174336 0,76167277 0,589174336 0,761672768
  • 11.
    Regression 2: leadership= BI analytics + competitionSUMMARY OUTPUT Regression Statistics Multiple R 0,712795858 R Square 0,508077936 Adjusted R Square 0,505060009 Standard Error 0,548137927 Observations 165 ANOVA df SS MS F Significance F Regression 1 50,58262265 50,58262 168,3533 6,74918E-27 Residual 163 48,97419553 0,300455 Total 164 99,55681818 Coefficients Standard Error t Stat P-value Lower 95% Upper 95% Lower 95,0% Upper 95,0% Intercept 1,144885833 0,157619241 7,263617 1,47E-11 0,833646998 1,45612467 0,833646998 1,456124668 Leadership/strategy 0,596865113 0,046000799 12,9751 6,75E-27 0,506030802 0,68769942 0,506030802 0,687699423
  • 12.
    Regression 3: BIanalytics = competition SUMMARY OUTPUT Regression Statistics Multiple R 0,177124331 R Square 0,031373029 Adjusted R Square 0,025430532 Standard Error 0,951034181 Observations 165 ANOVA df SS MS F Significance F Regression 1 4,775070015 4,77507 5,27943554 0,022850051 Residual 163 147,4279603 0,904466 Total 164 152,2030303 Coefficients Standard Error t Stat P-value Lower 95% Upper 95% Lower 95,0% Upper 95,0% Intercept 2,242606647 0,250482346 8,953153 7,4849E-16 1,74799804 2,73721525 1,74799804 2,737215255 Business intelligence 0,160070407 0,069665427 2,297702 0,02285005 0,02250734 0,29763347 0,02250734 0,297633475
  • 13.
    Findings – summary •In 2014. large survey was conducted among Managers in several Organizations in Bosnia and Herzegovina, with aim to find out what effects are in relation for successful organization management. • There were total 165 participants; survey contained 16 questions, dividied into 4 independent groups ( BI/ analytics, Leadership/ strategy, Customer relationship and external competition). • Correlation and regression analysis showed that the strongest (positive) relationship (R = 0,77) is among leadership/strategies and customer care. We can conclude that when top managers are more involved, and the better their strategy is, it will likely result in higher customer satisfaction. • A bit weaker relationship exists among remaining two pairs (BI analytics vs leadership and customer relationship vs external competition) – both with the same coefficient R = 0,54 (rounded to 2 decimals). • The weakest relation (R = 0,17) which is really small is seen between usage of business analytics tools in a company and managers’ opinion about competition and tools they use. • If we add into previous result „Leadership” as an independent variable, we notice that this relationship increases (from tiny R = 0,17 to R = 0,41) meaning that managers’ involvement drastically impacts on competition relationships, as well as customer relationship, which was mentioned earlier.