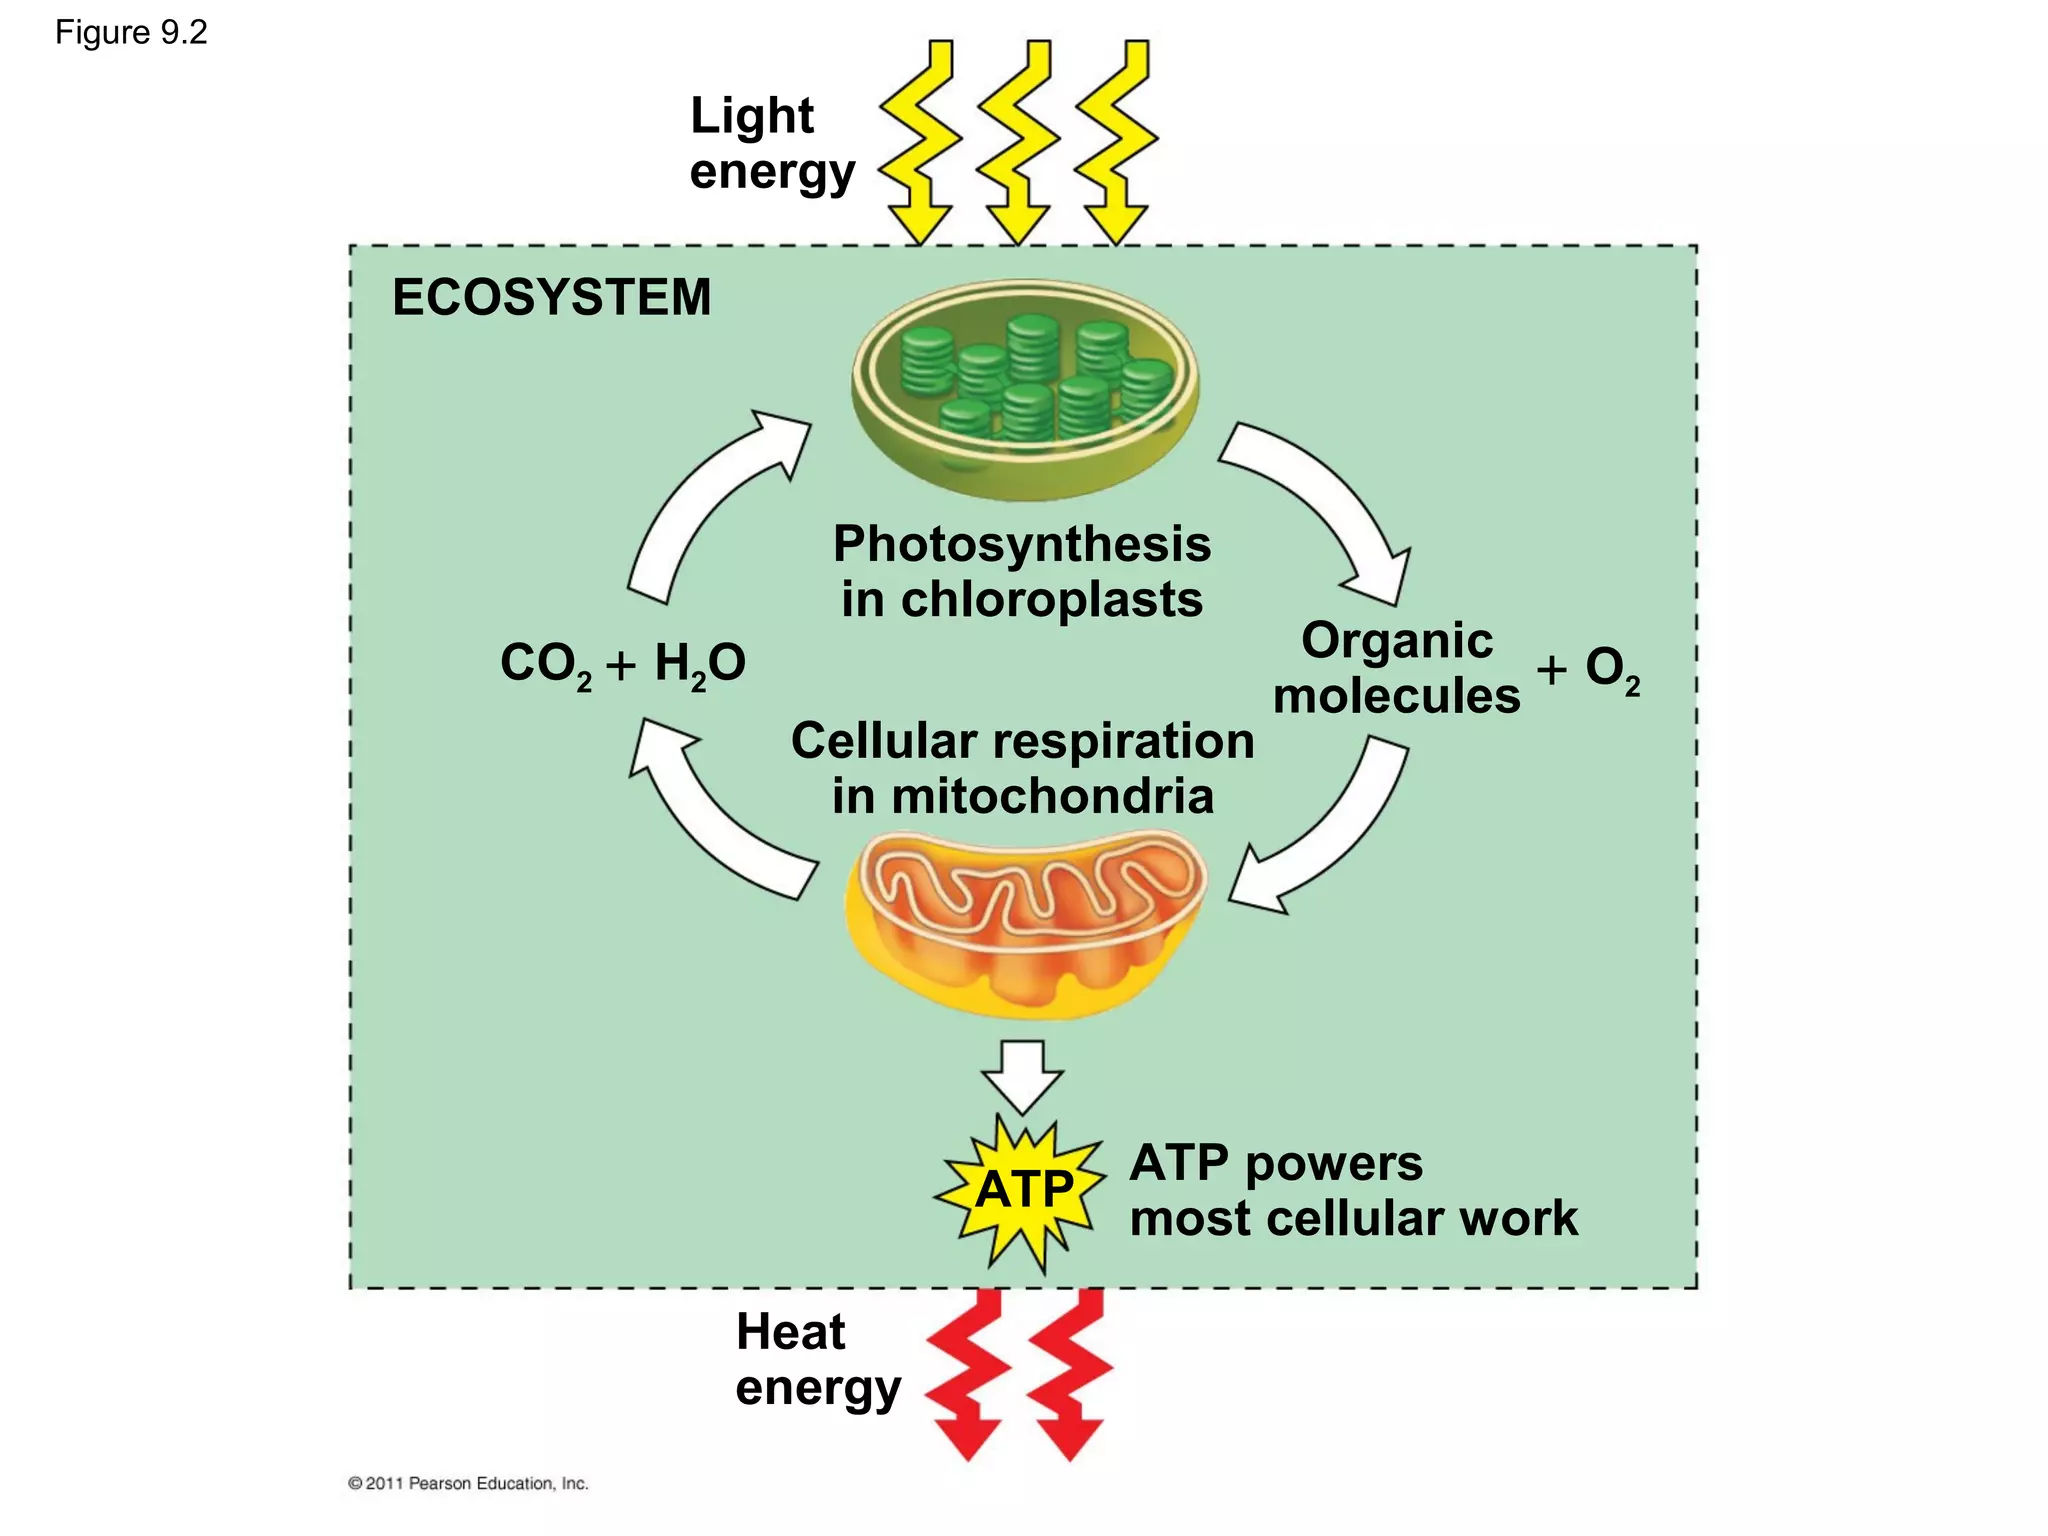
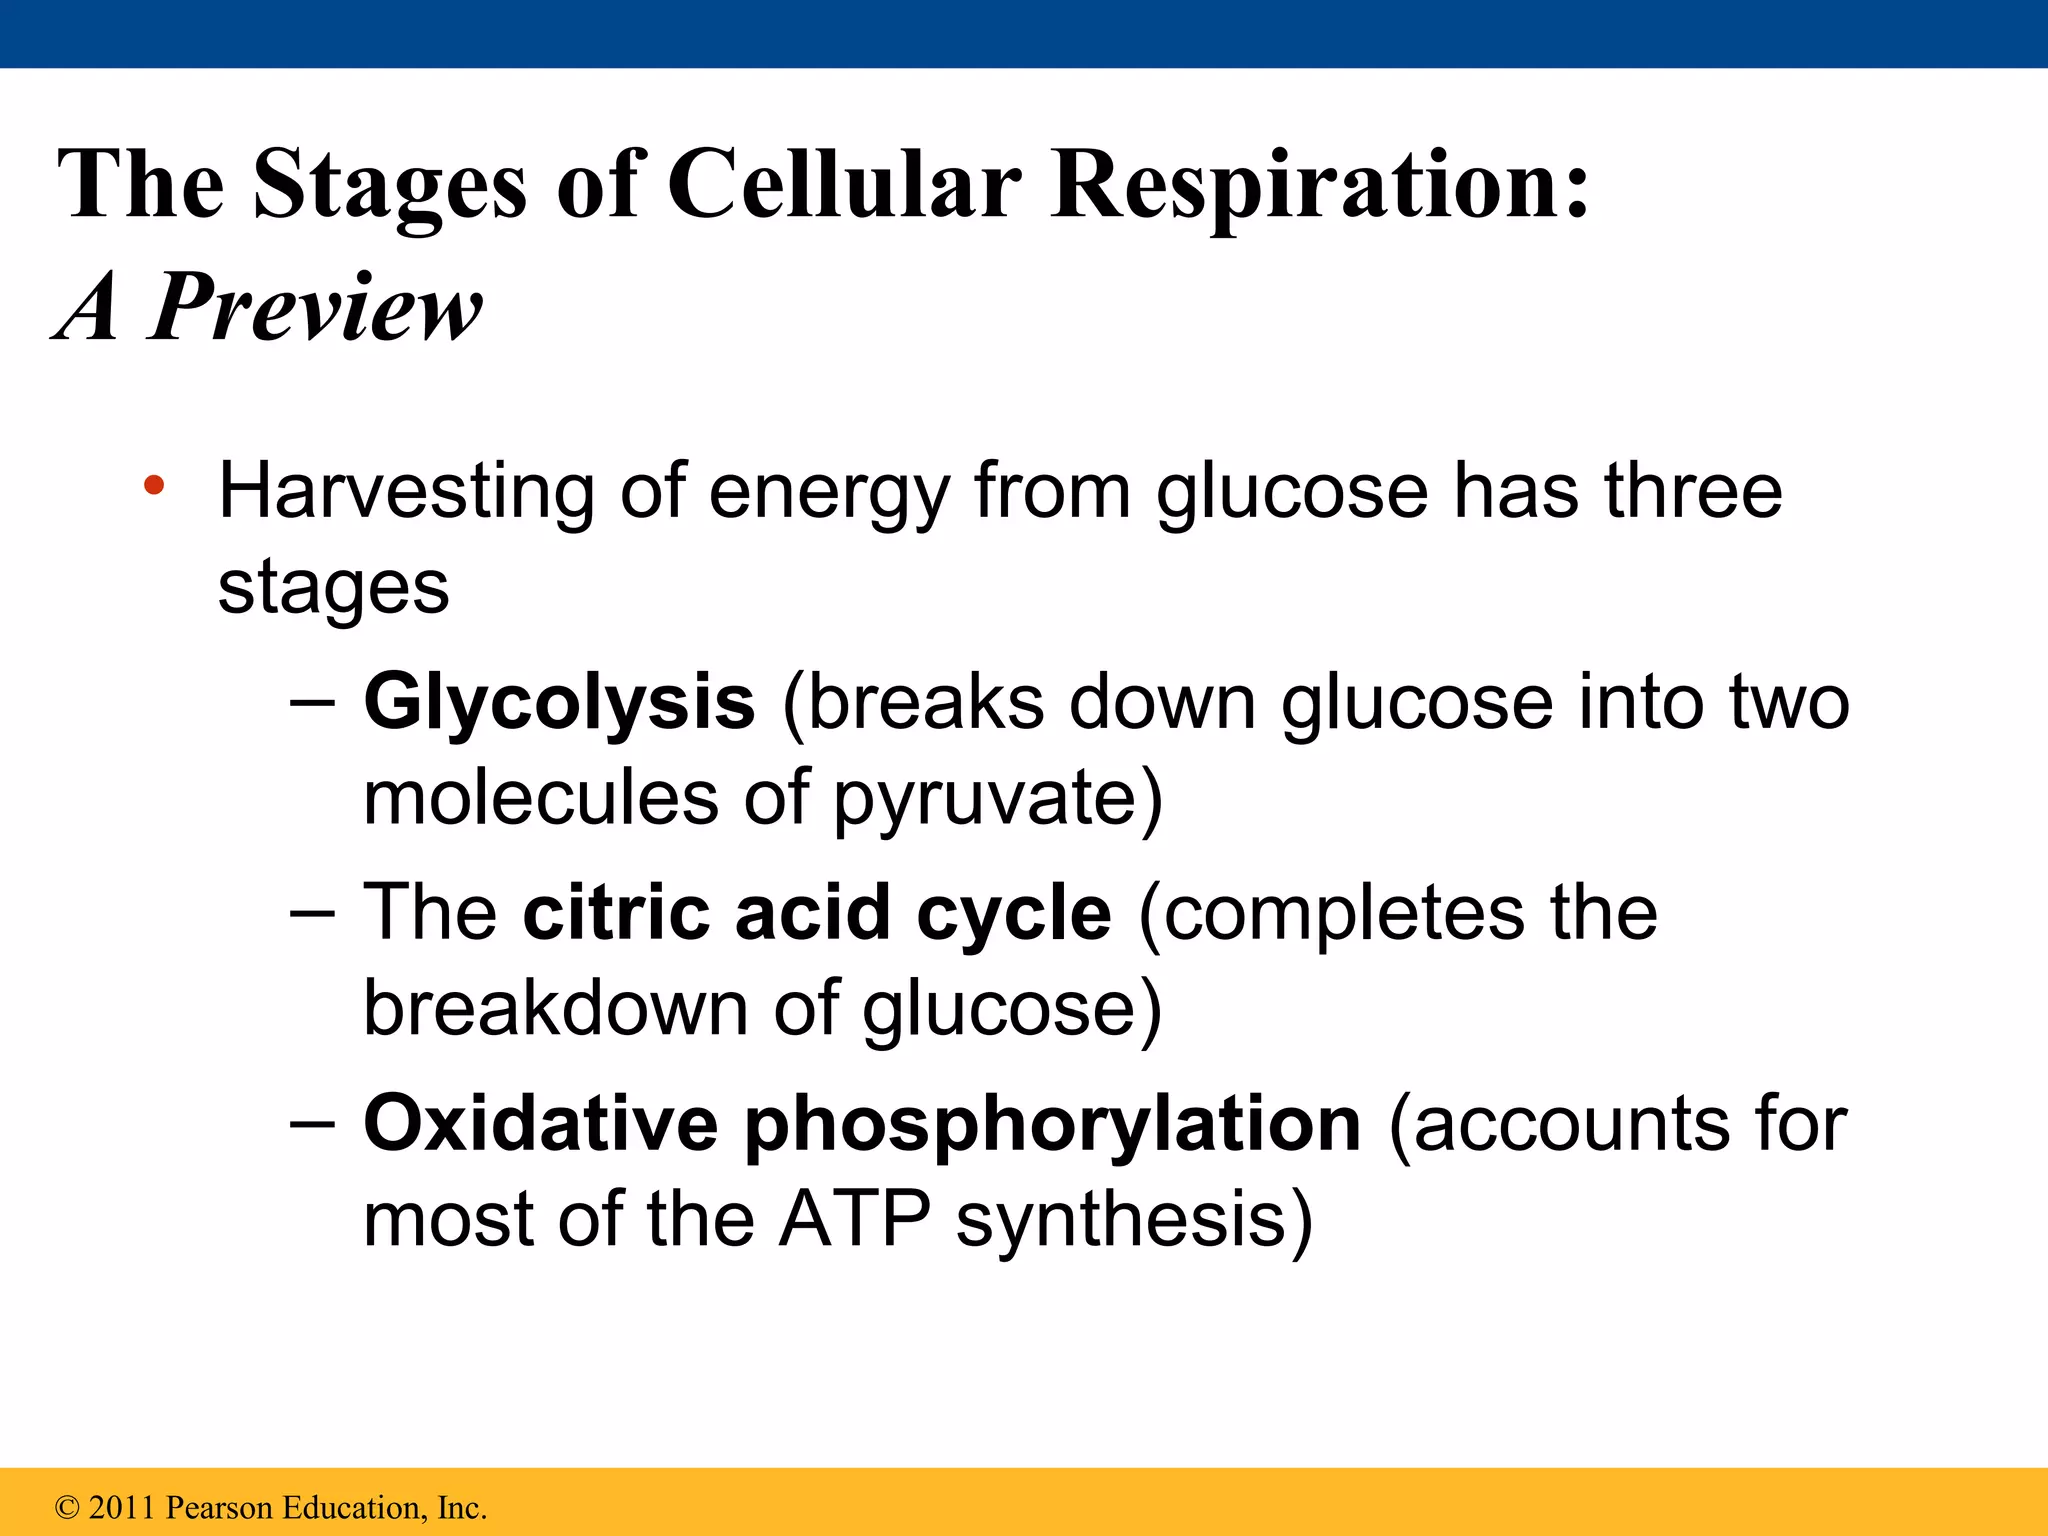
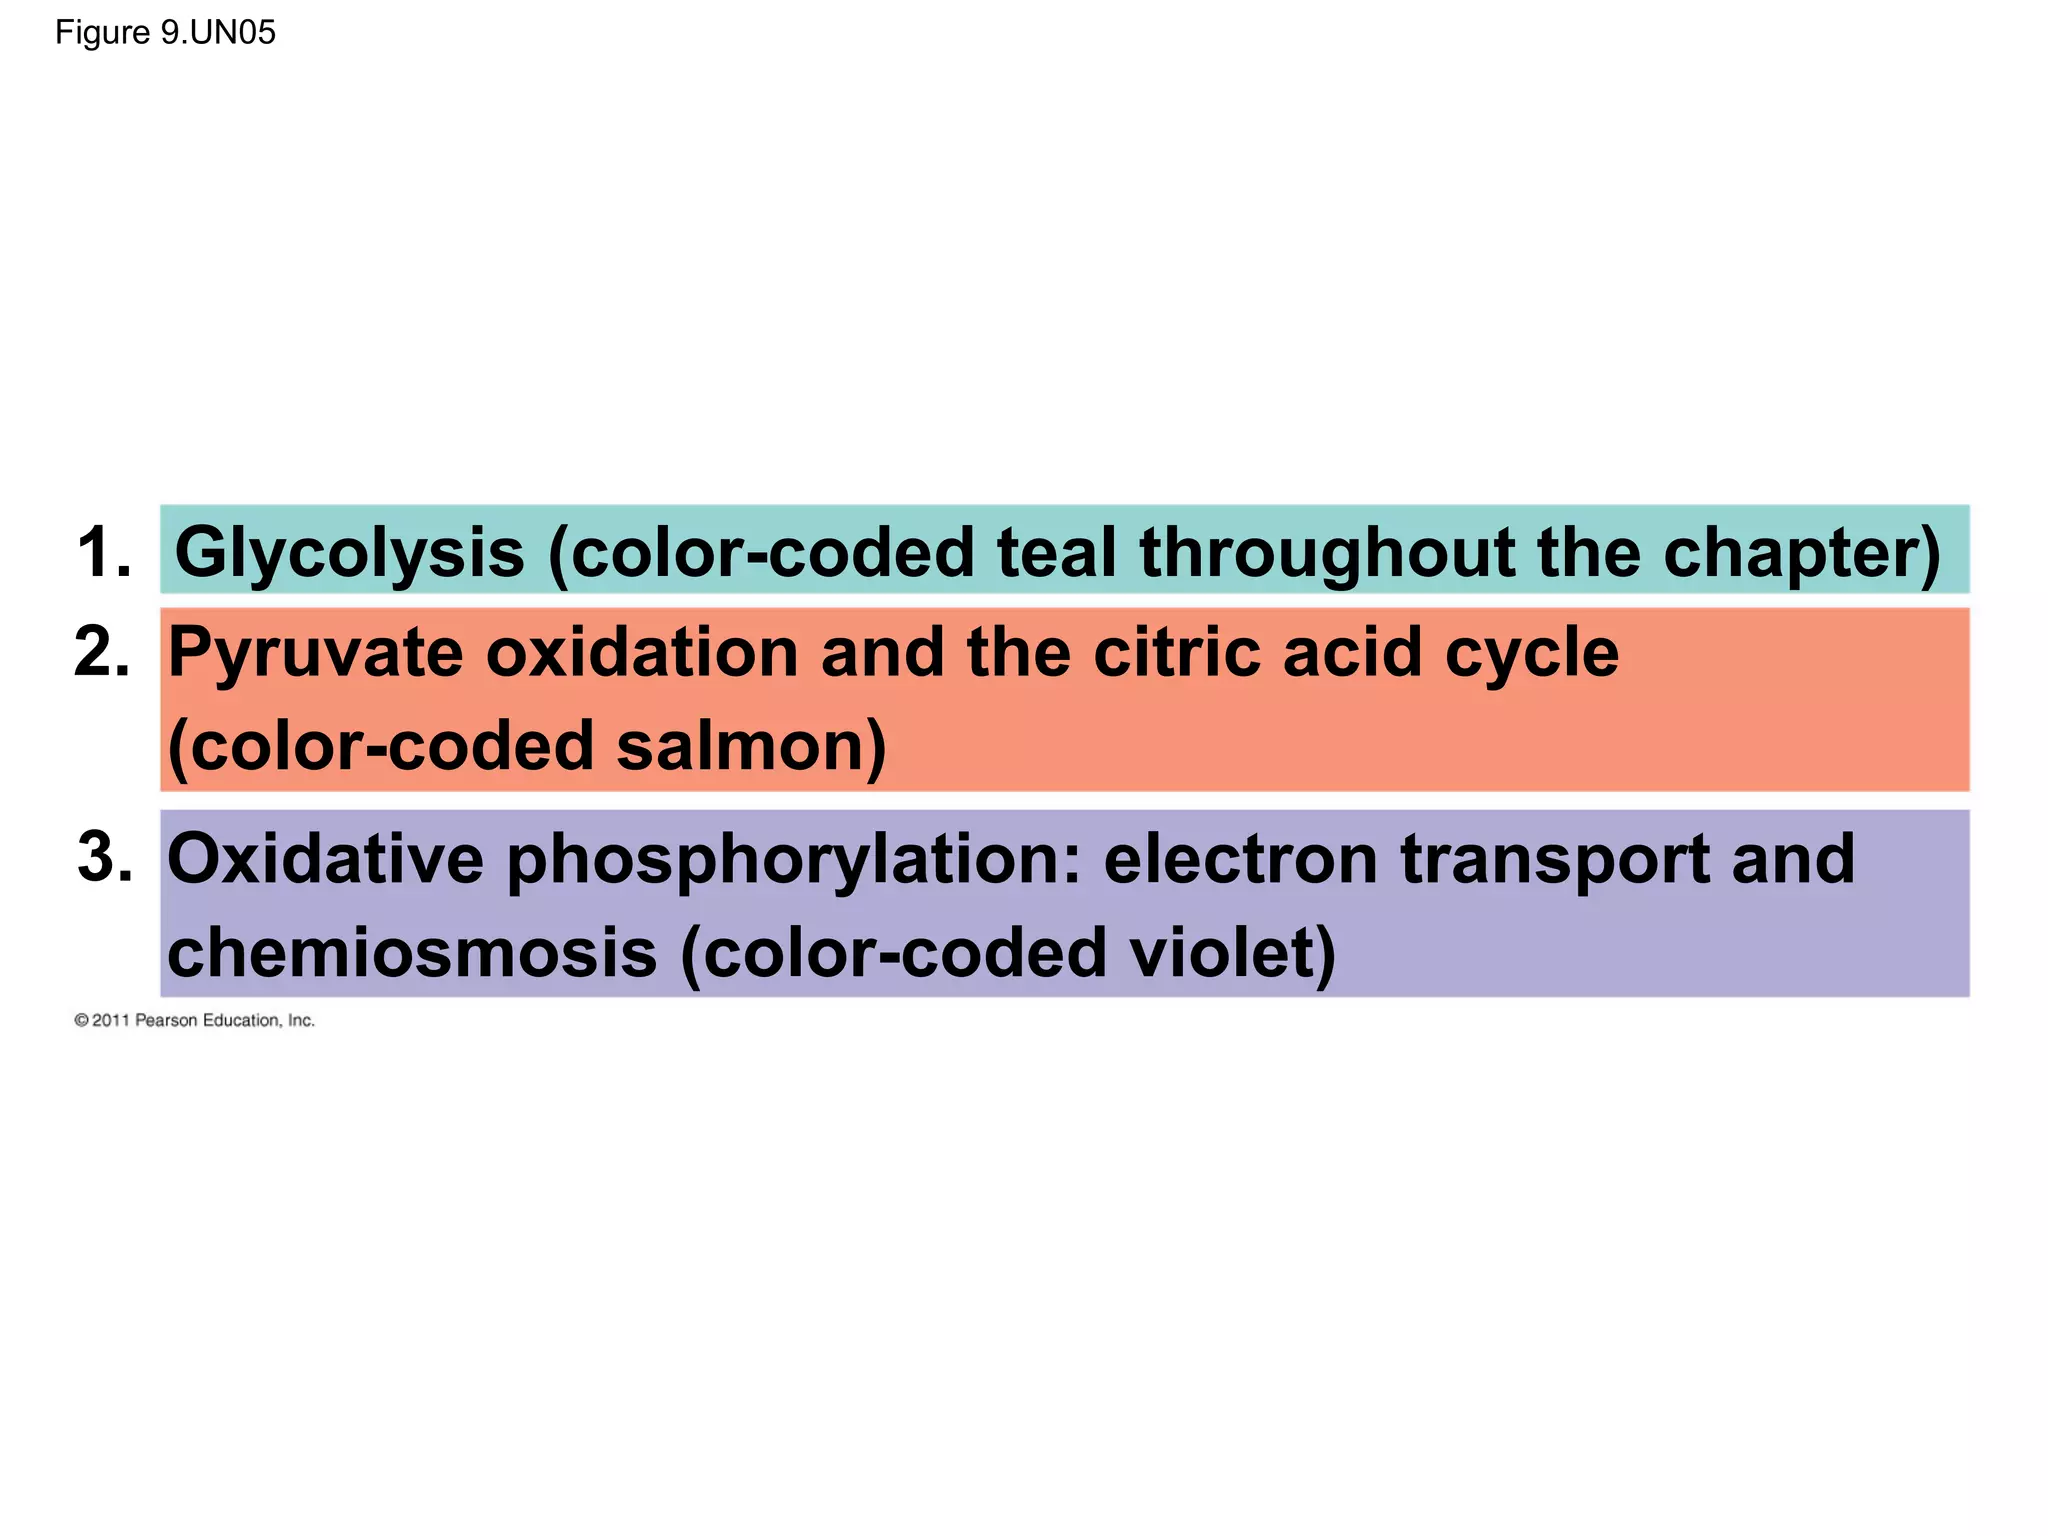
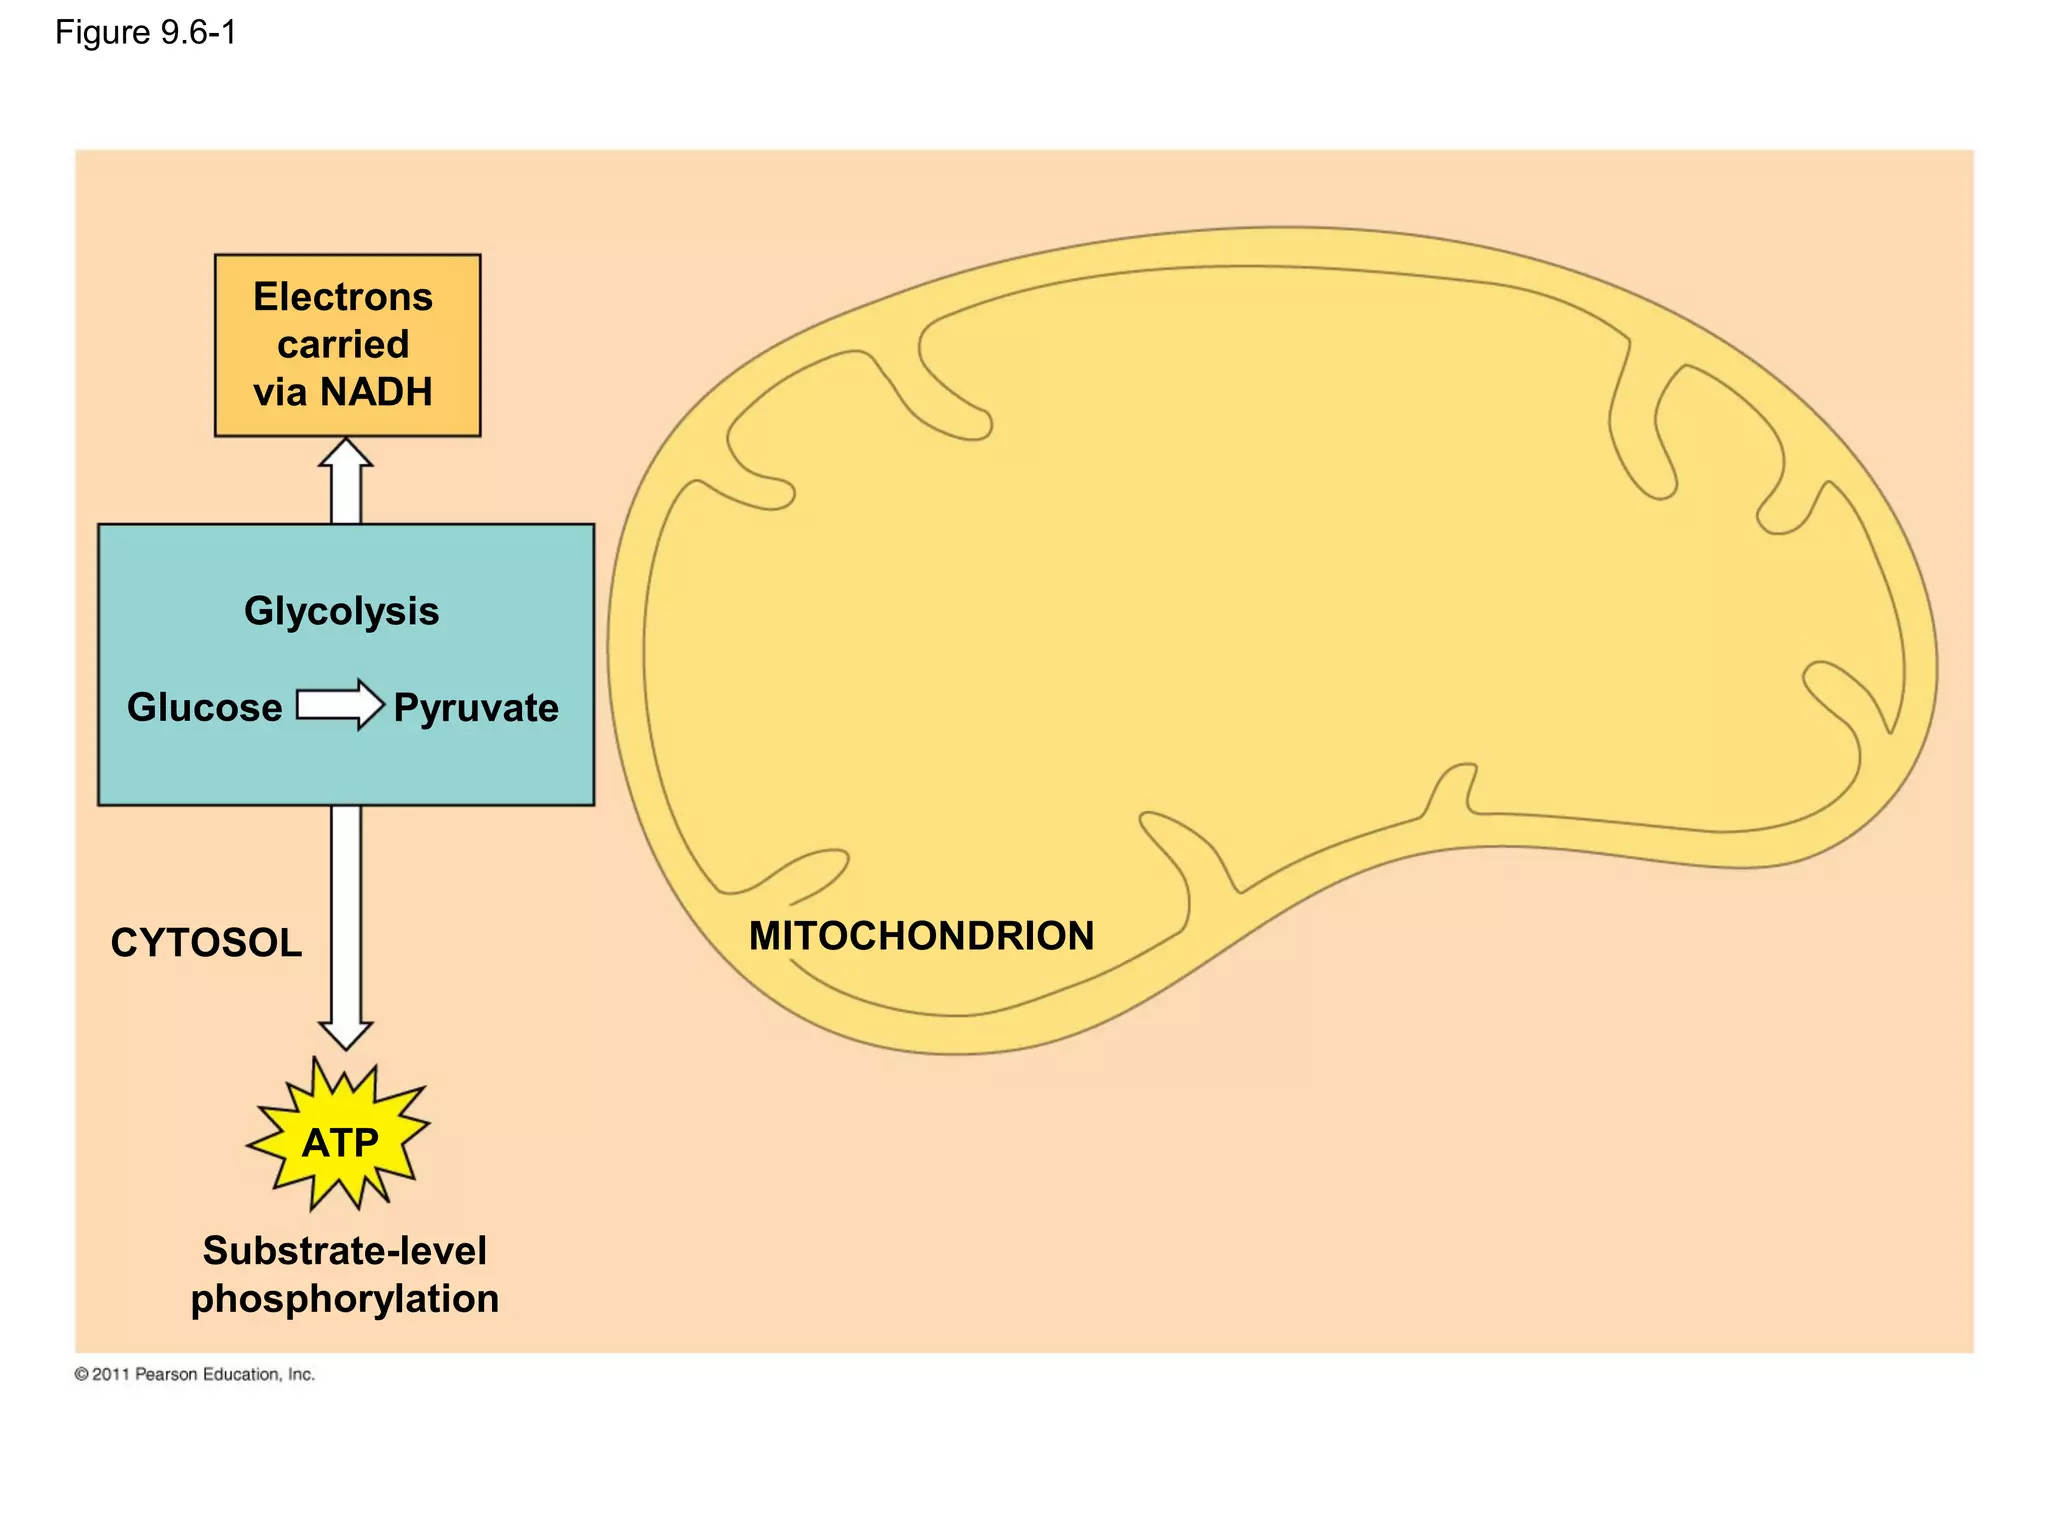
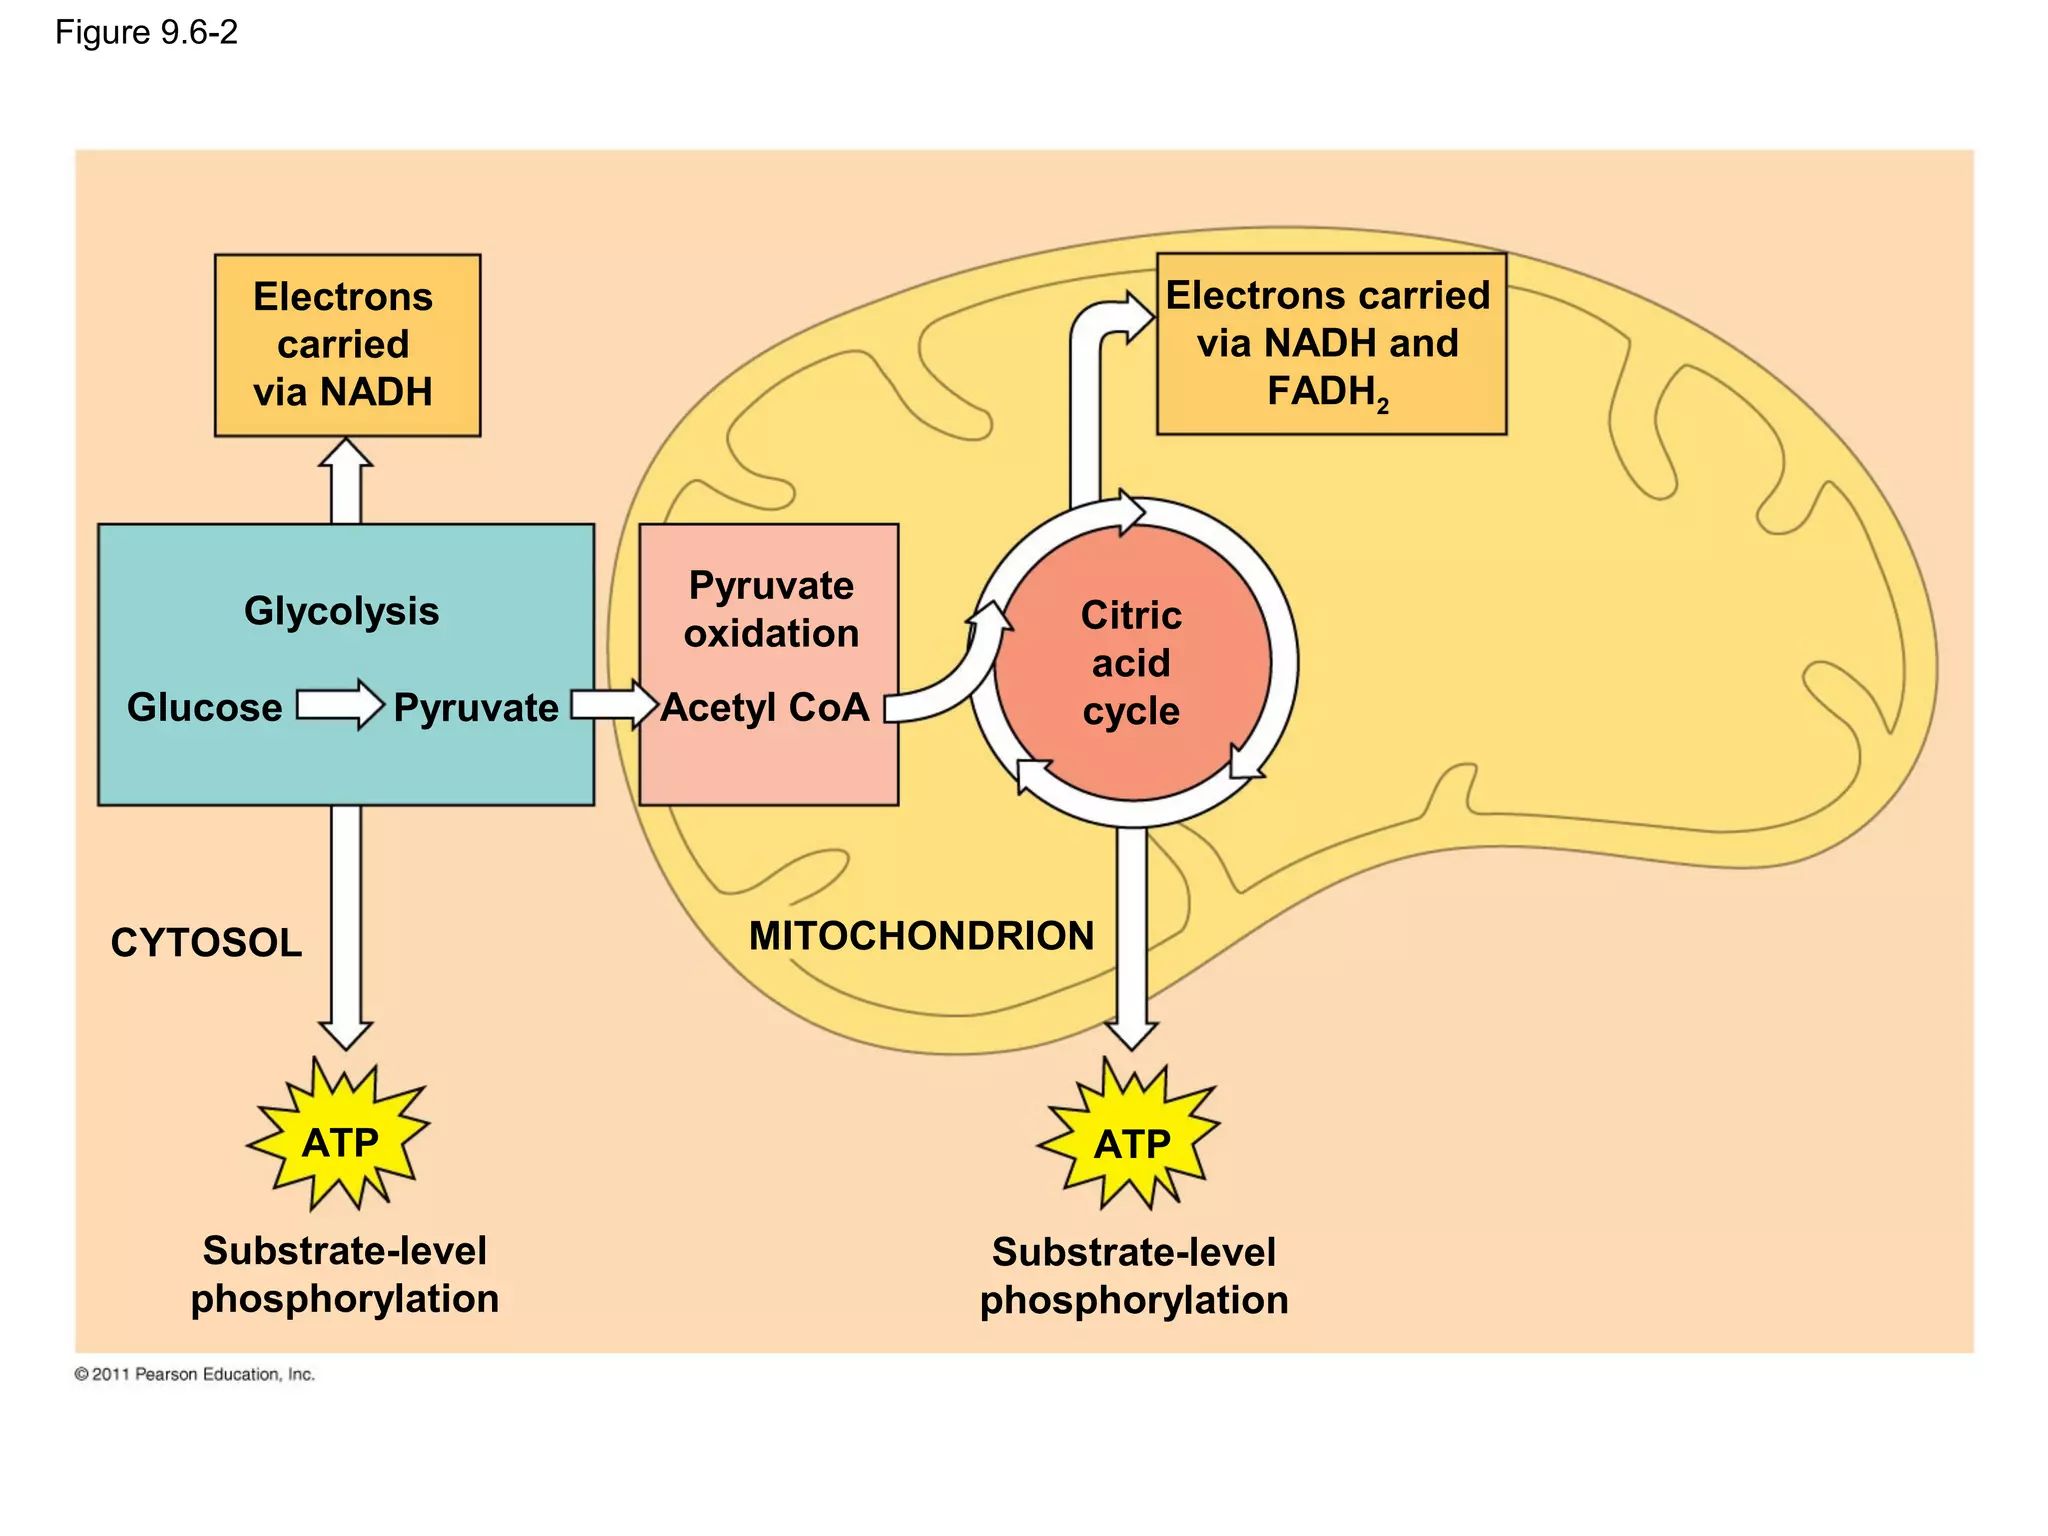
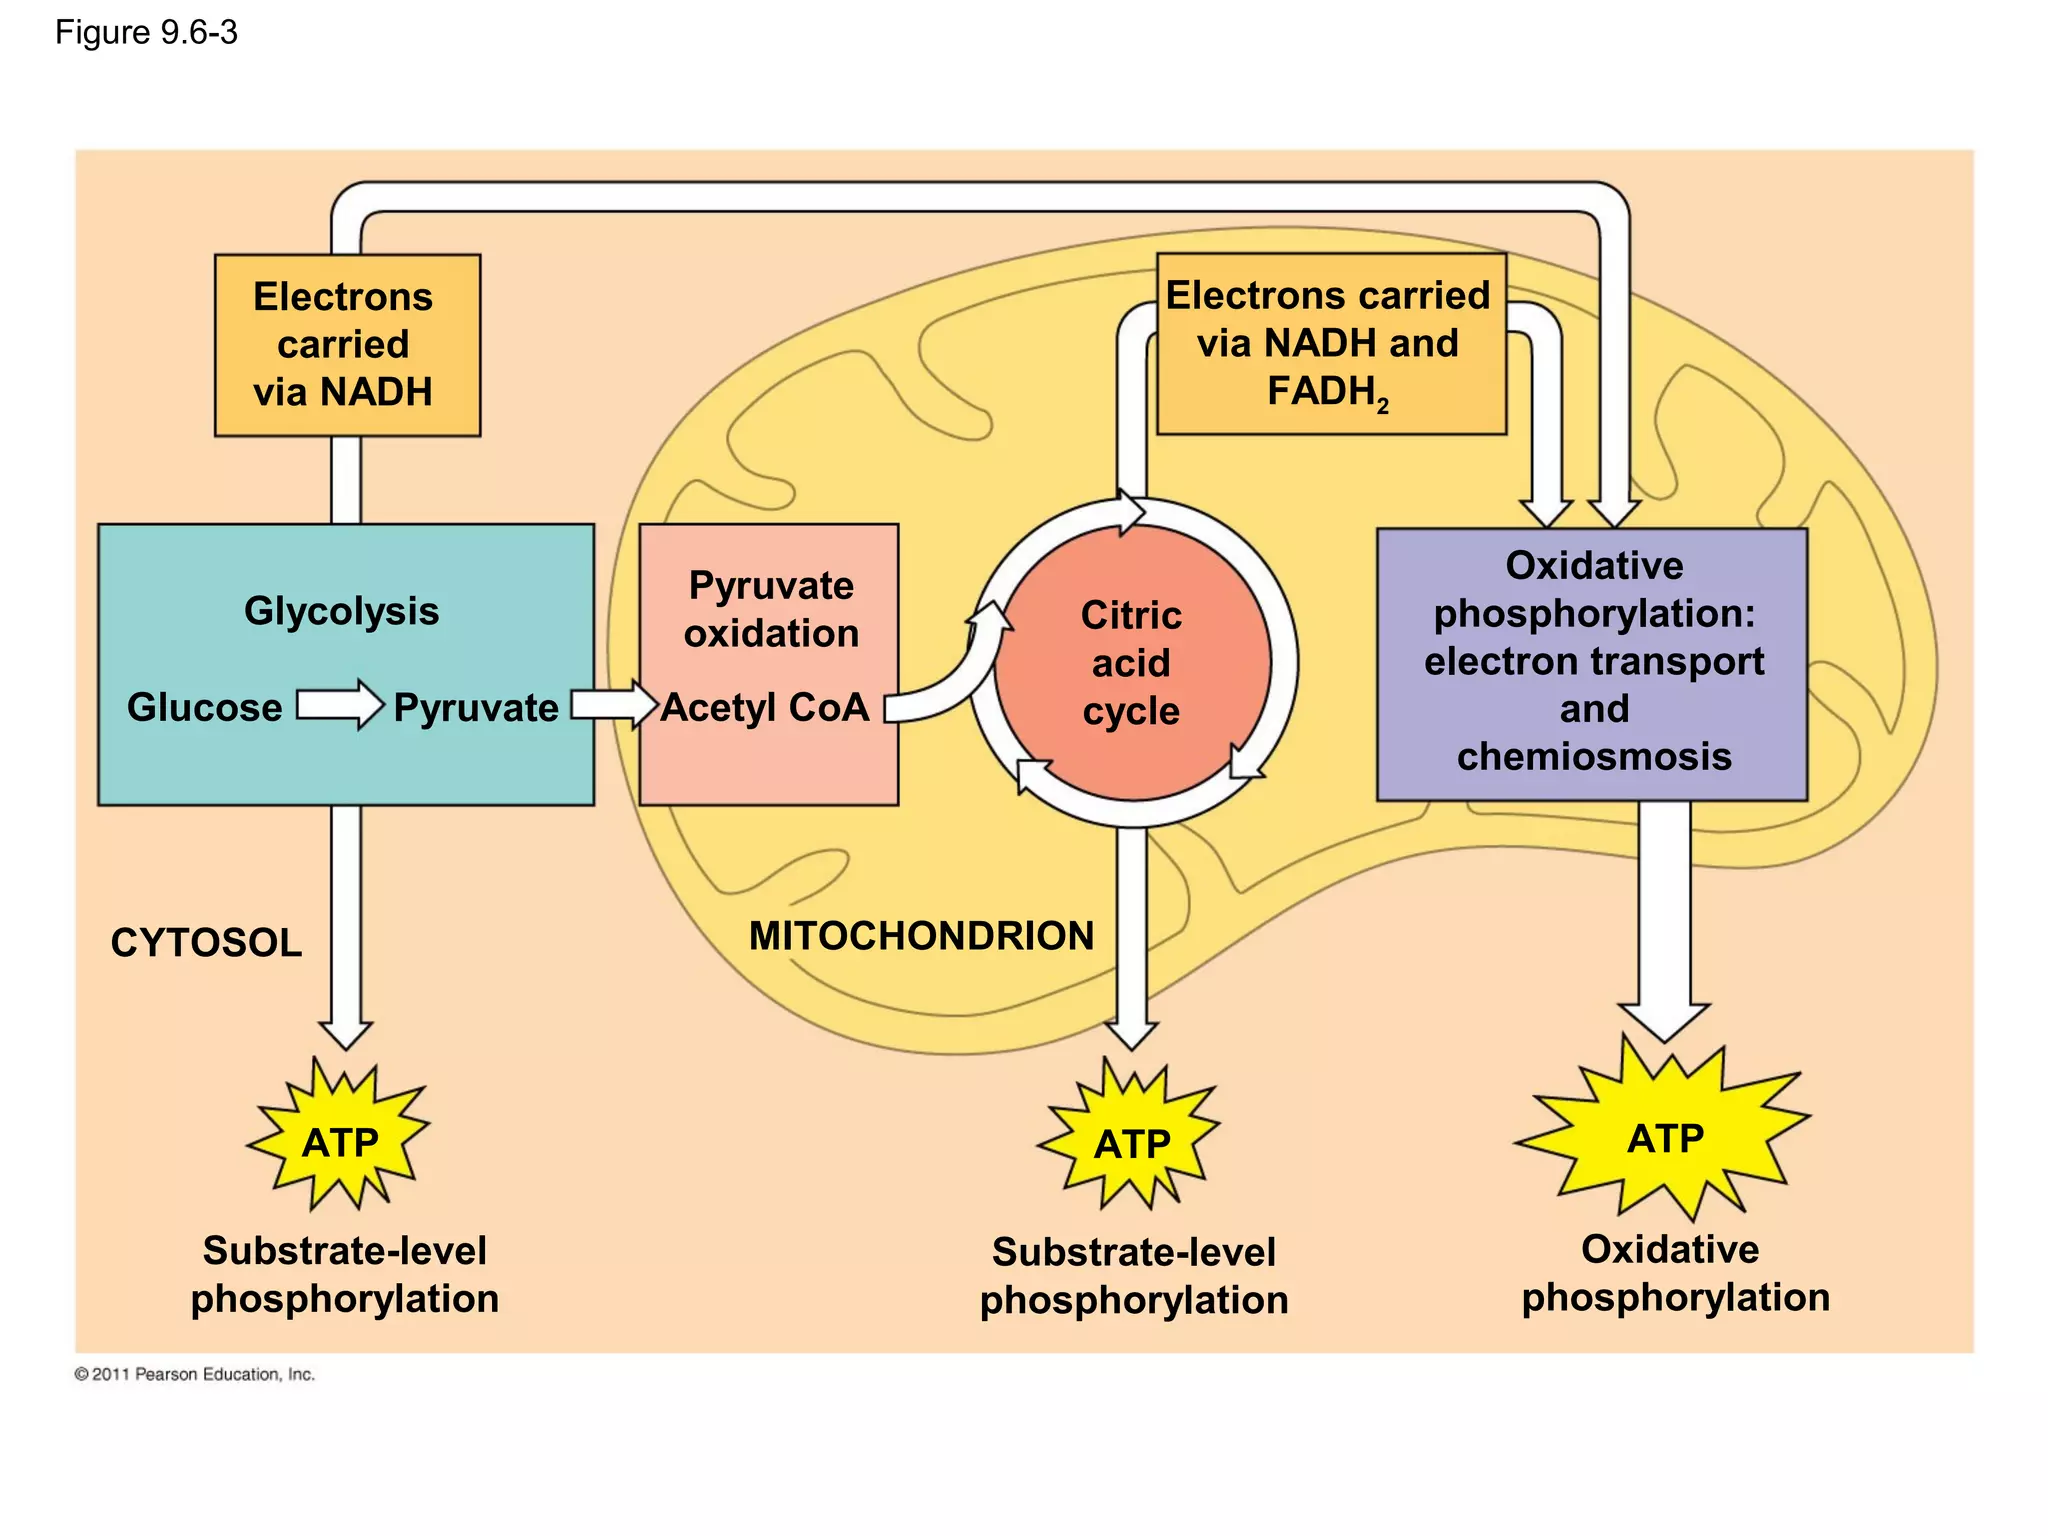
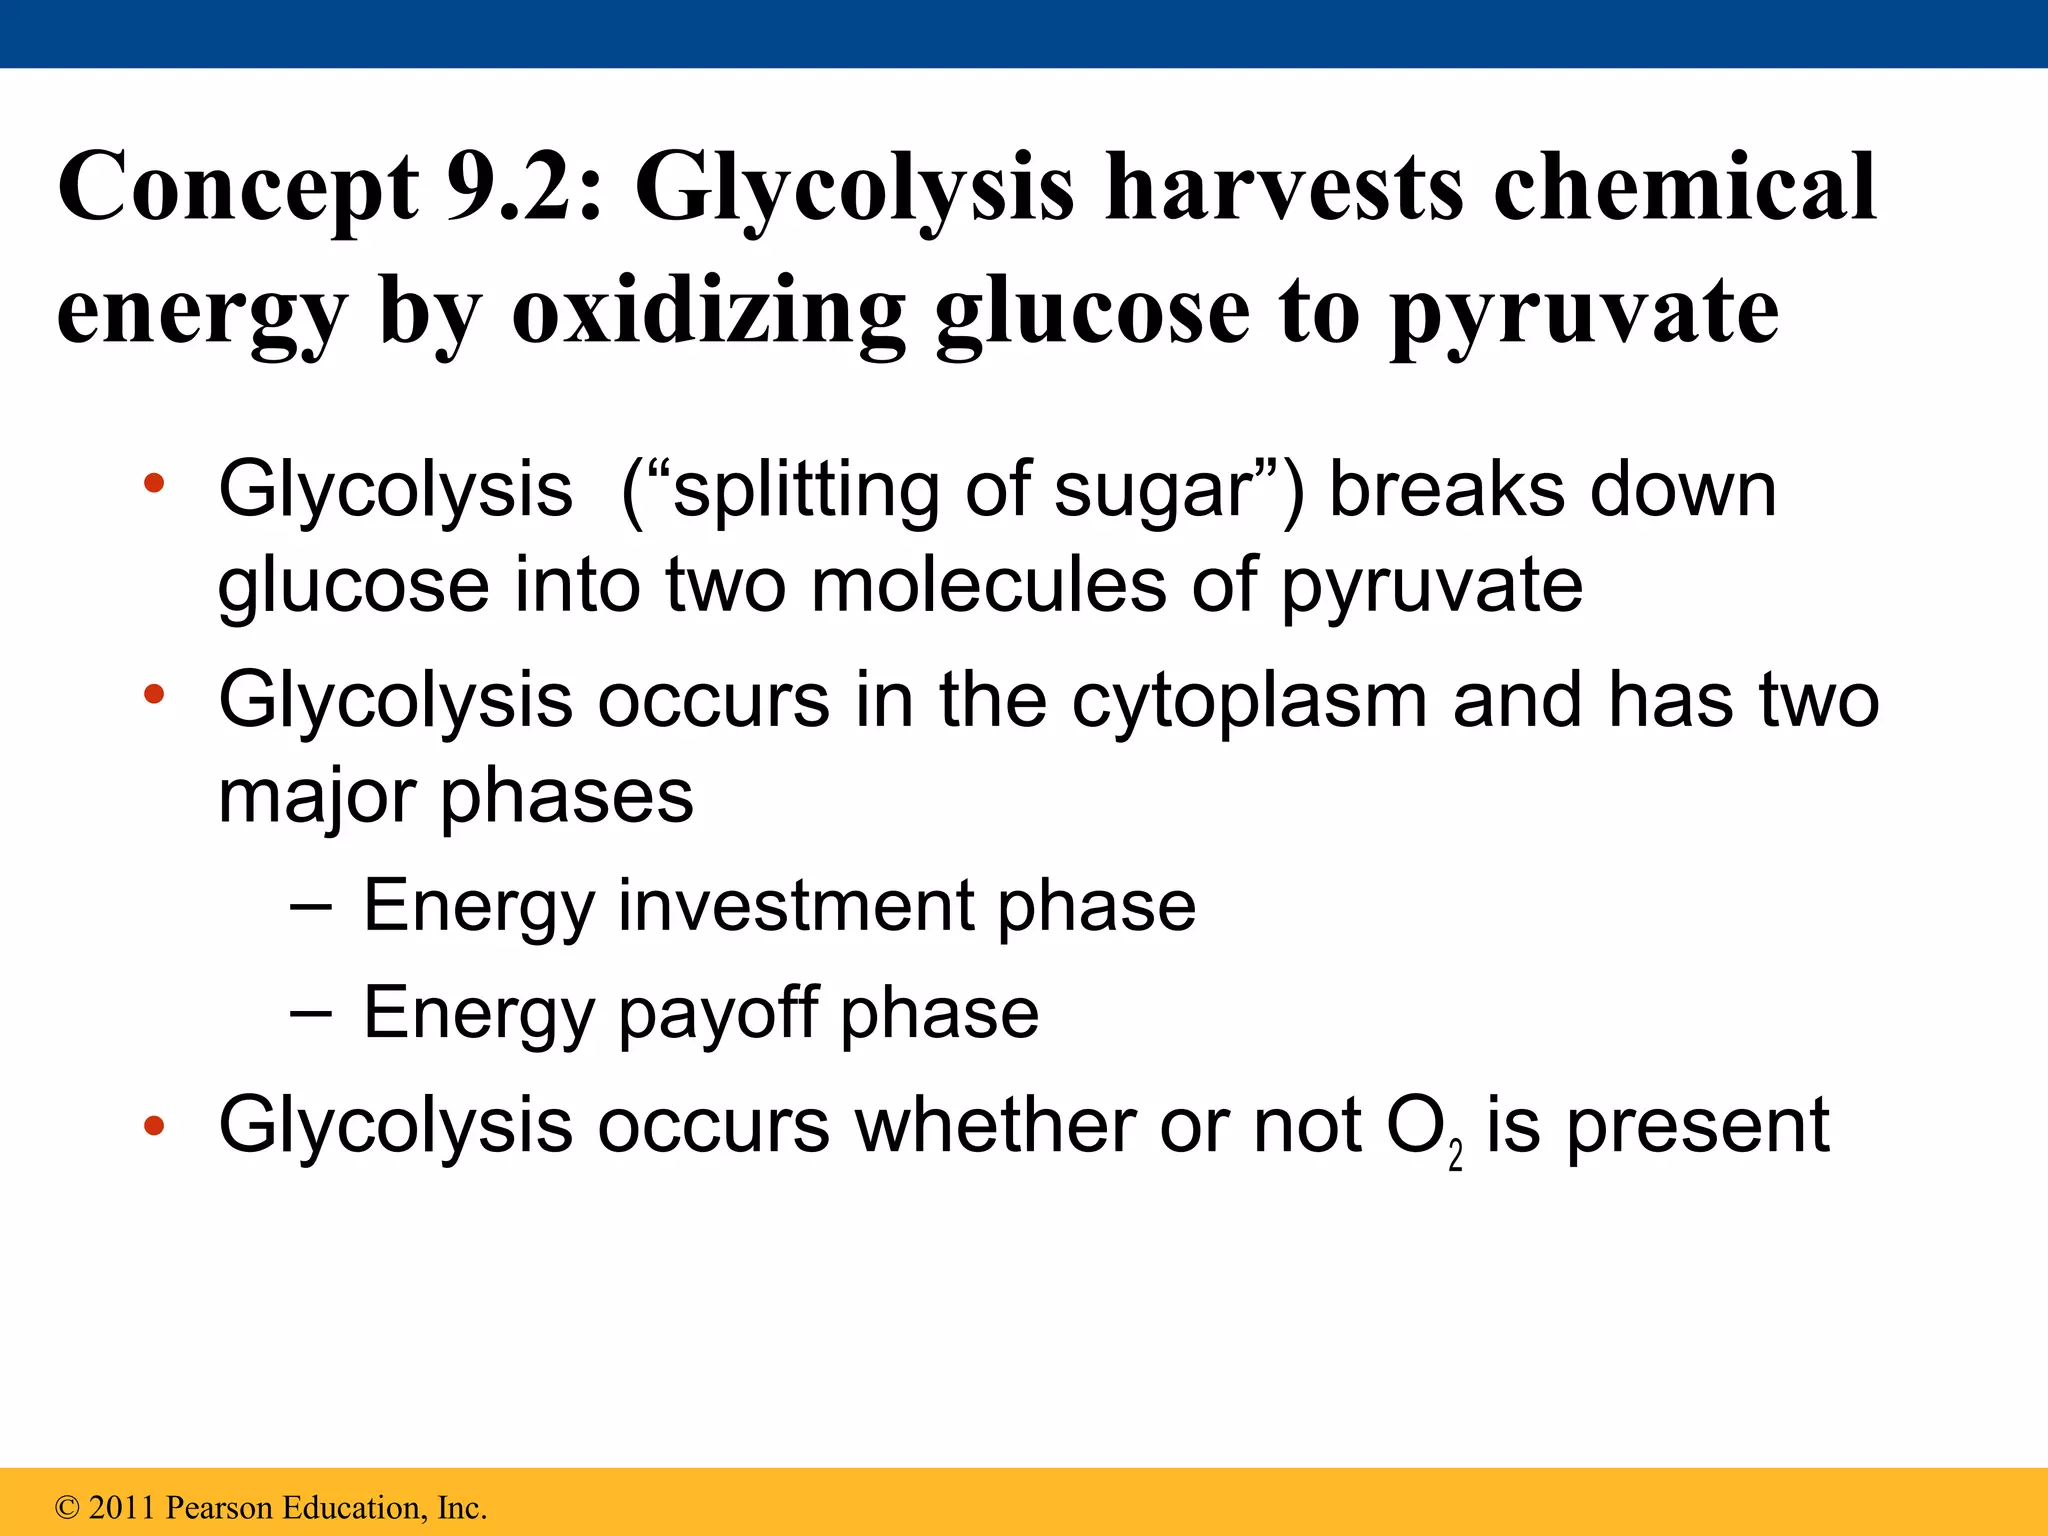
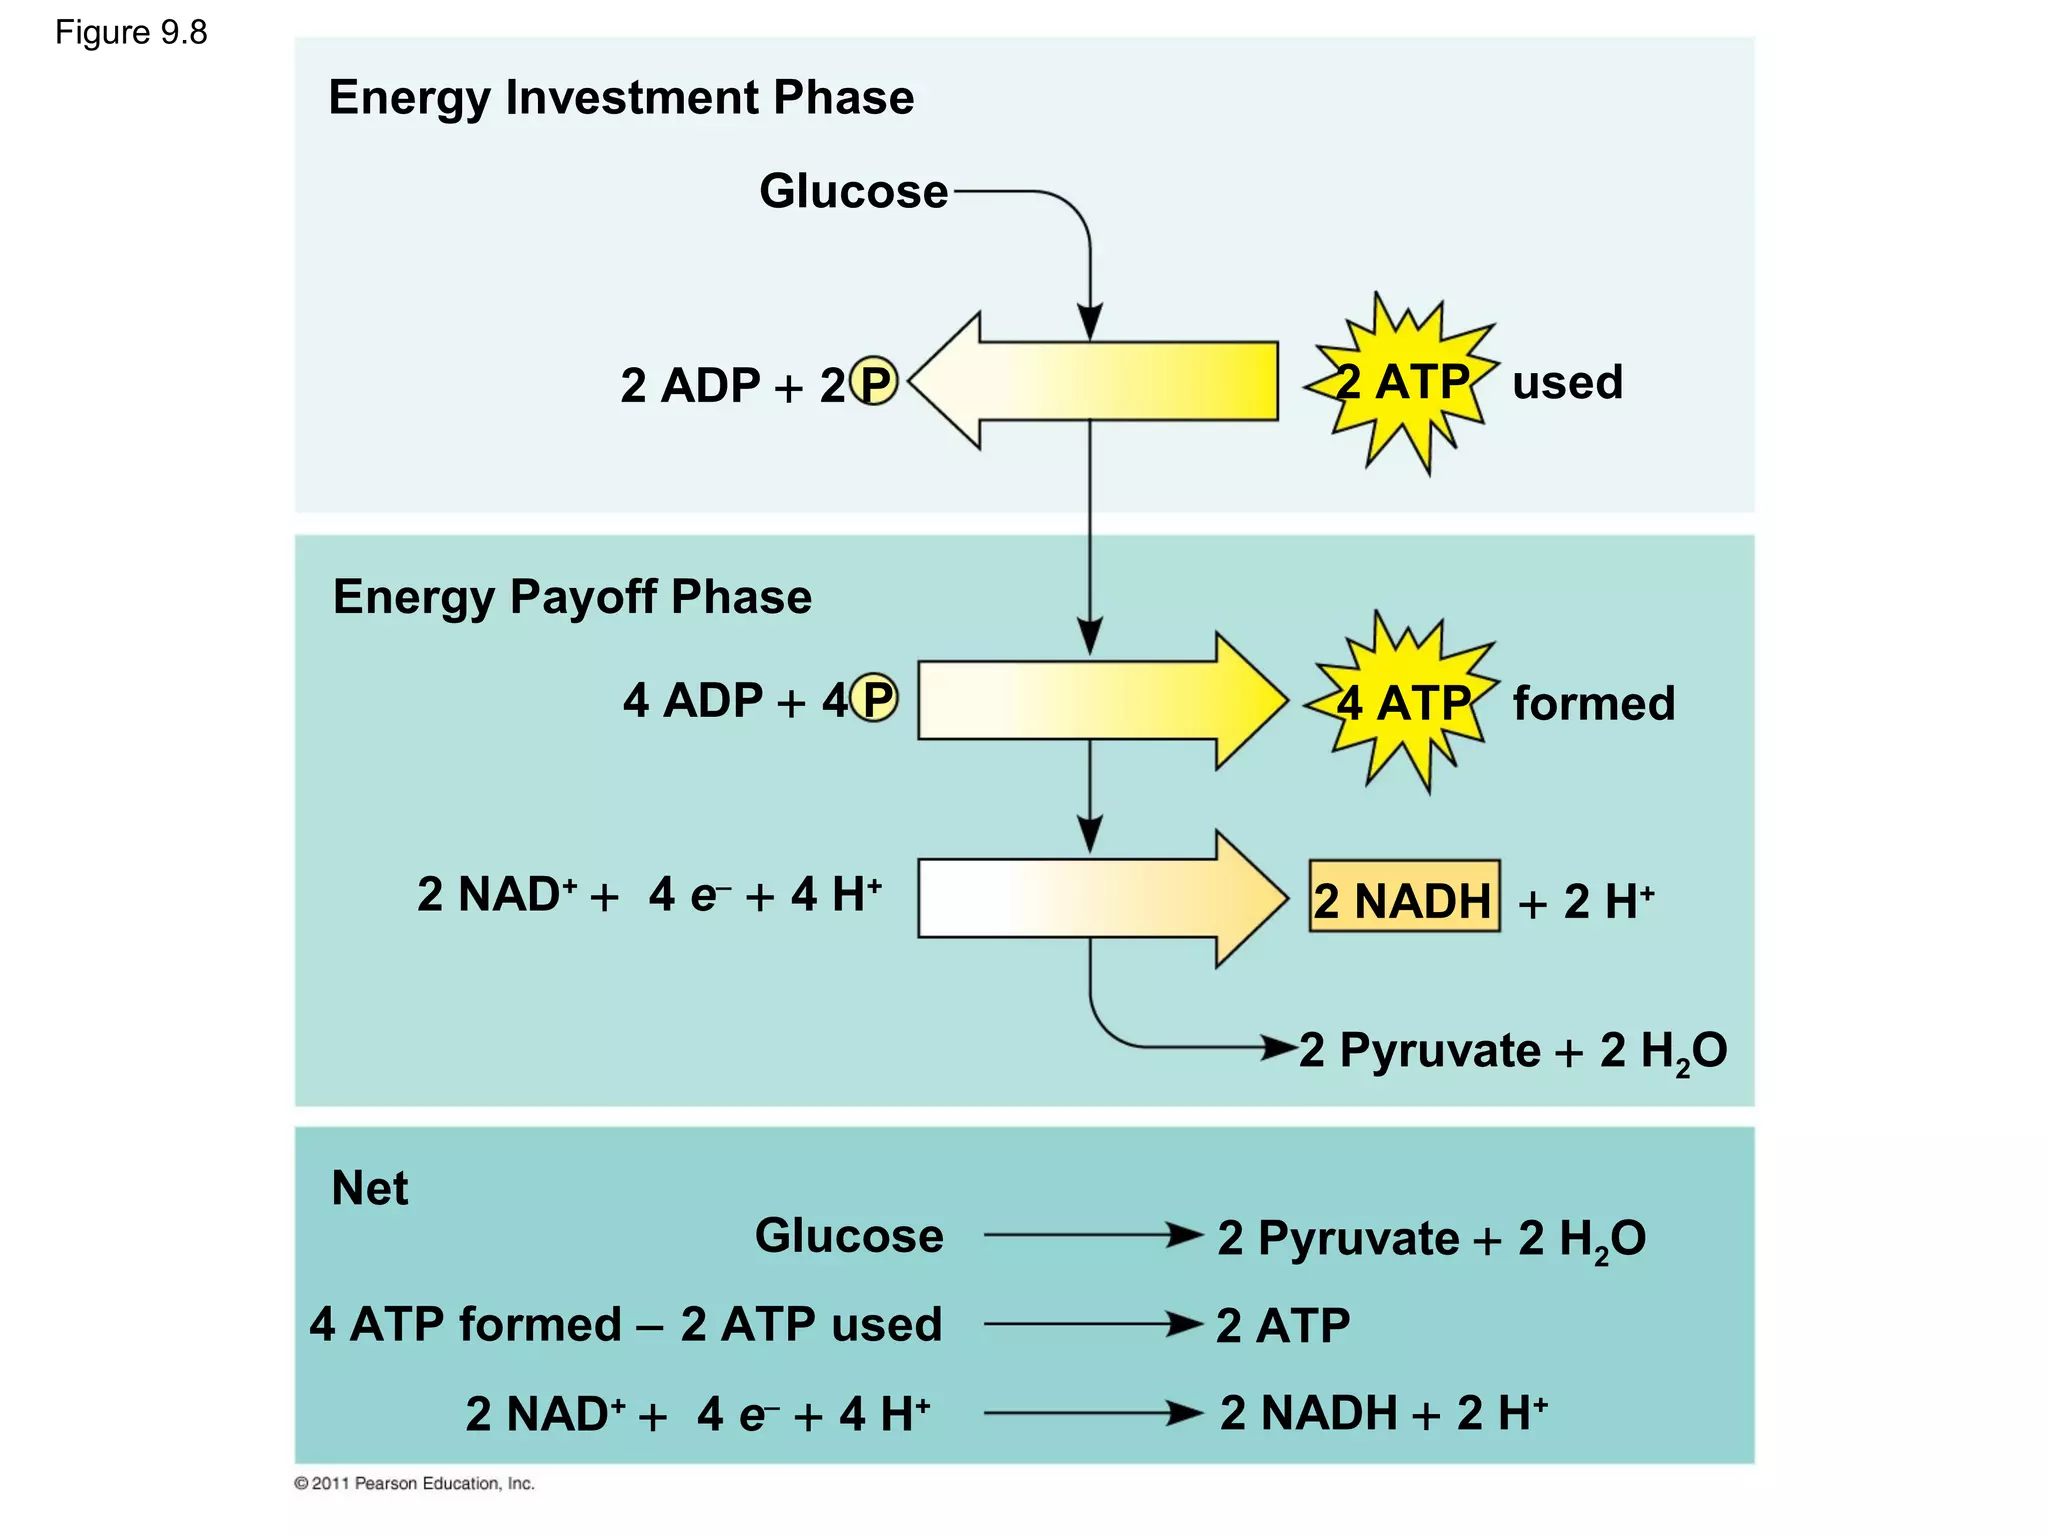
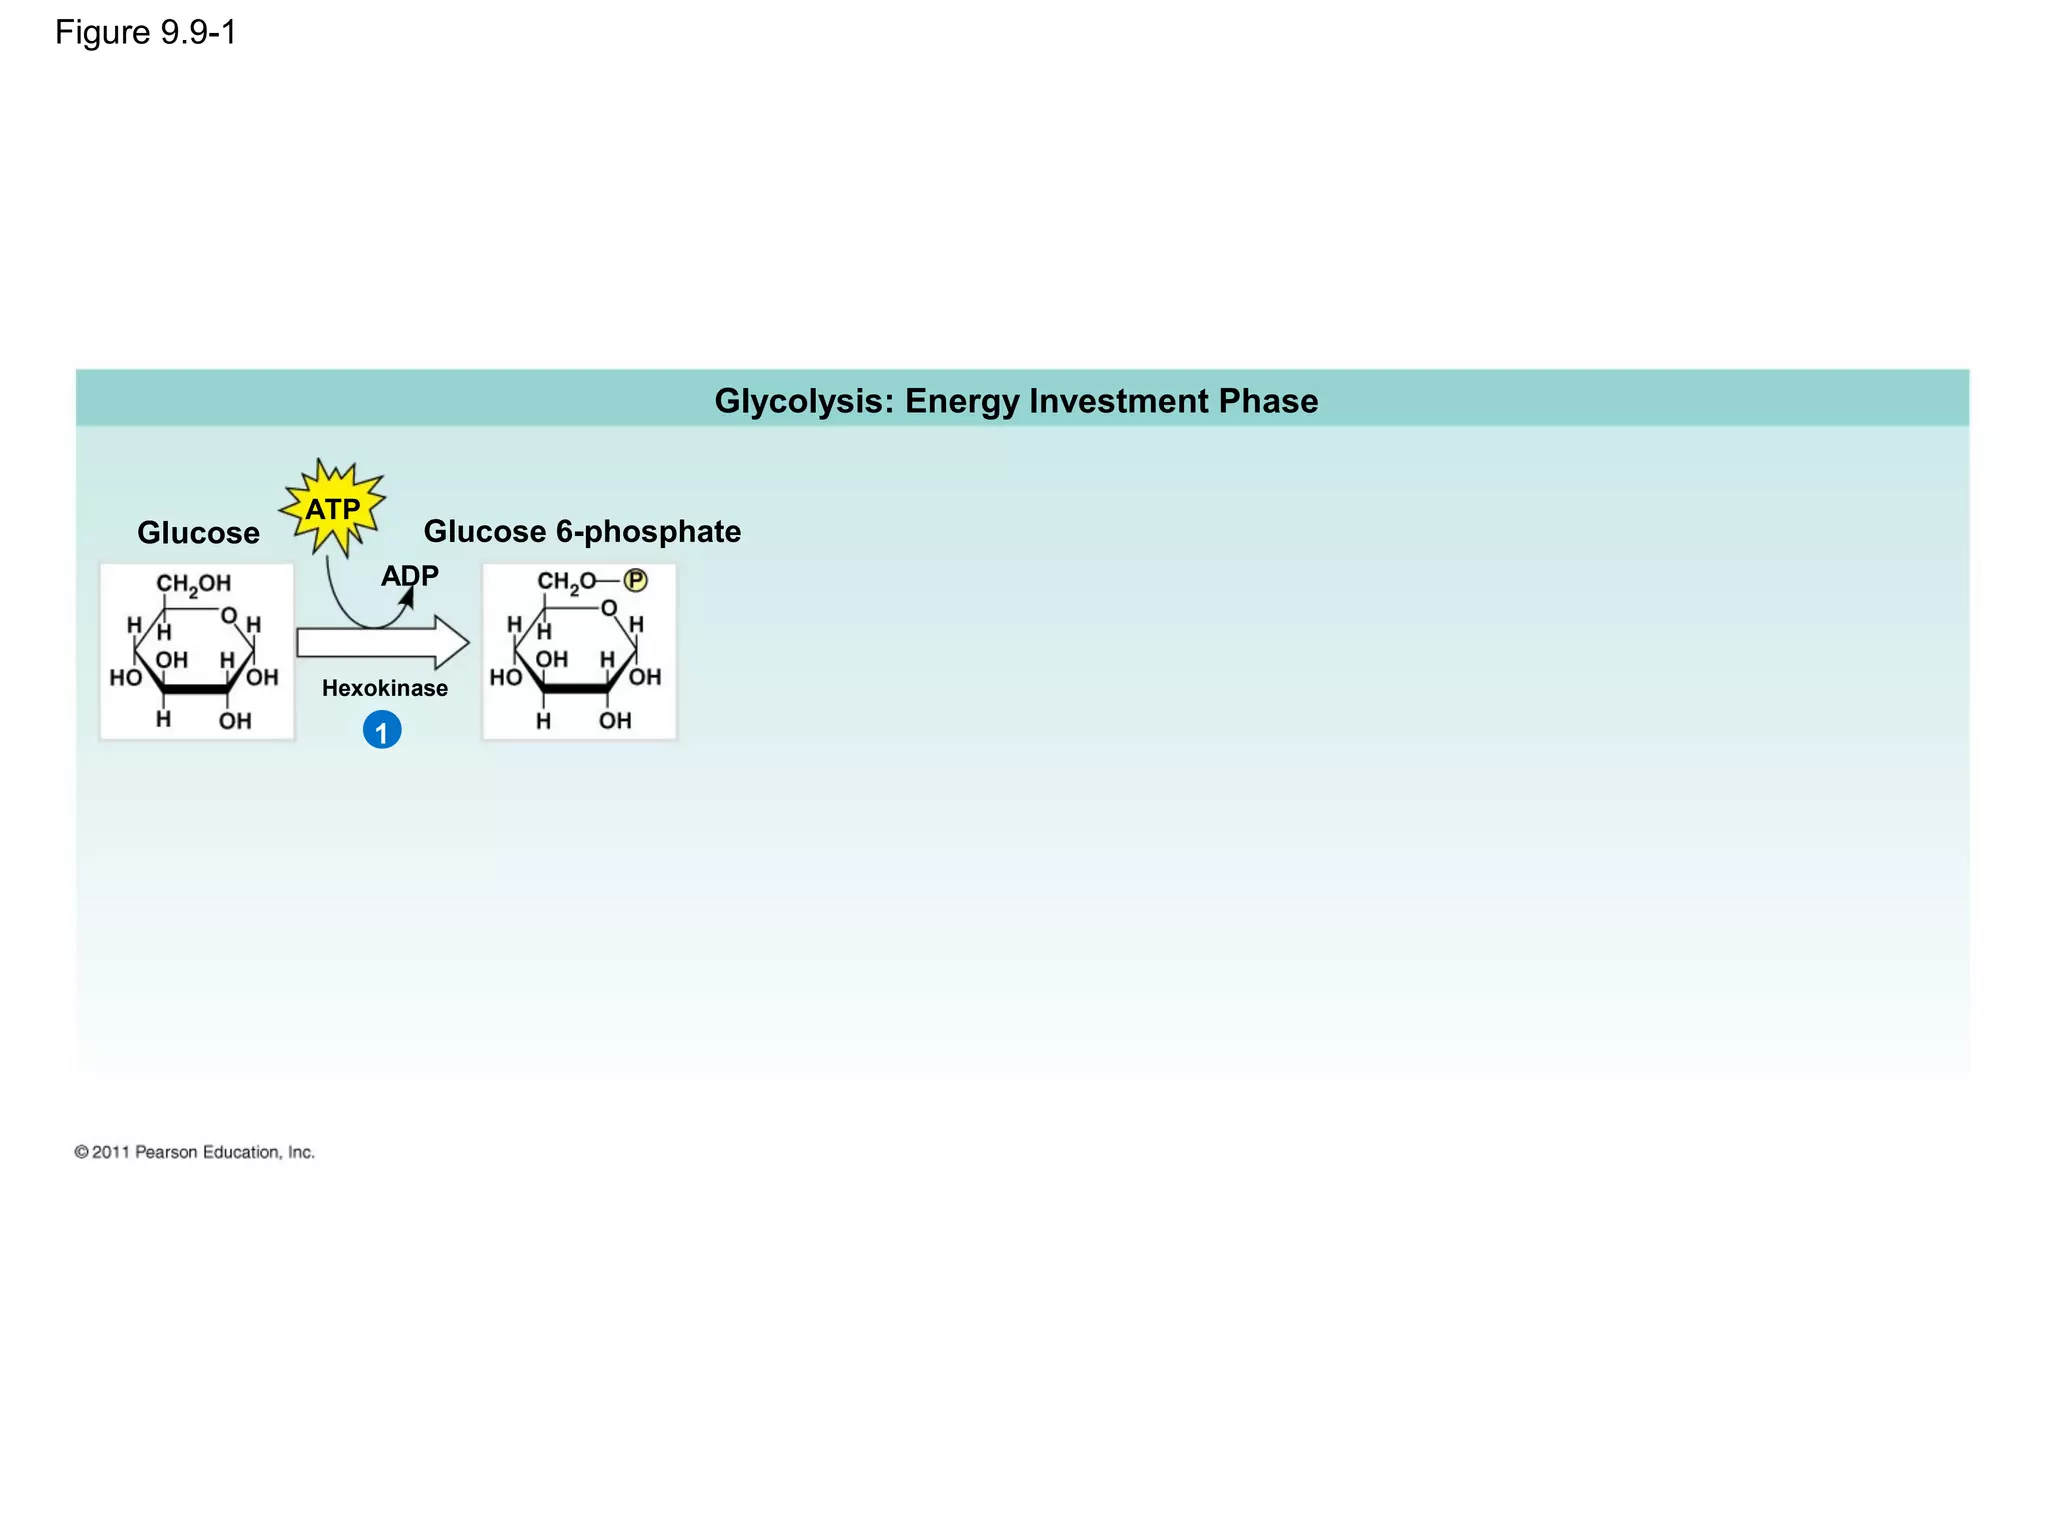
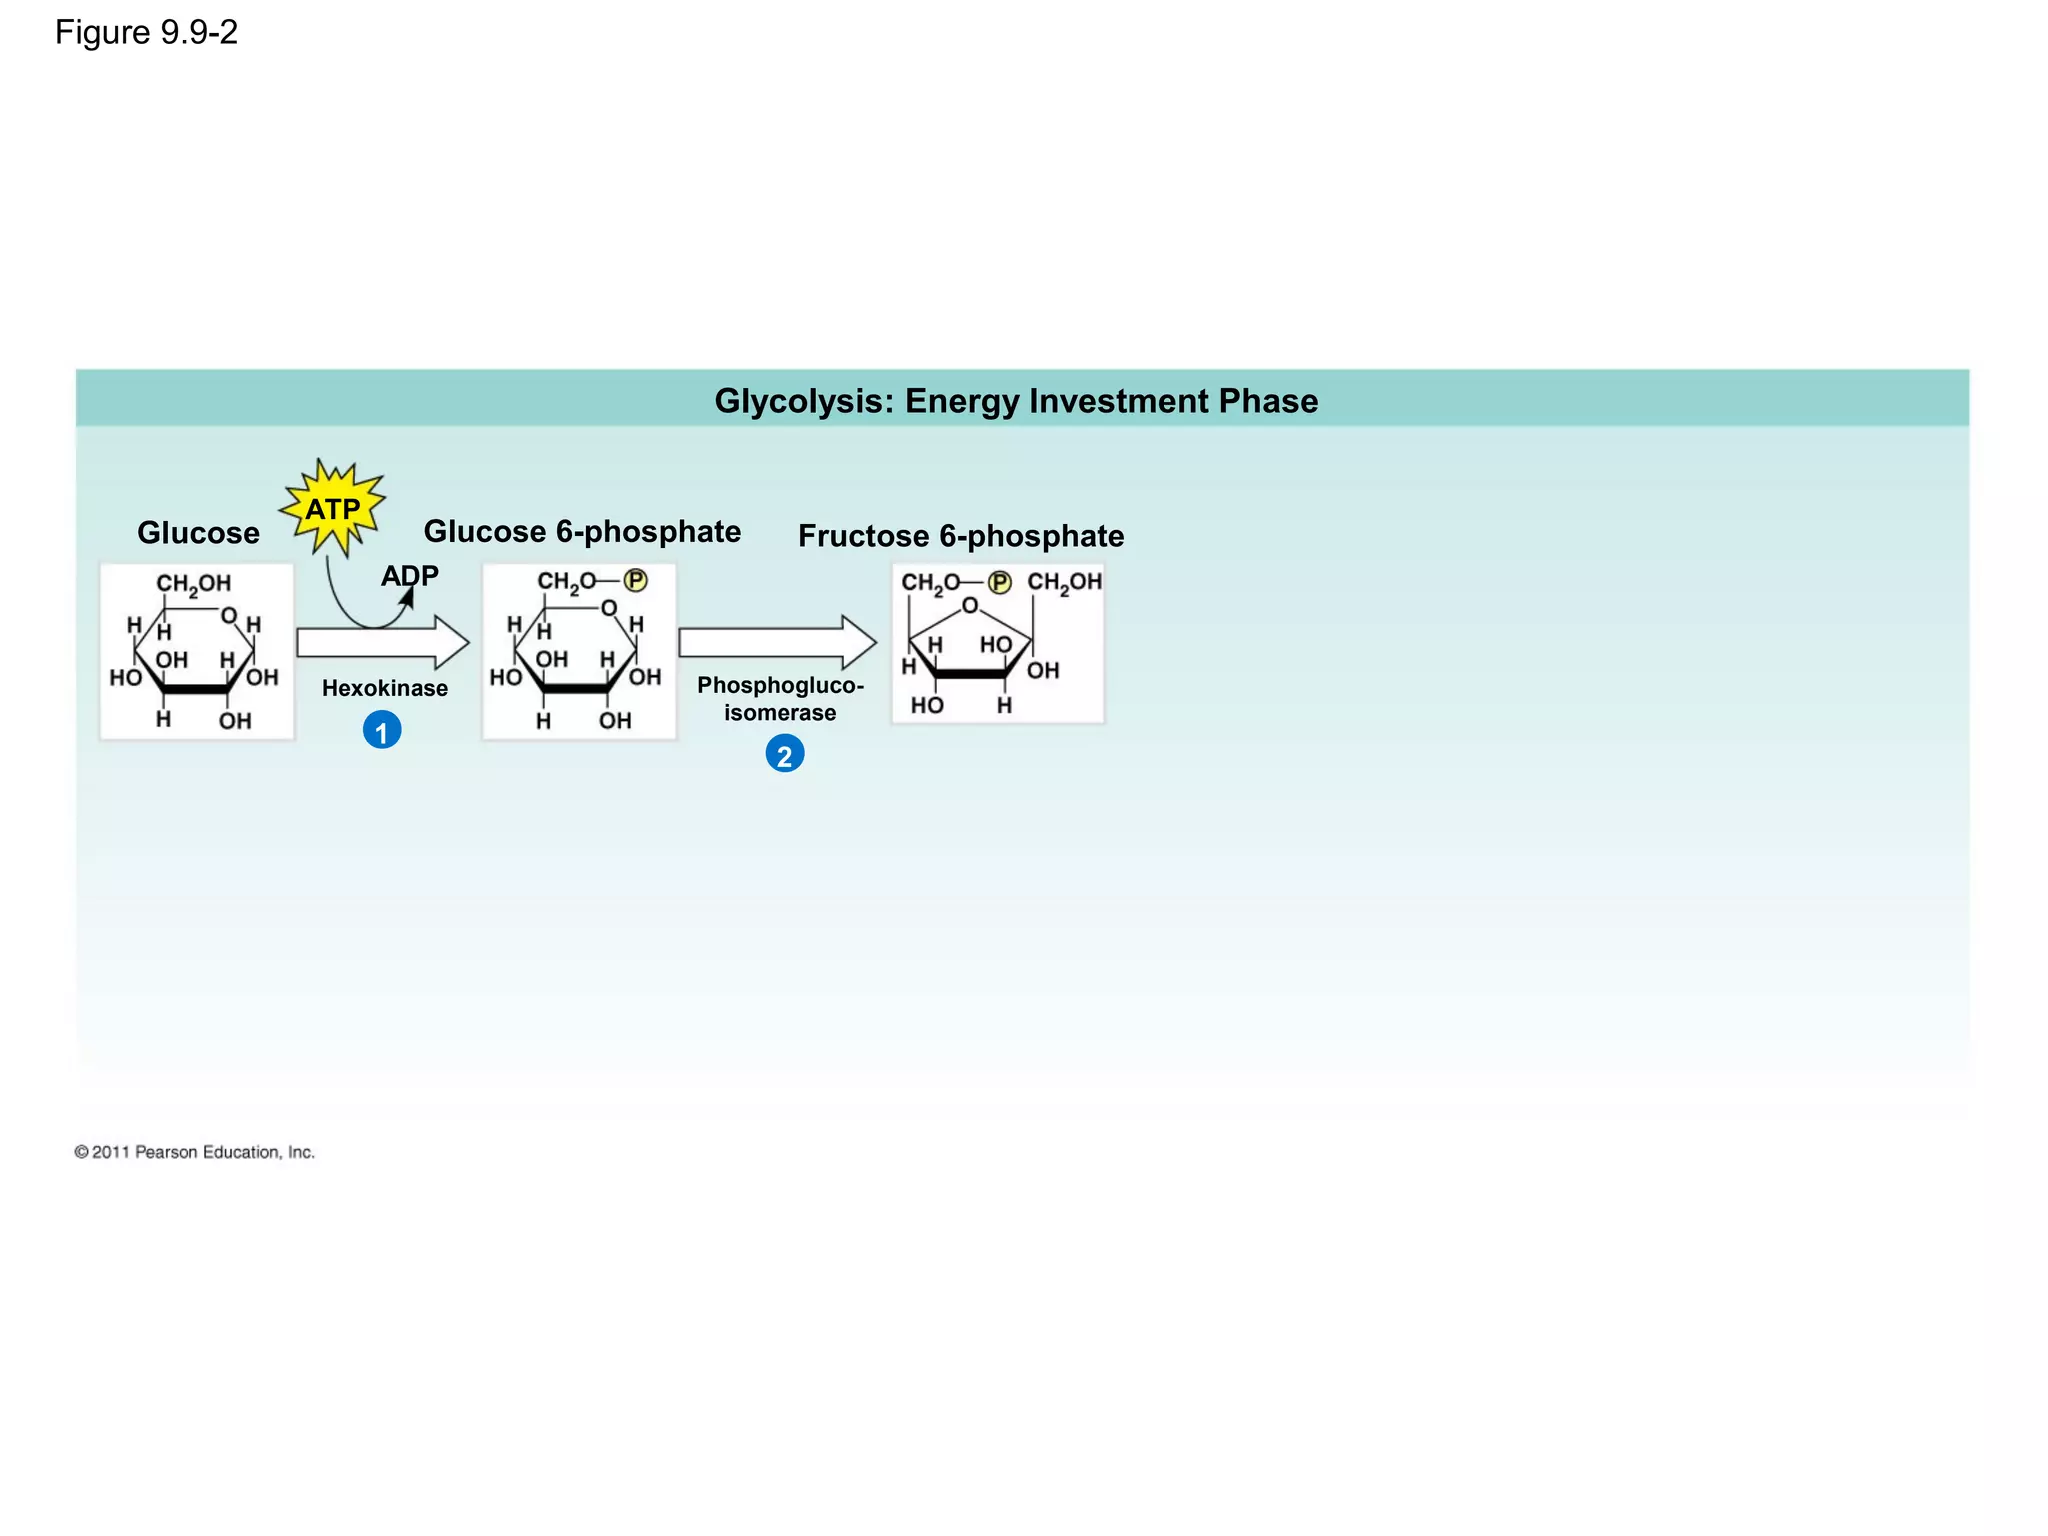
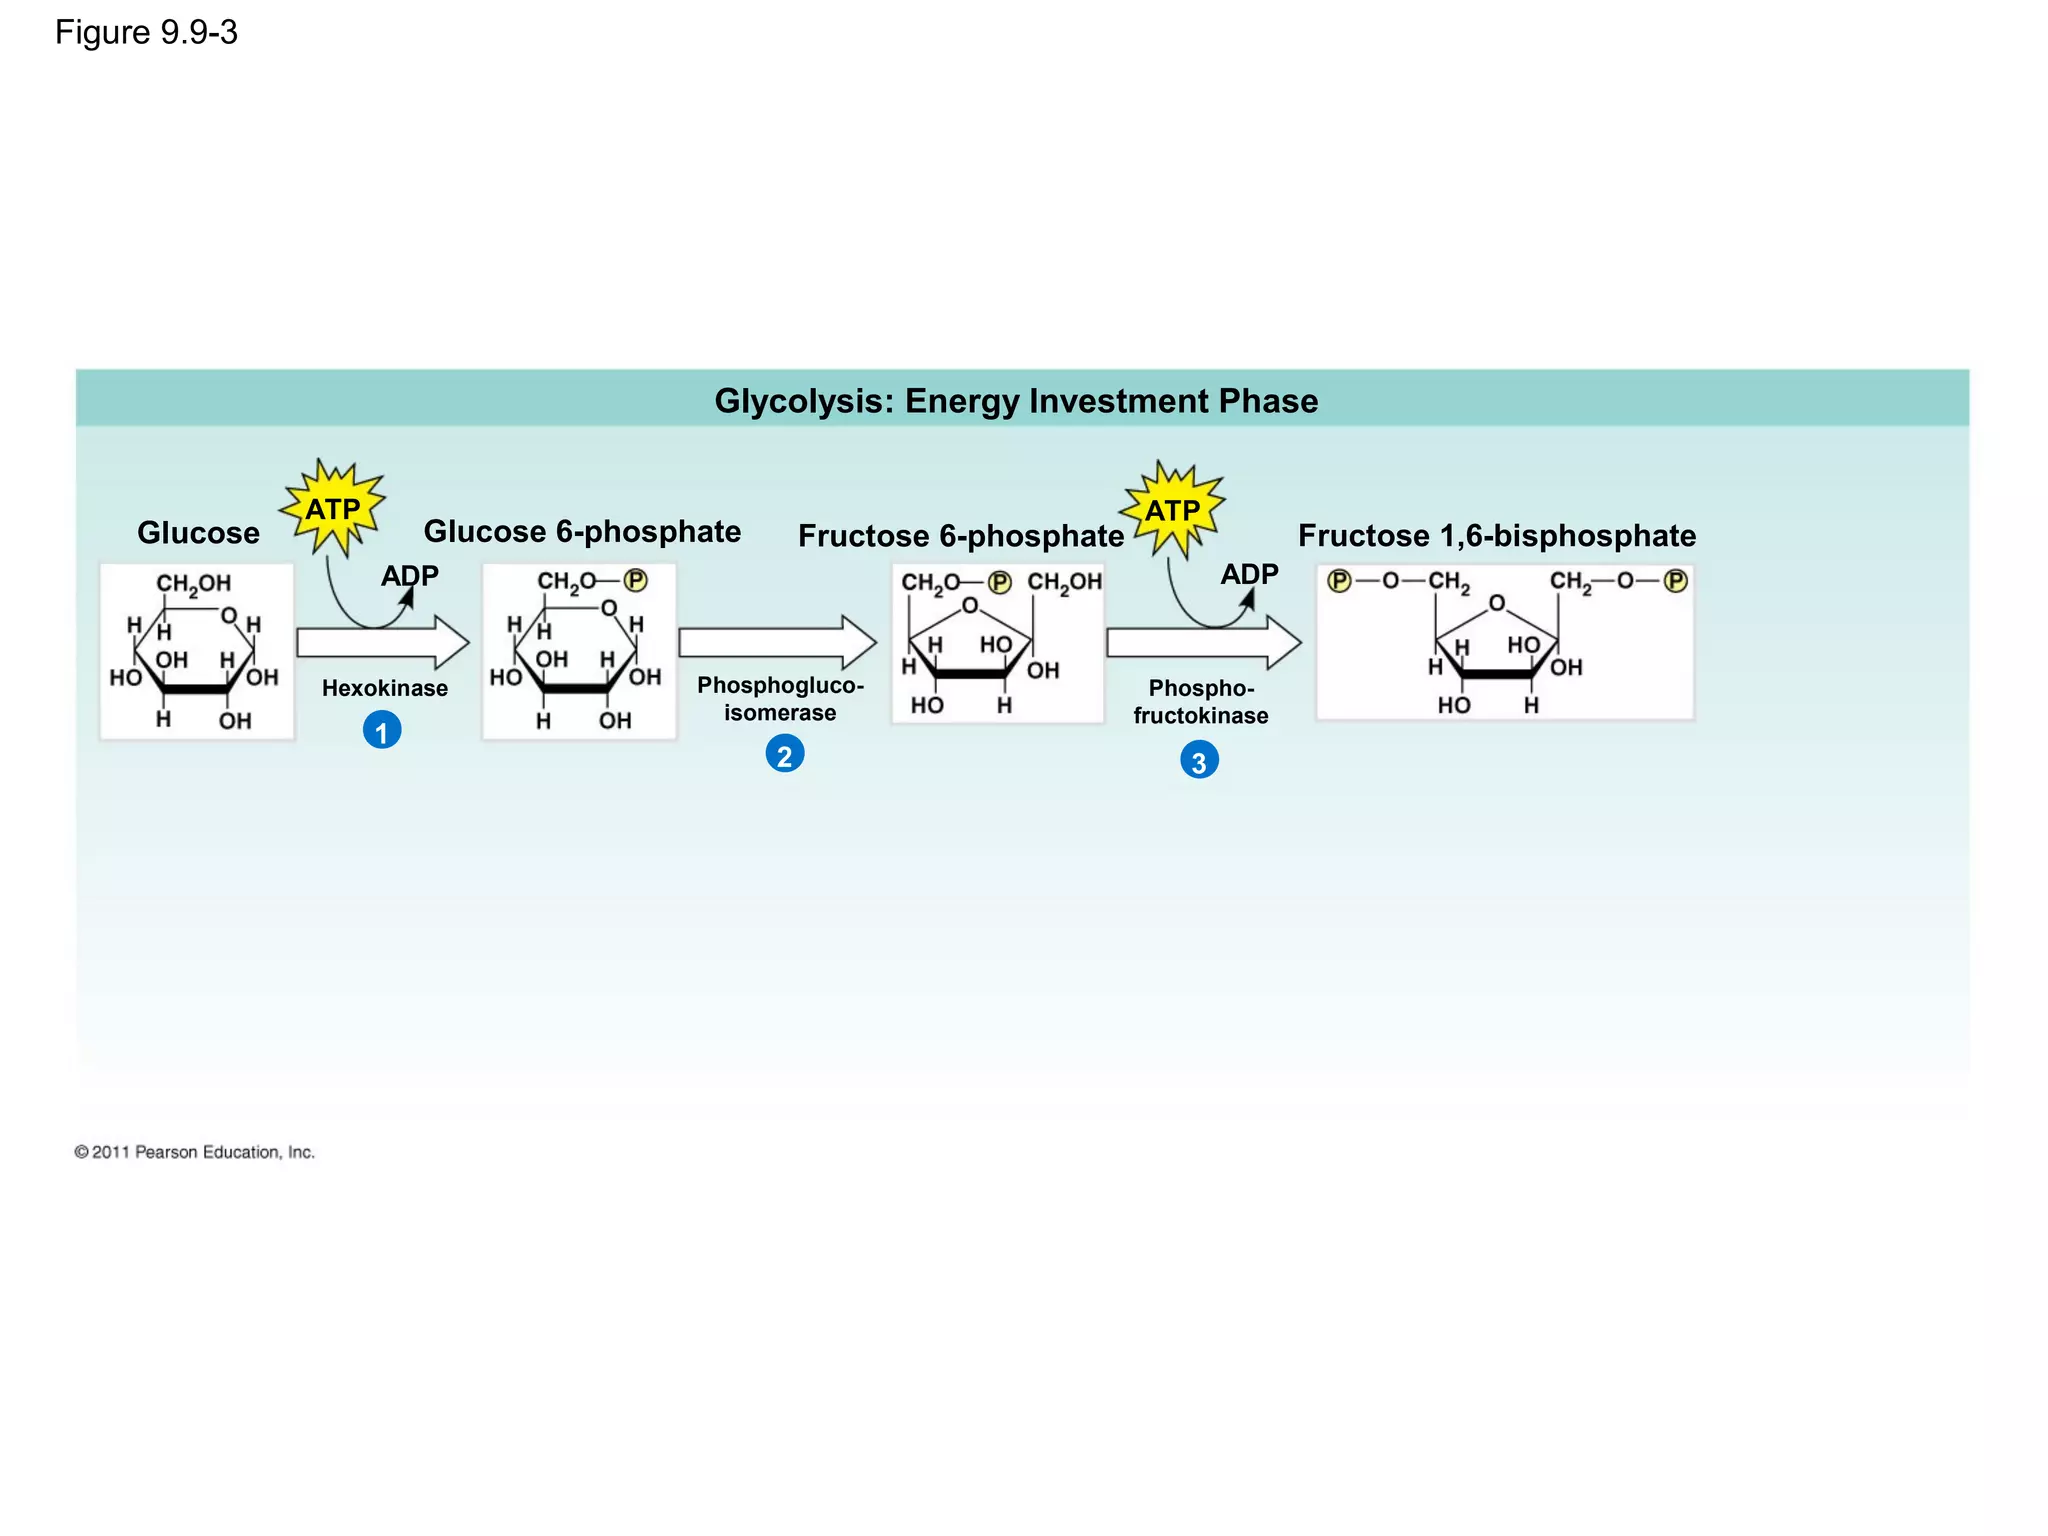
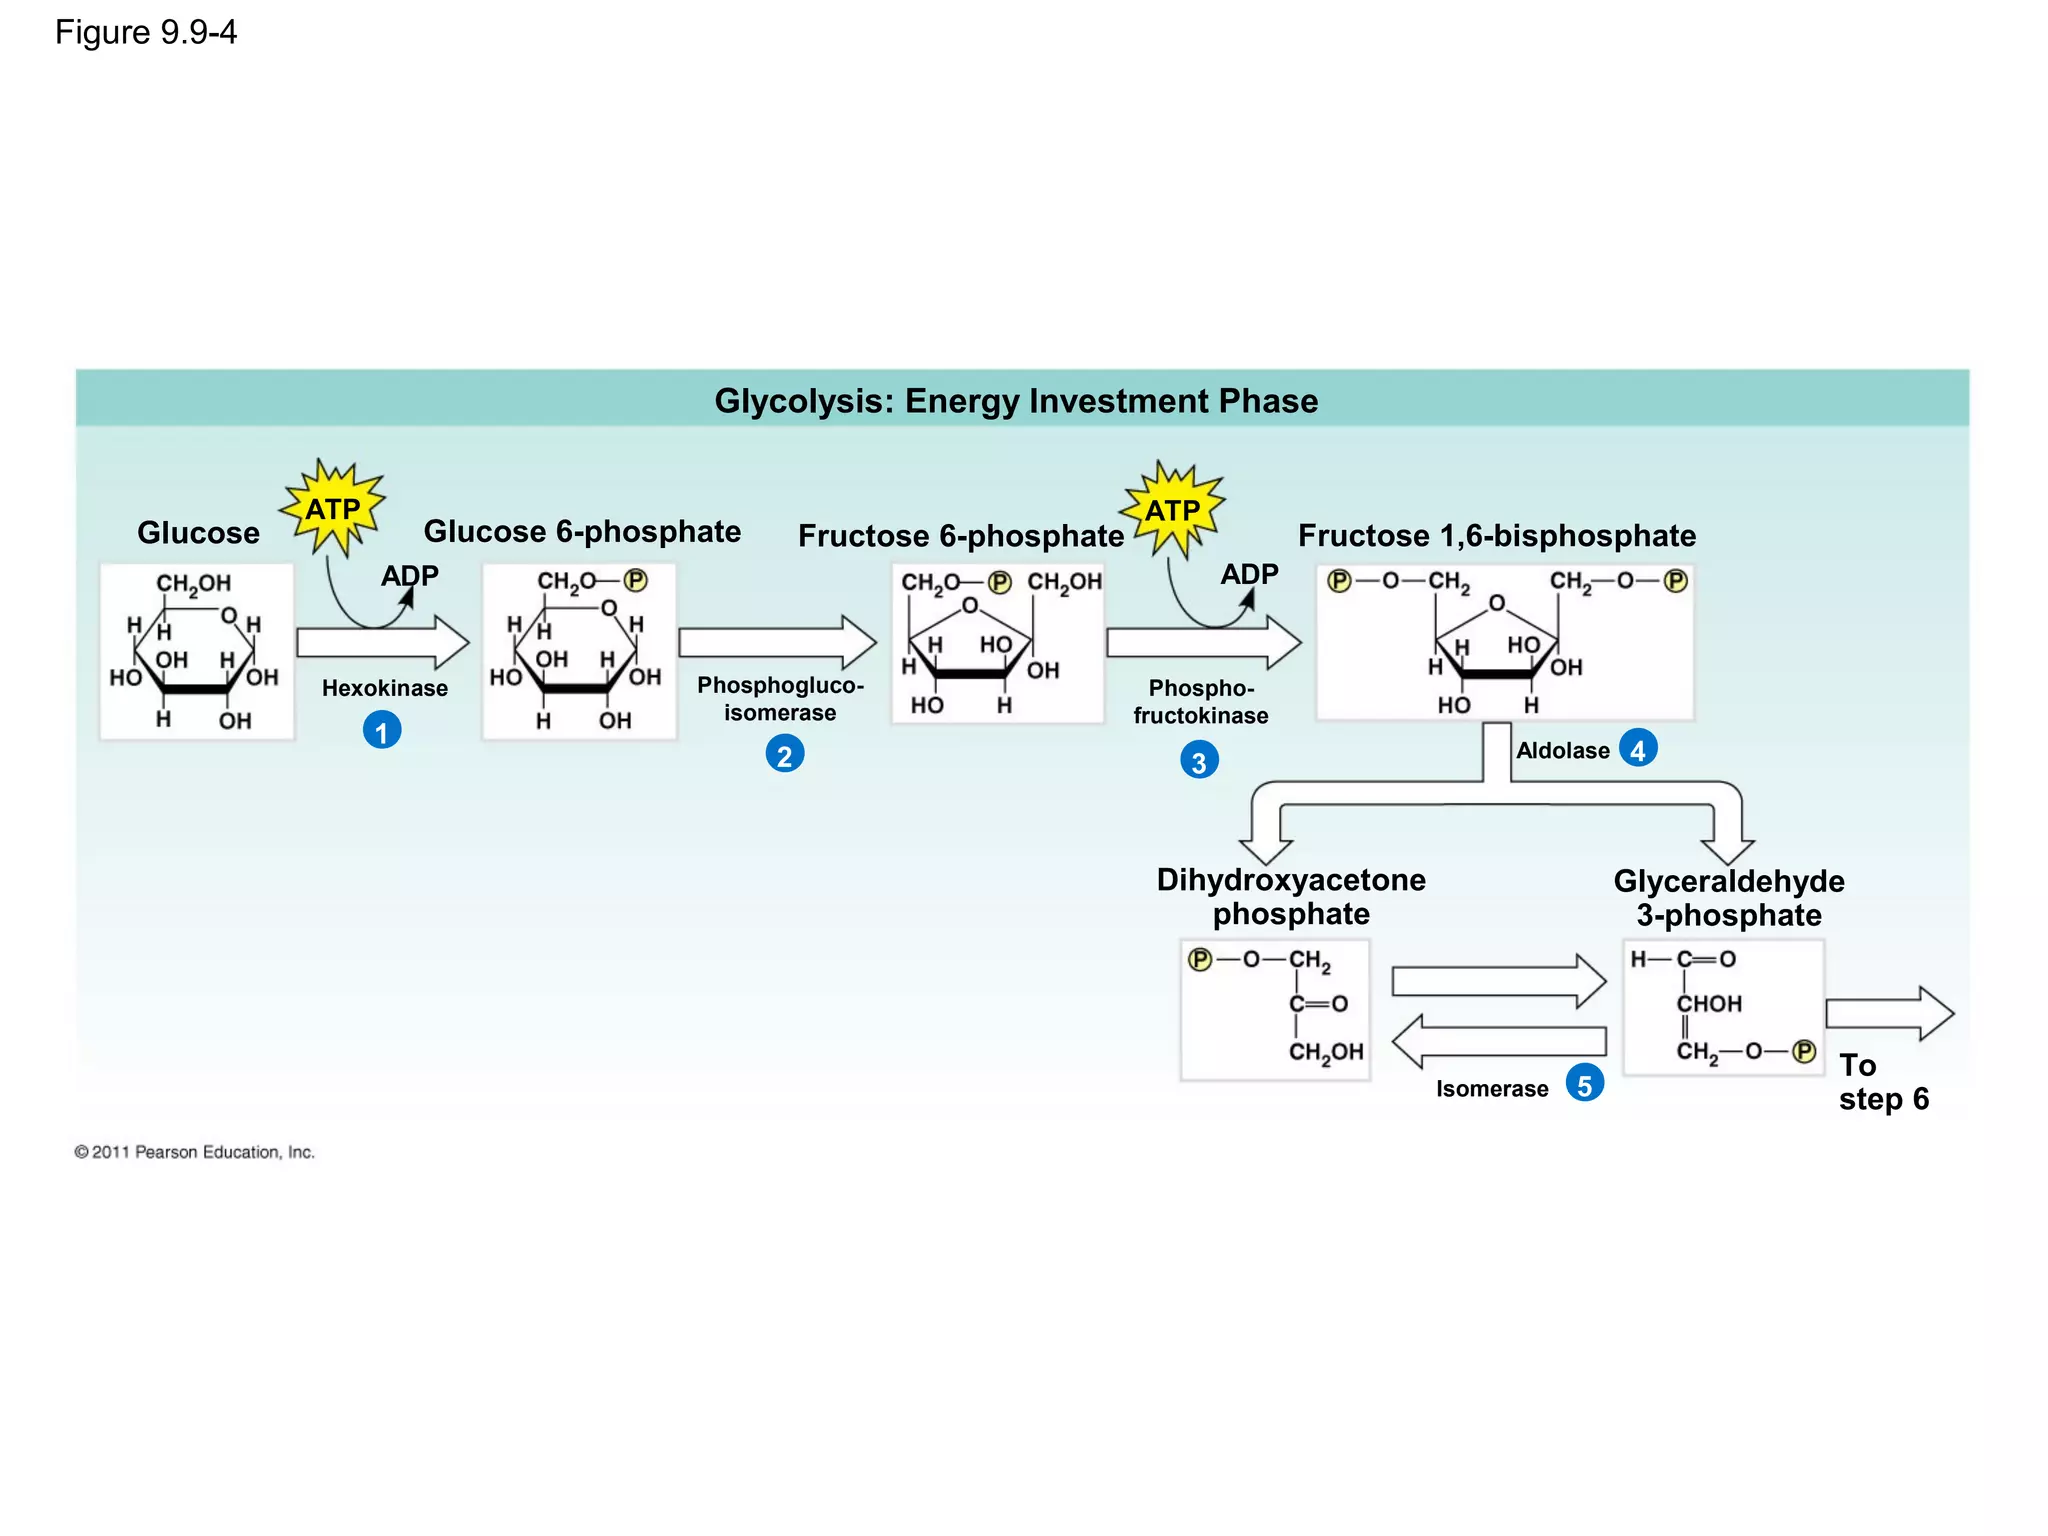
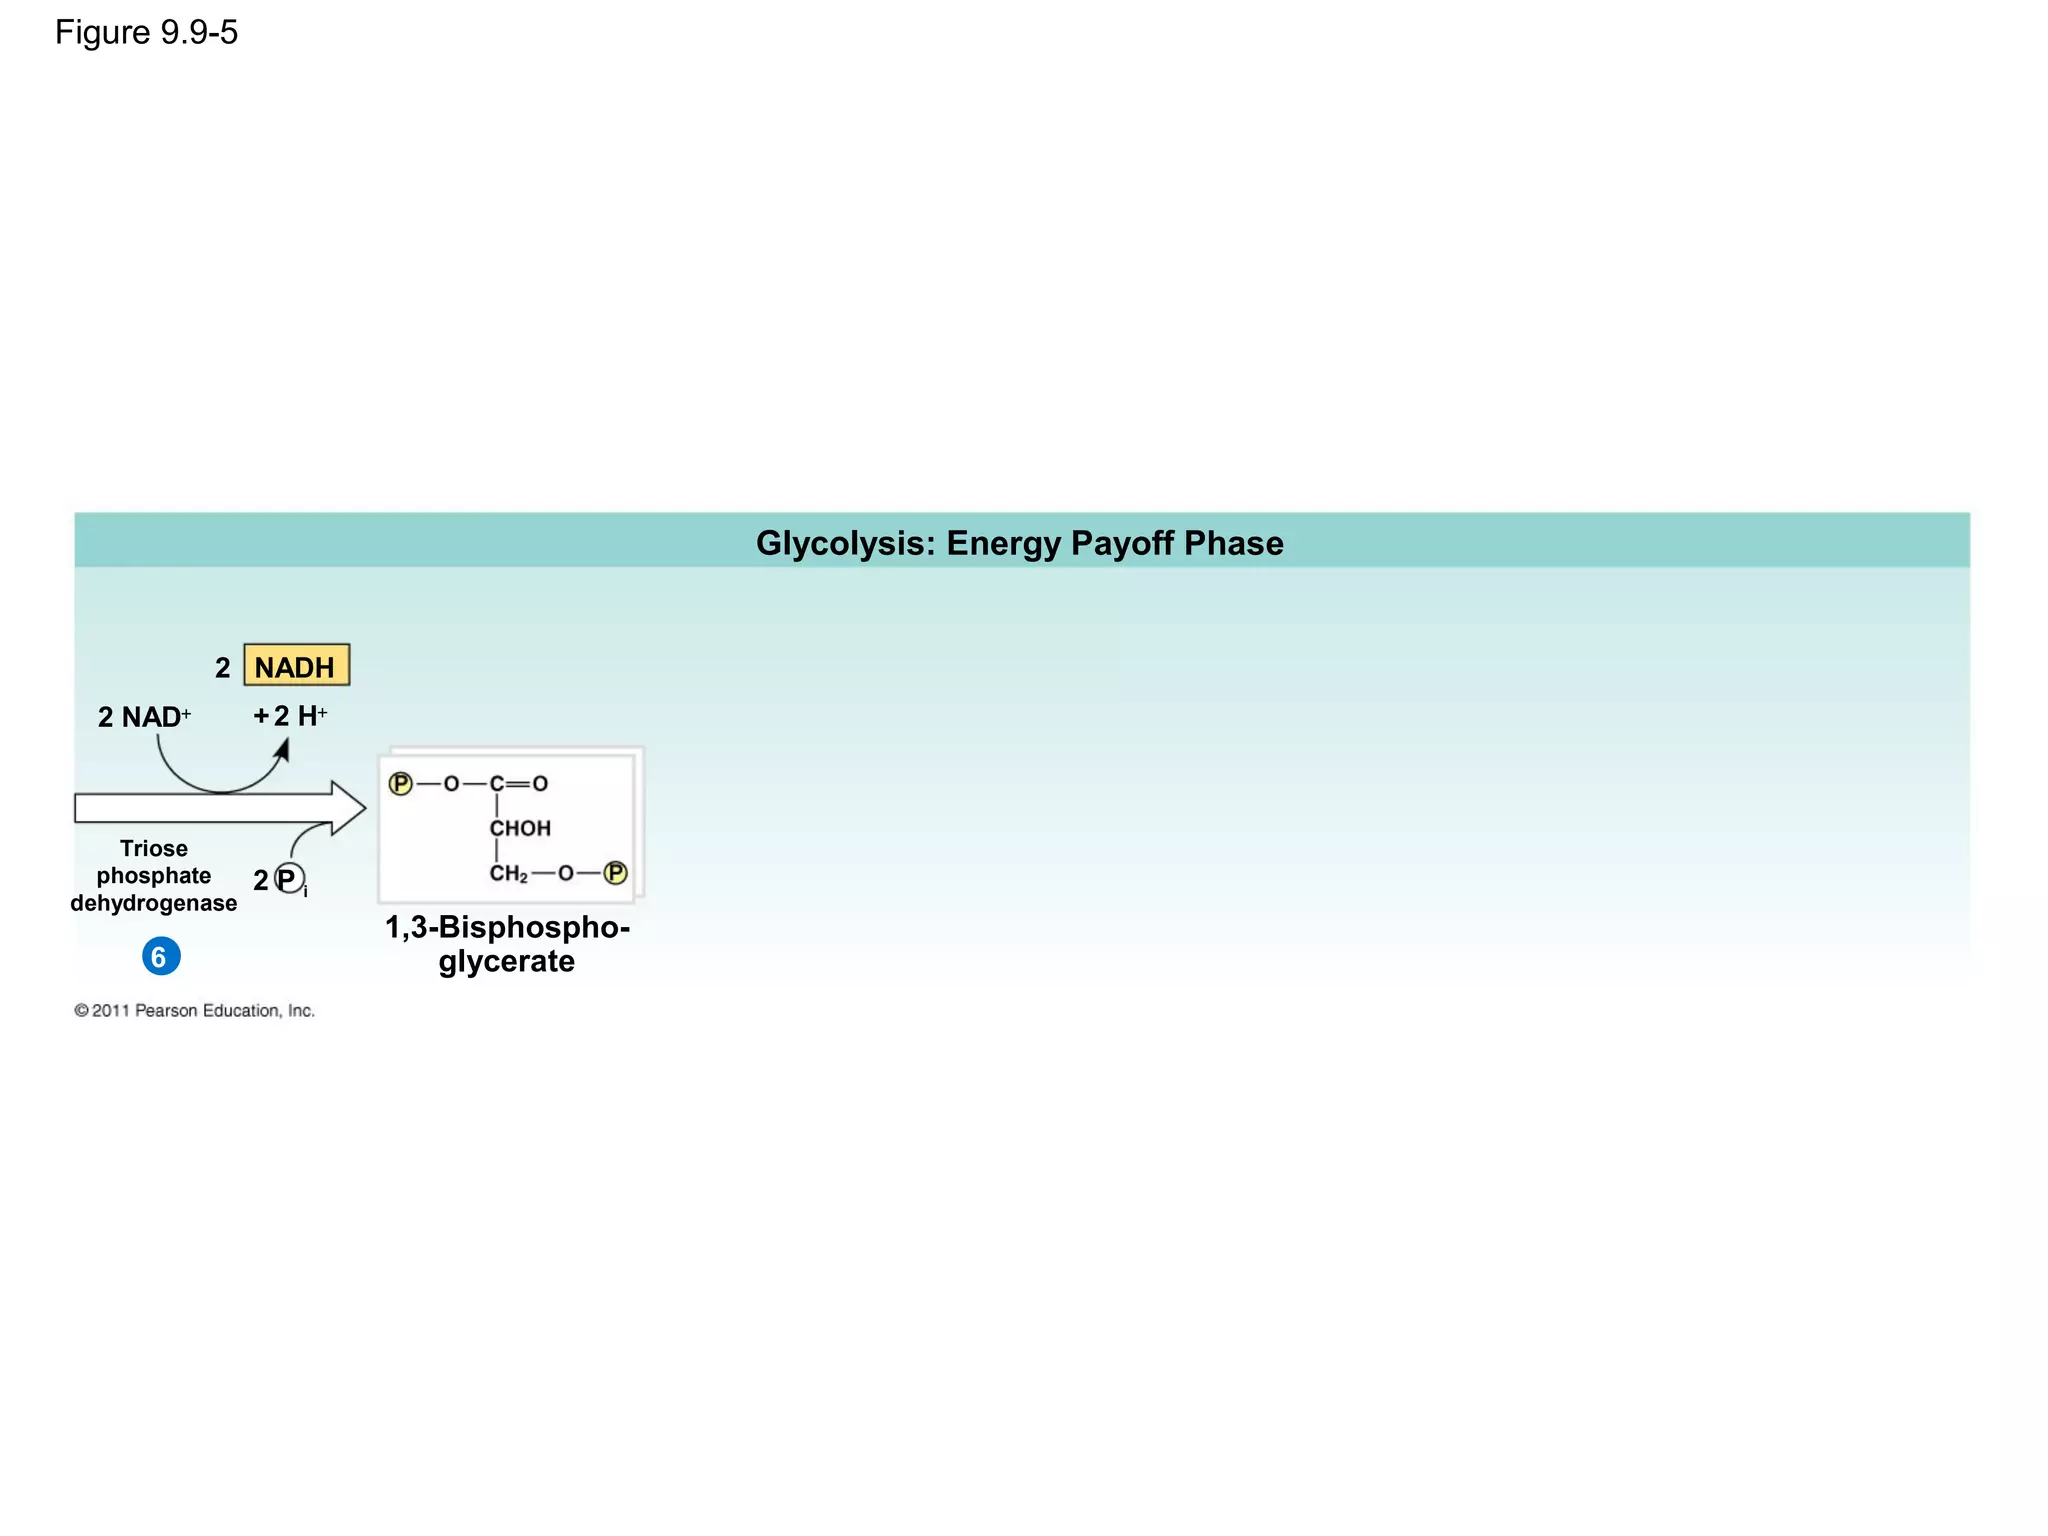
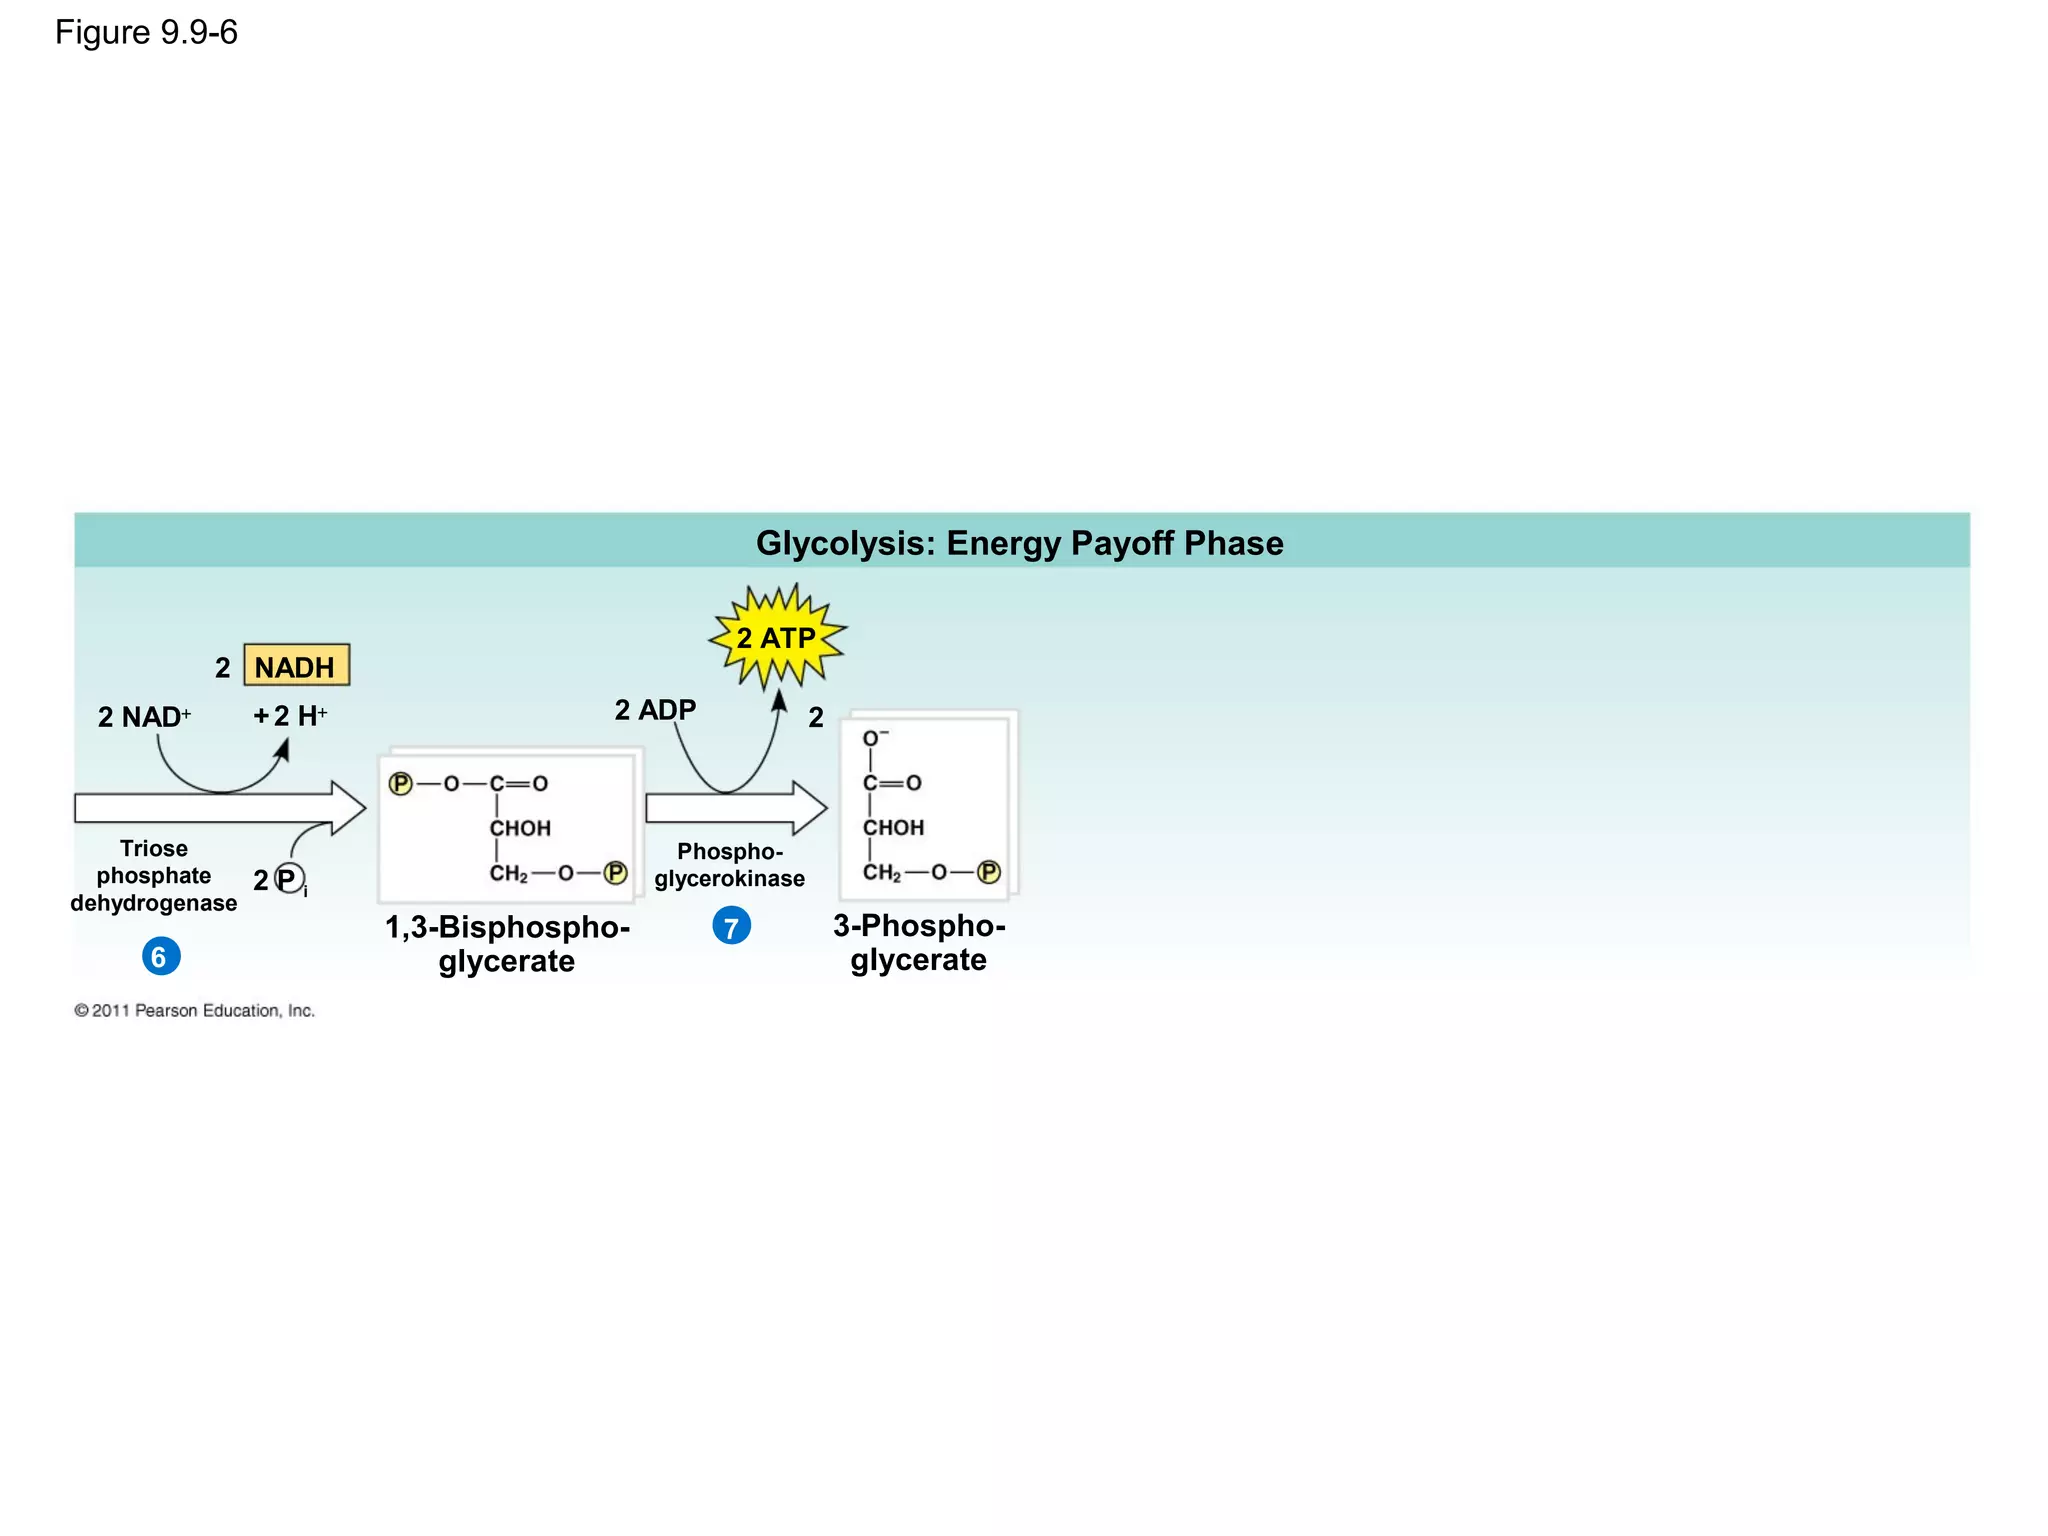
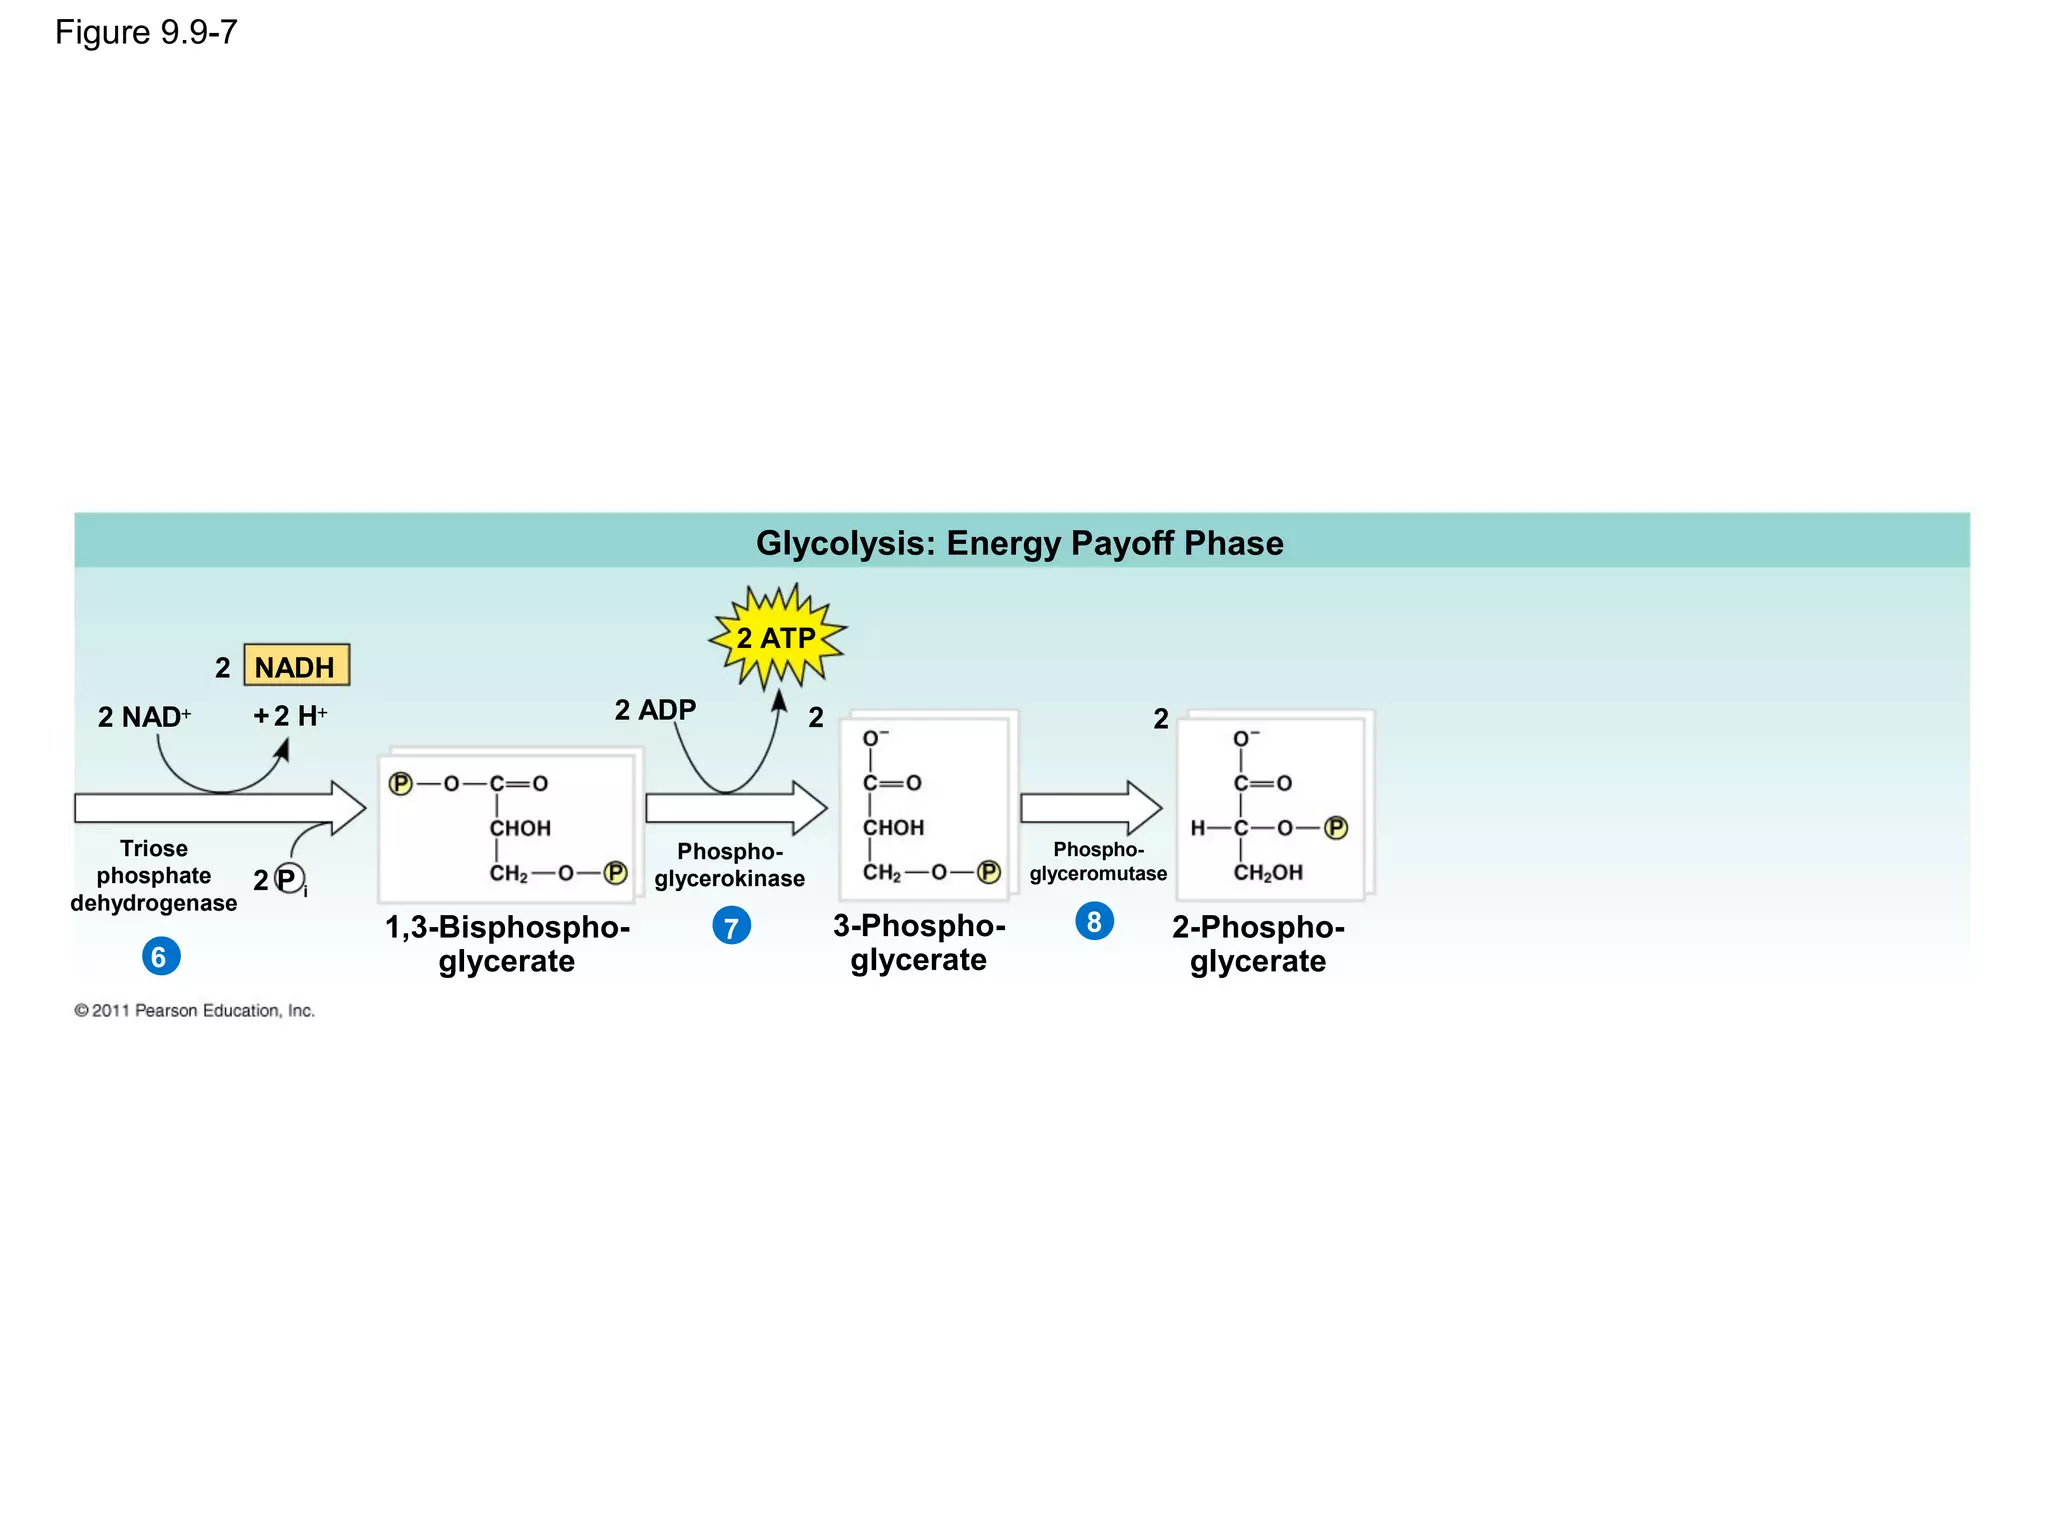
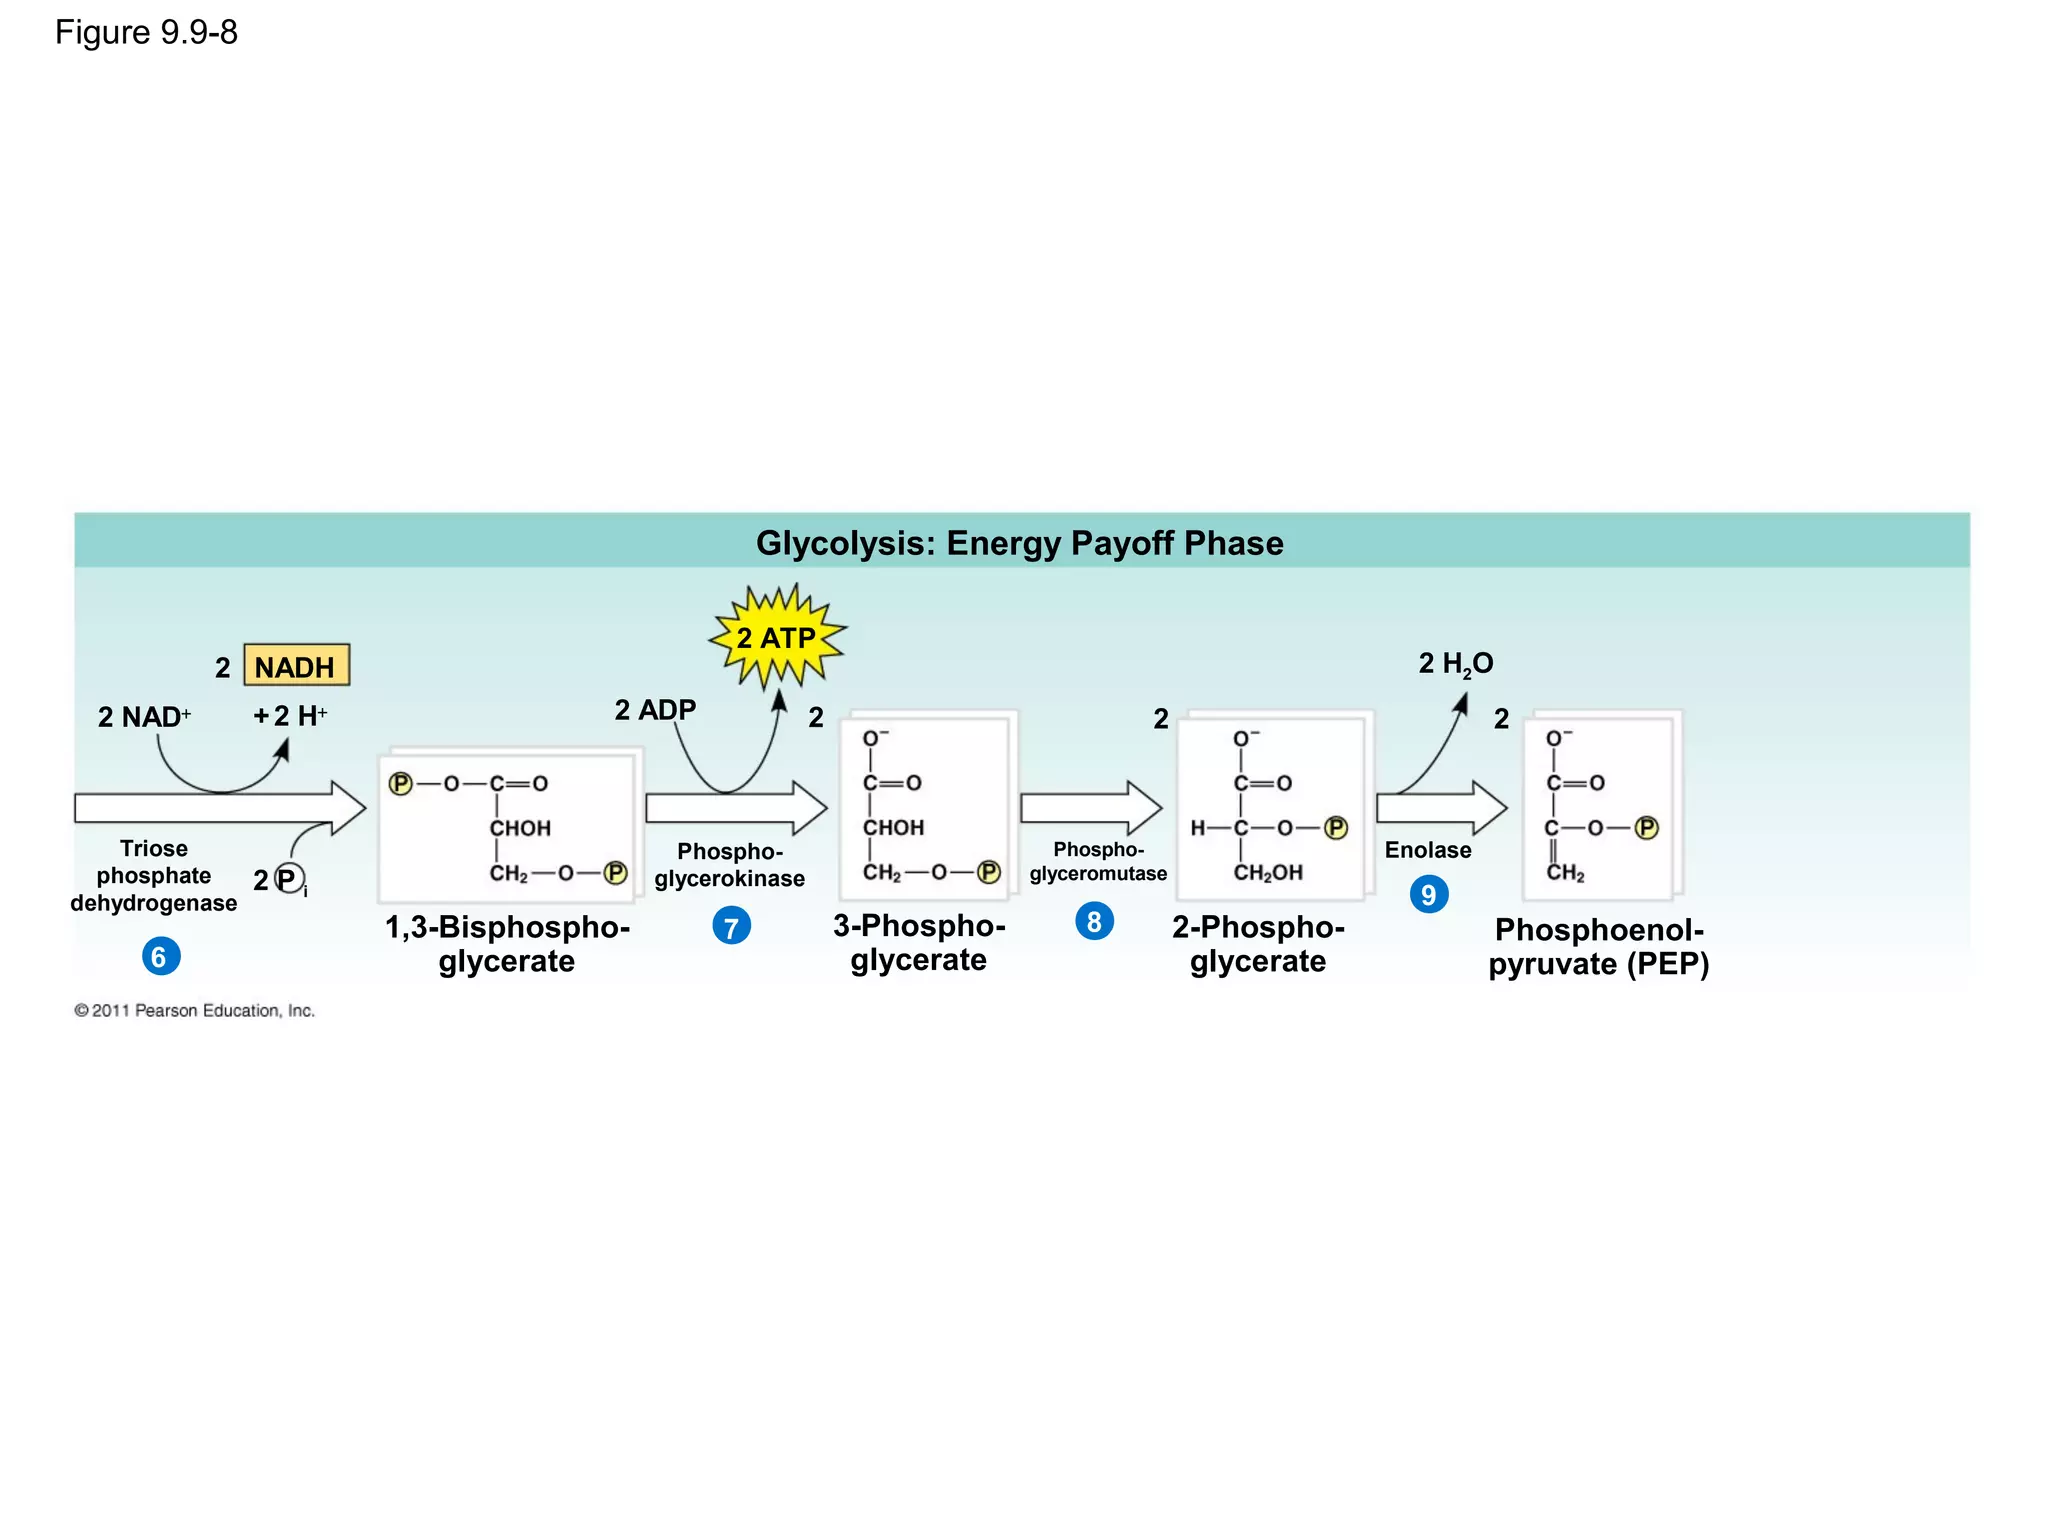
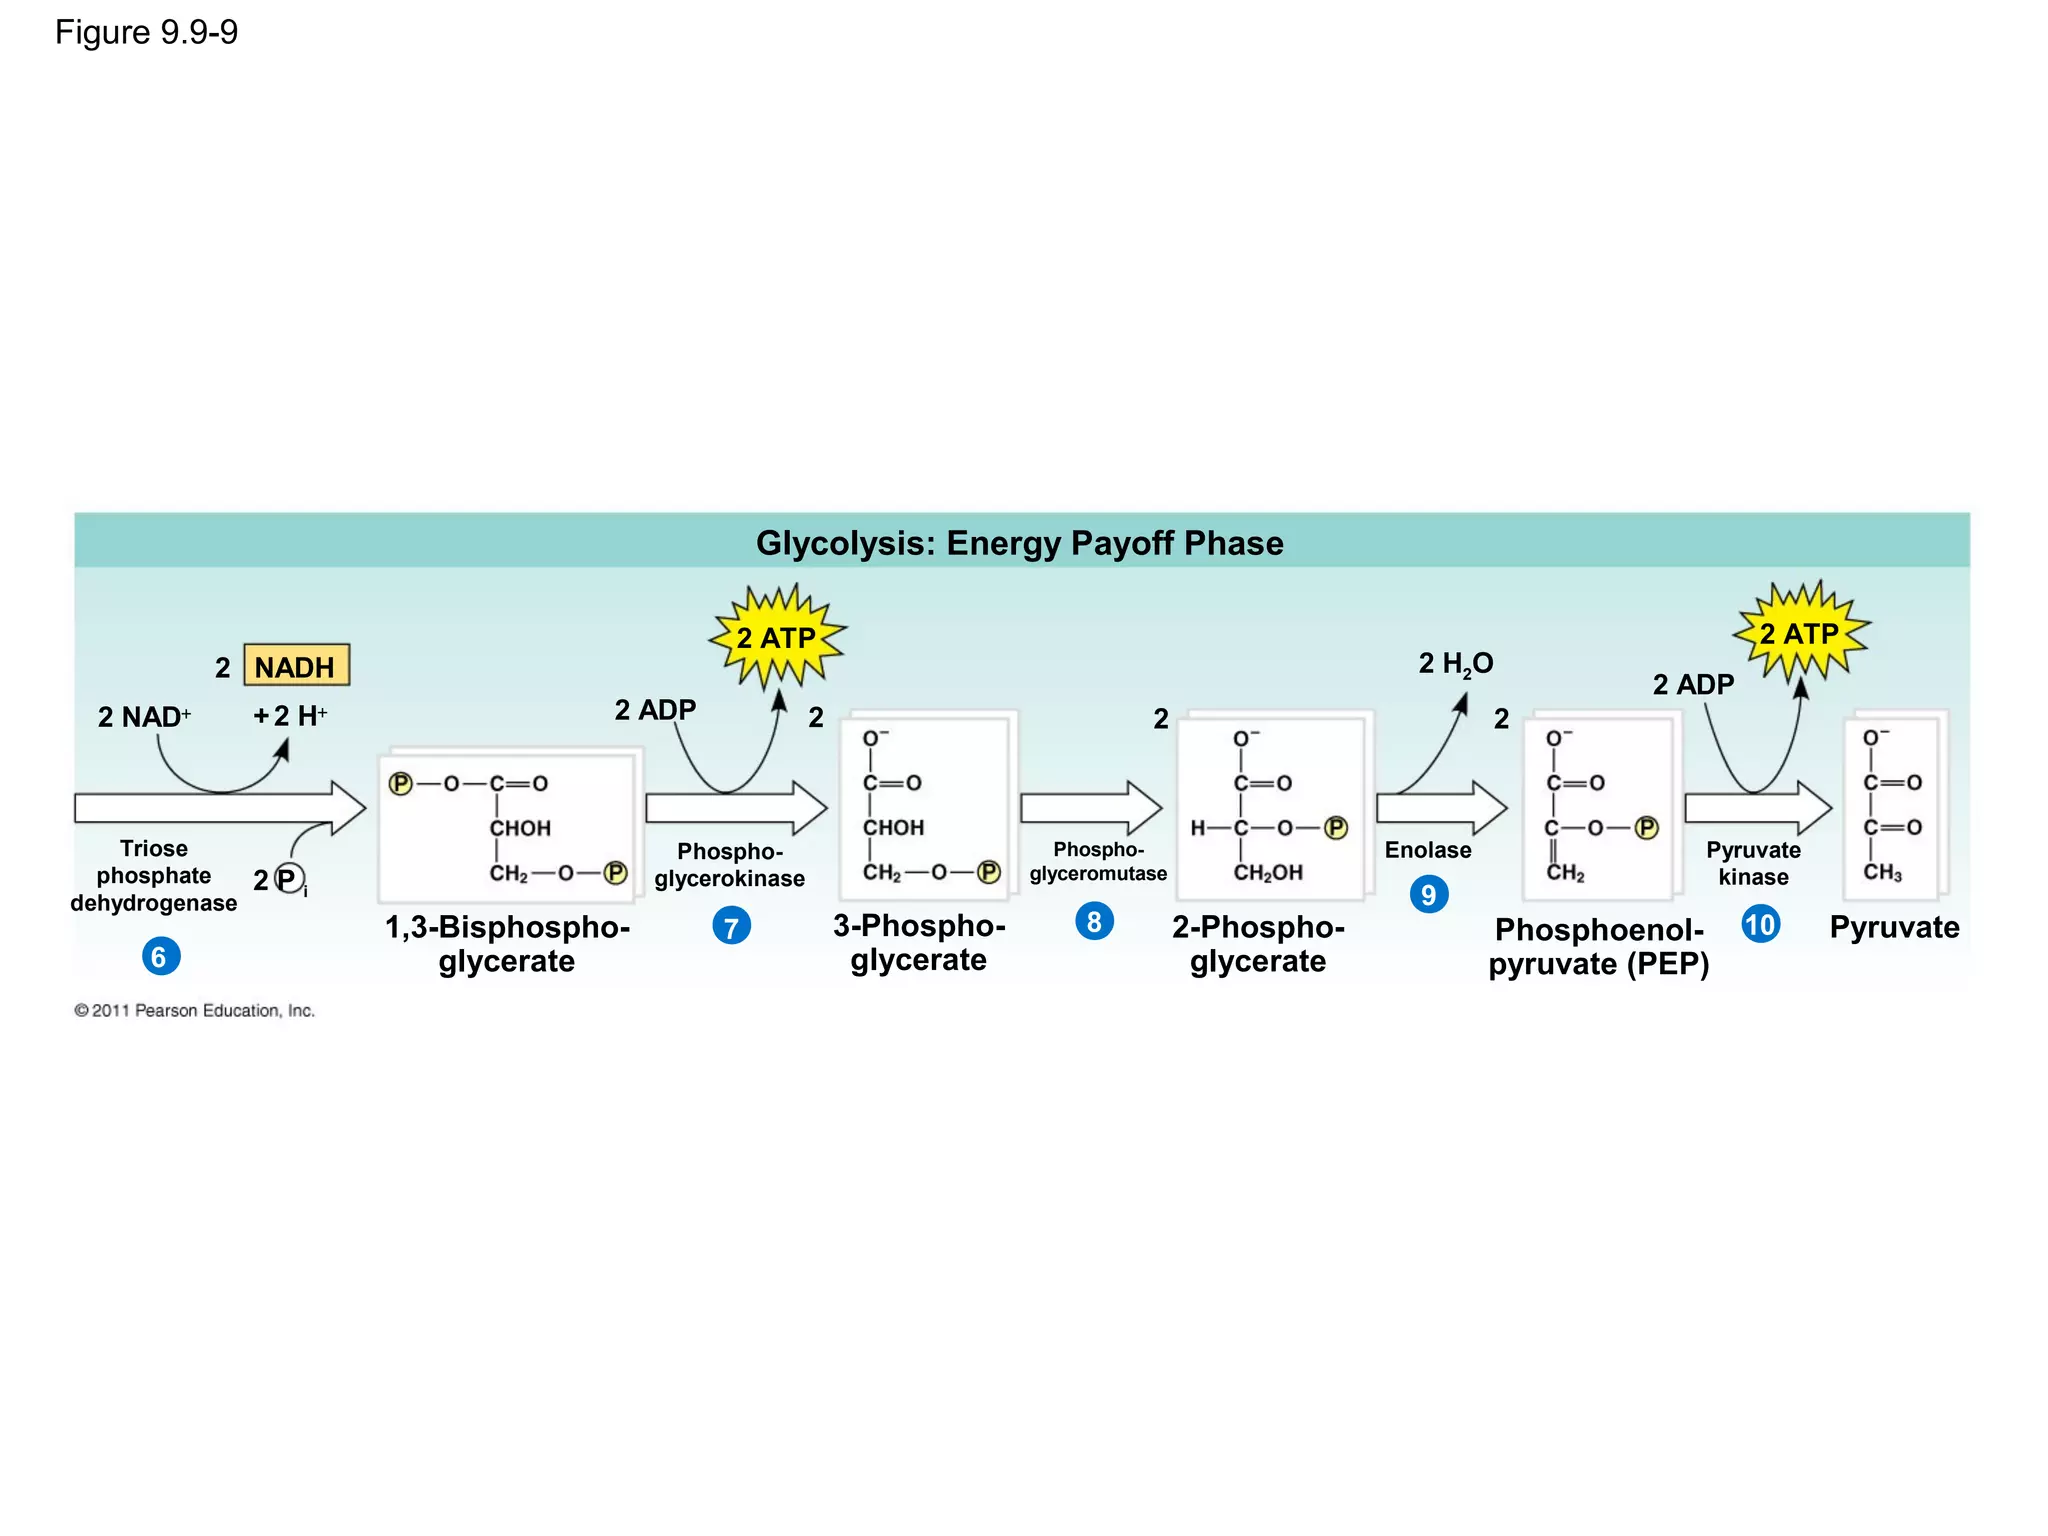
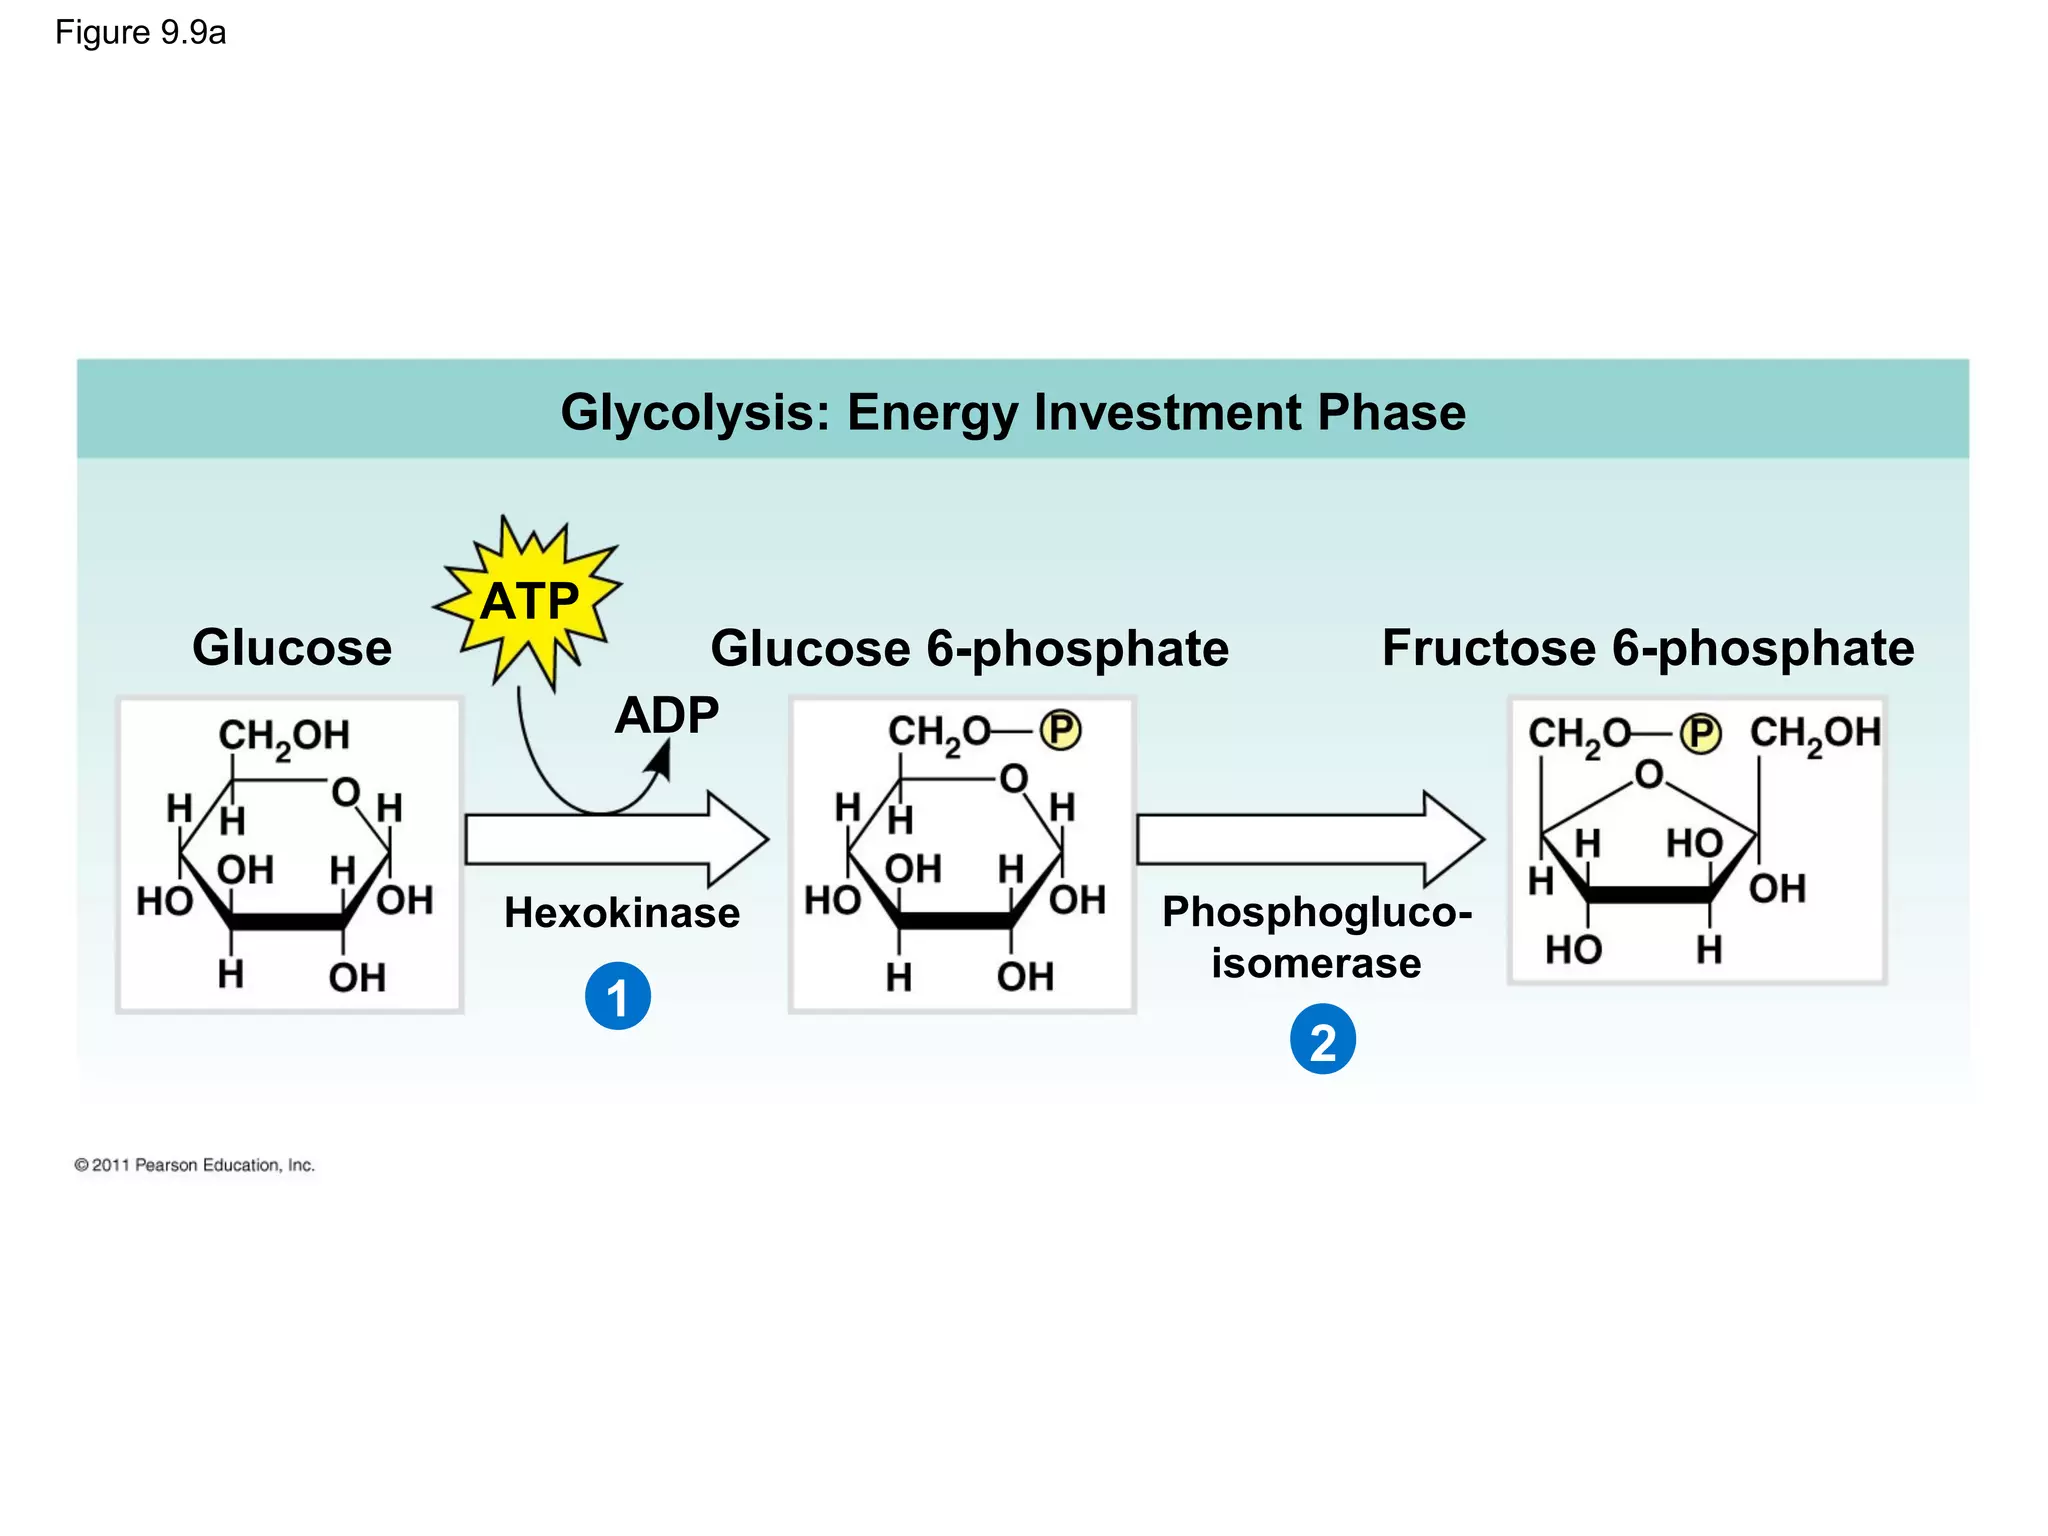
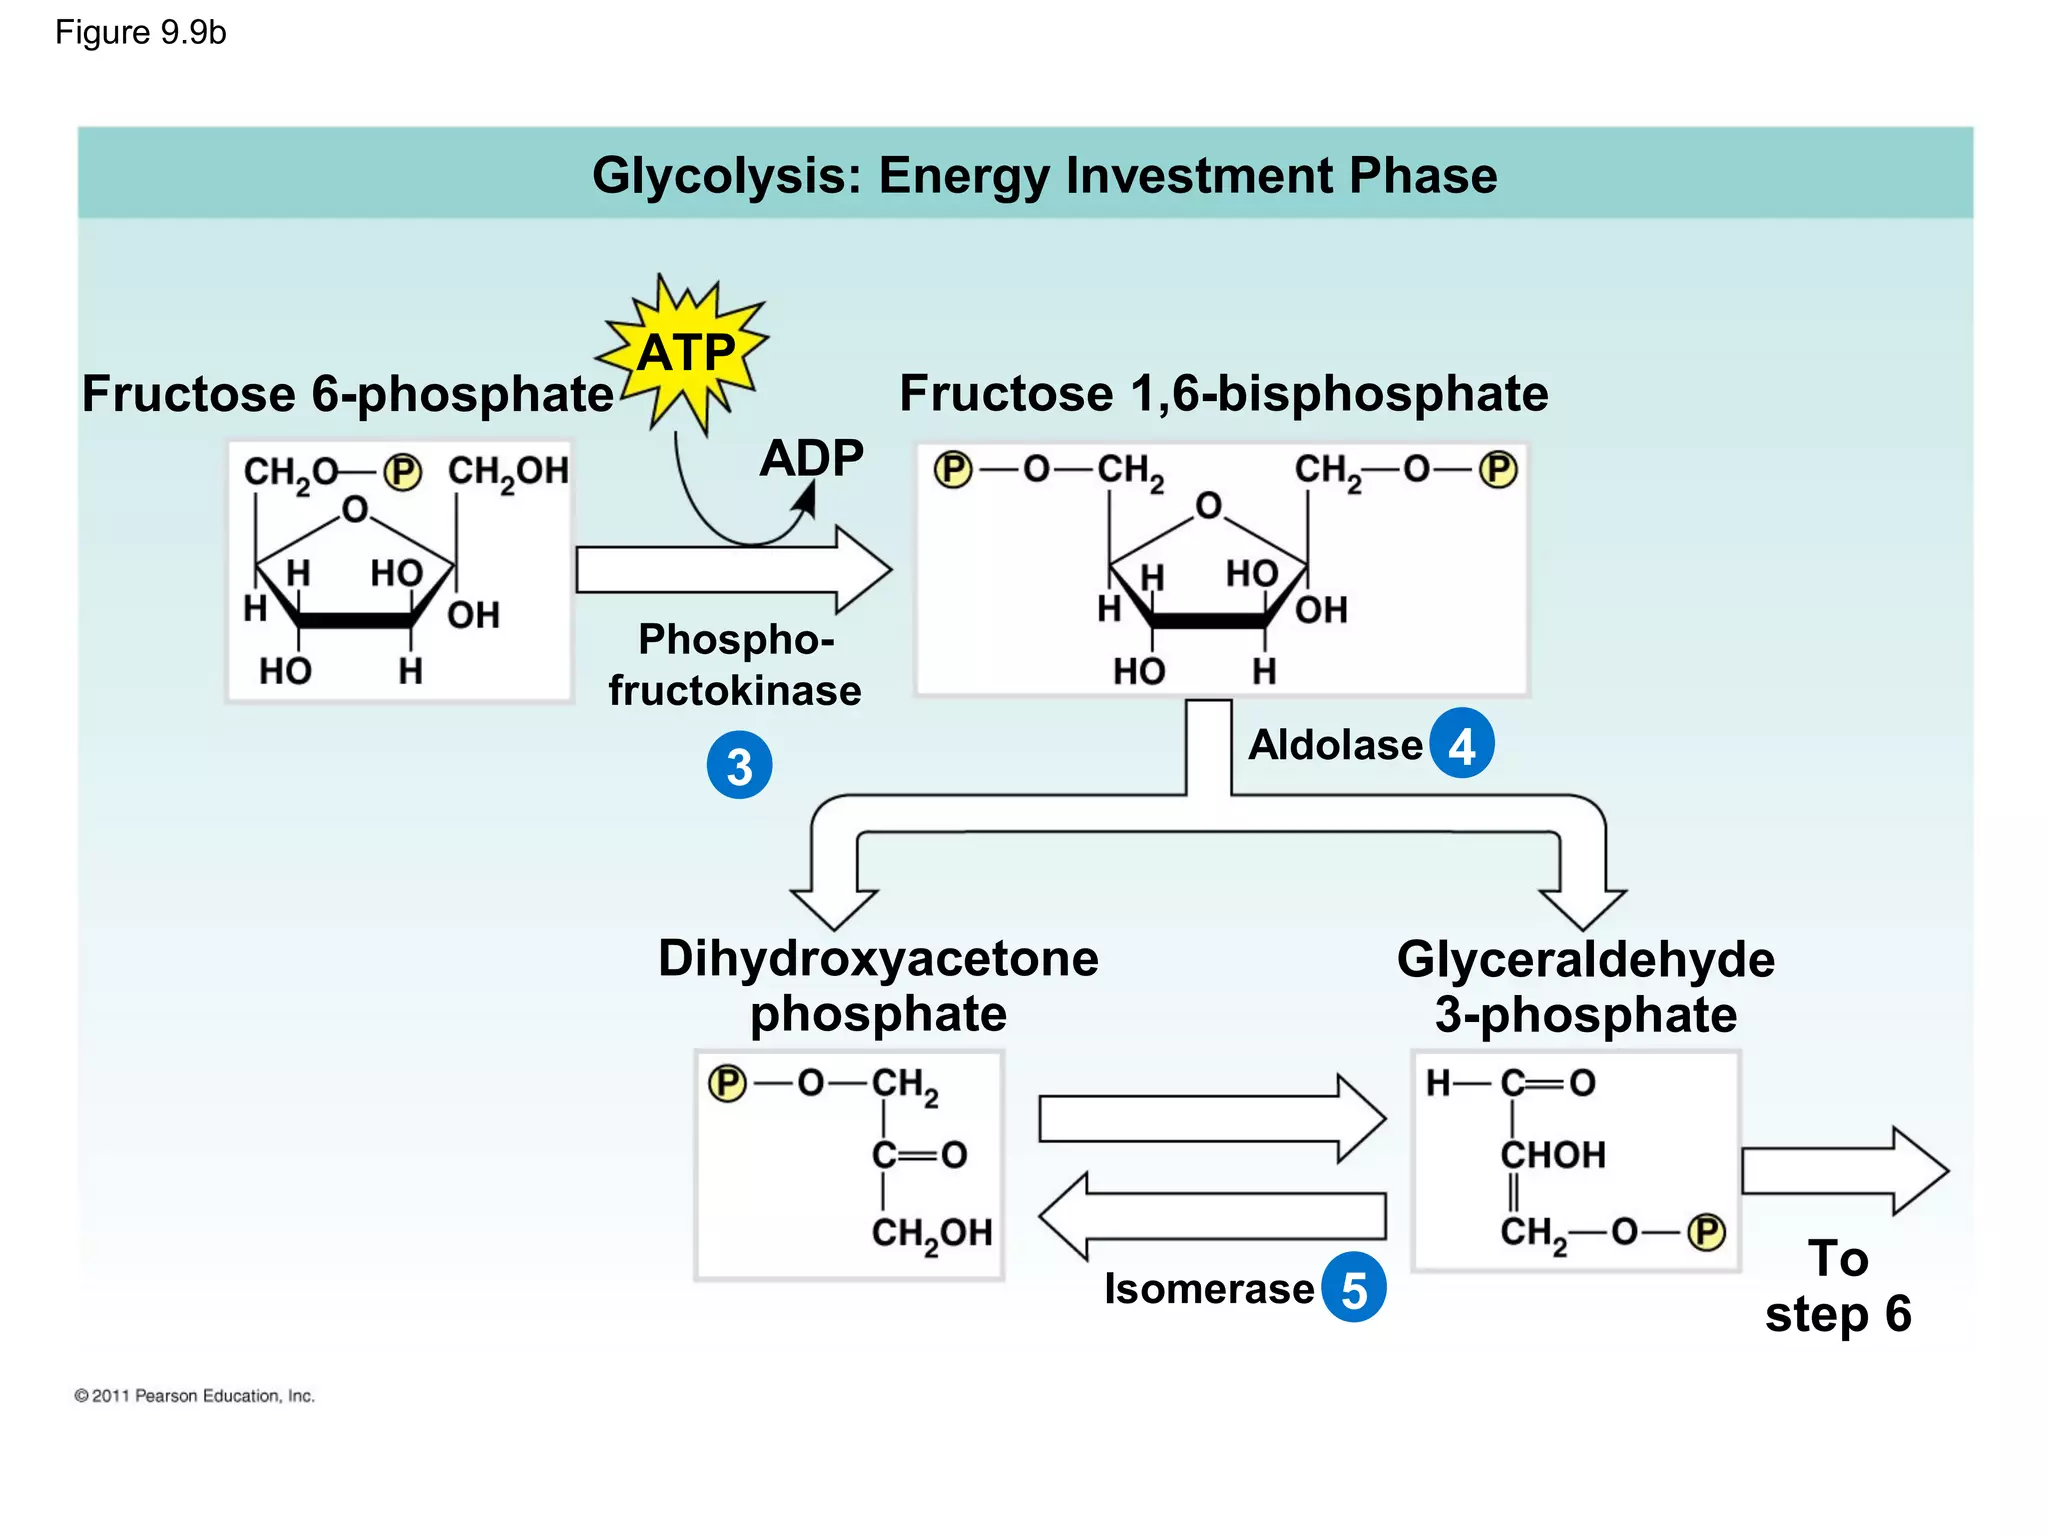
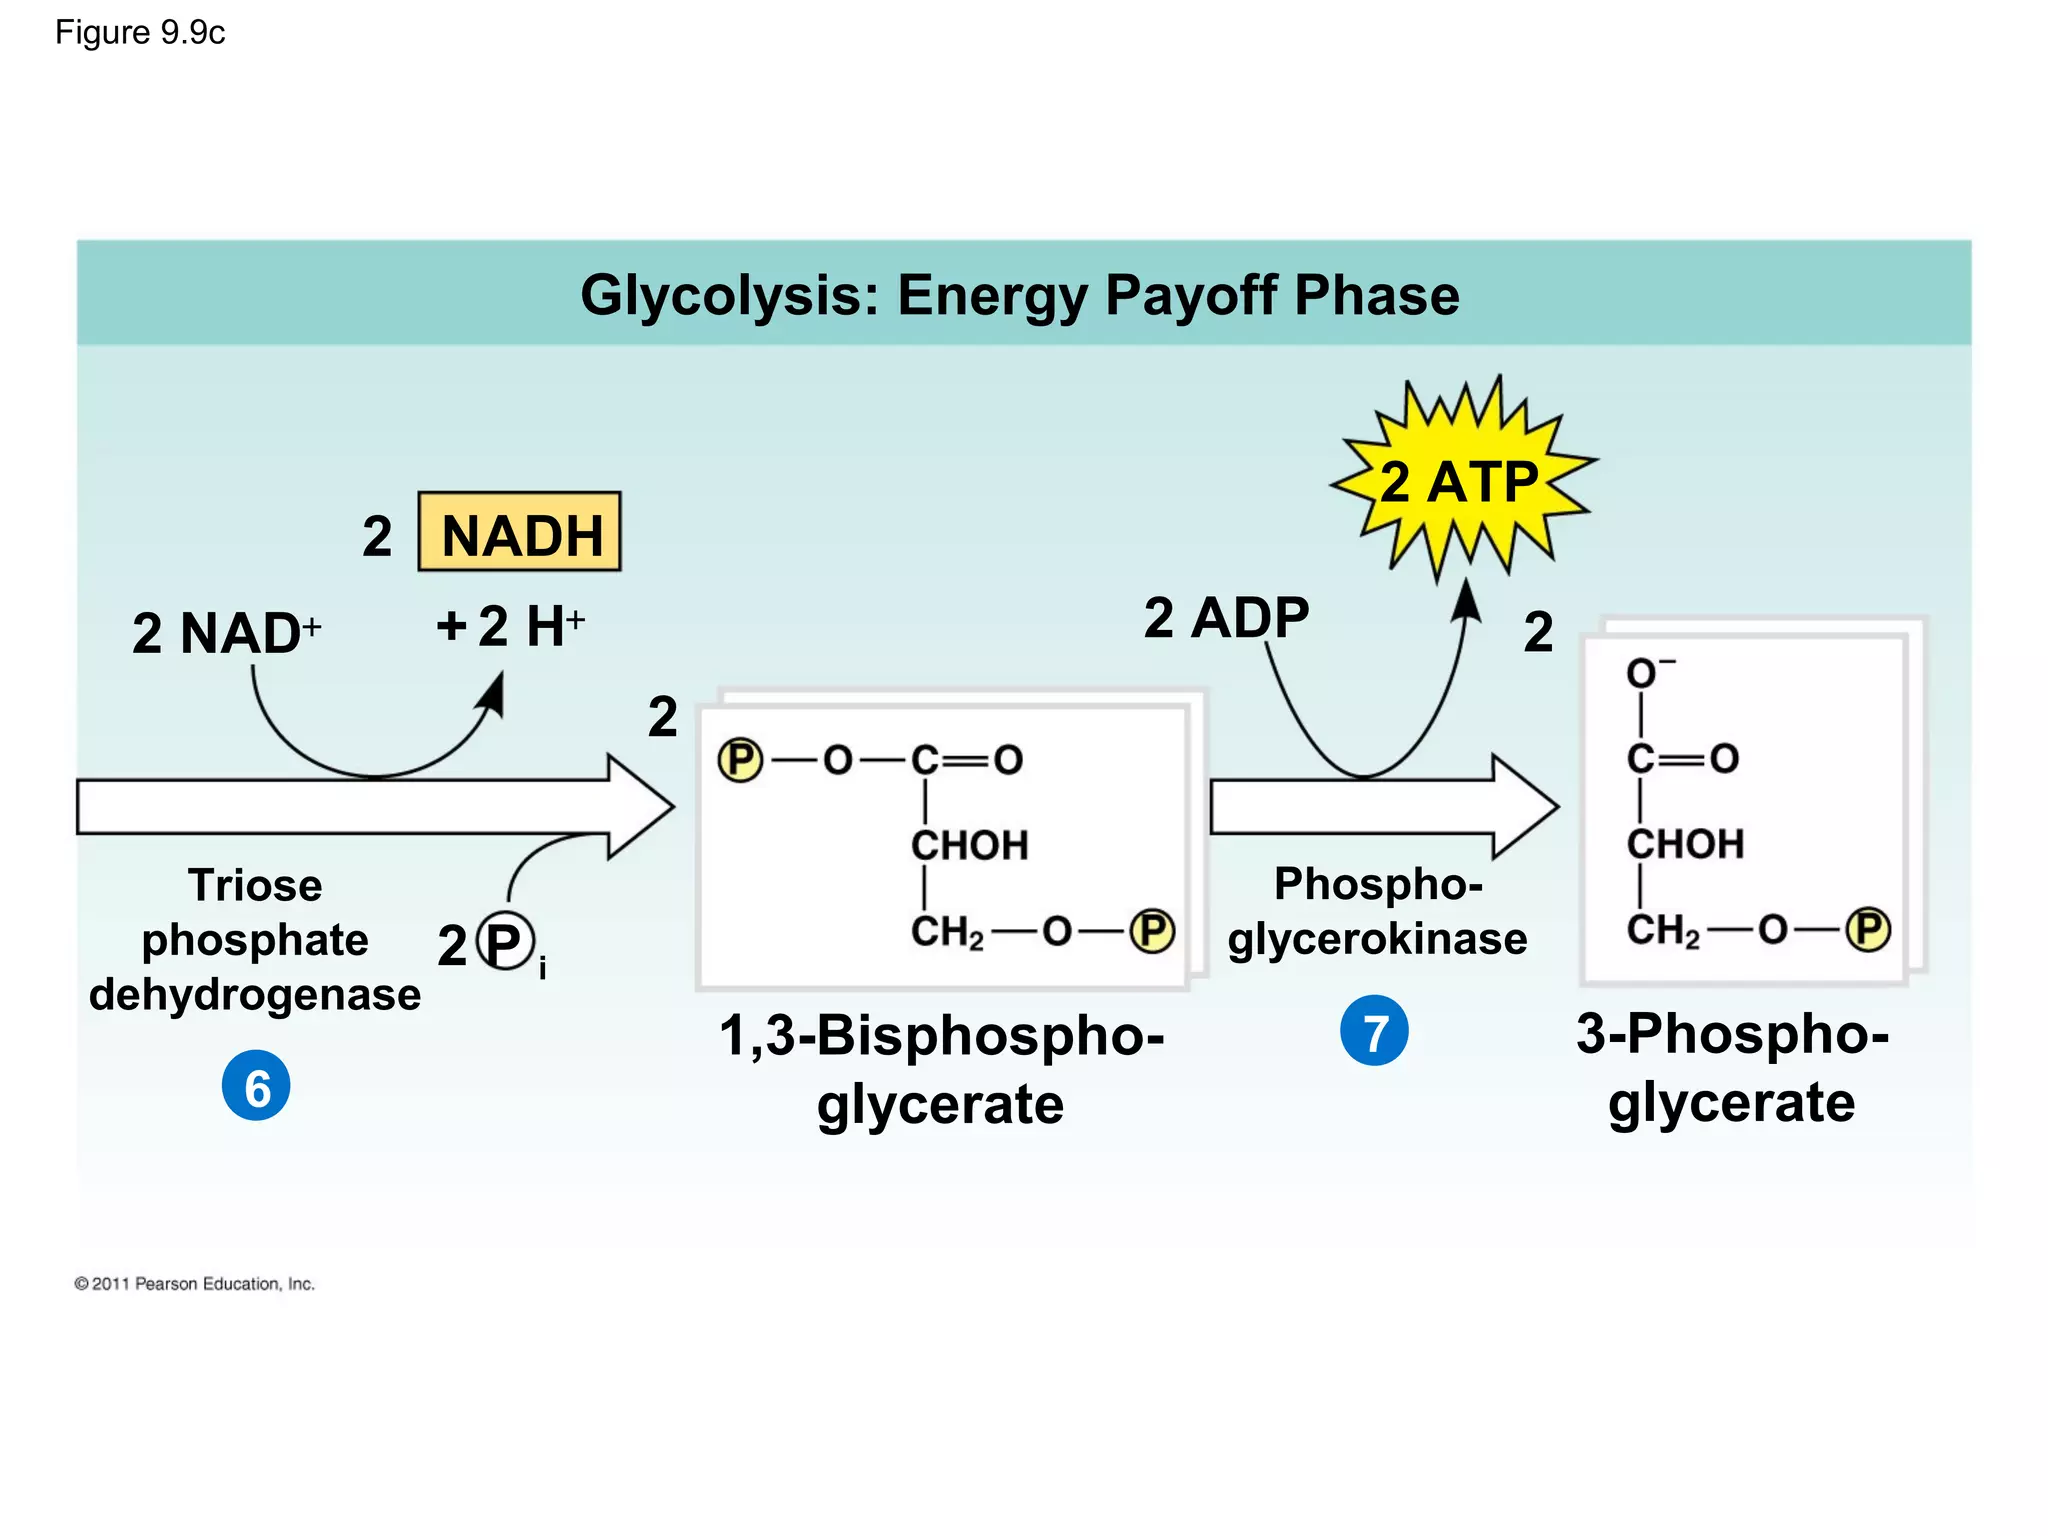
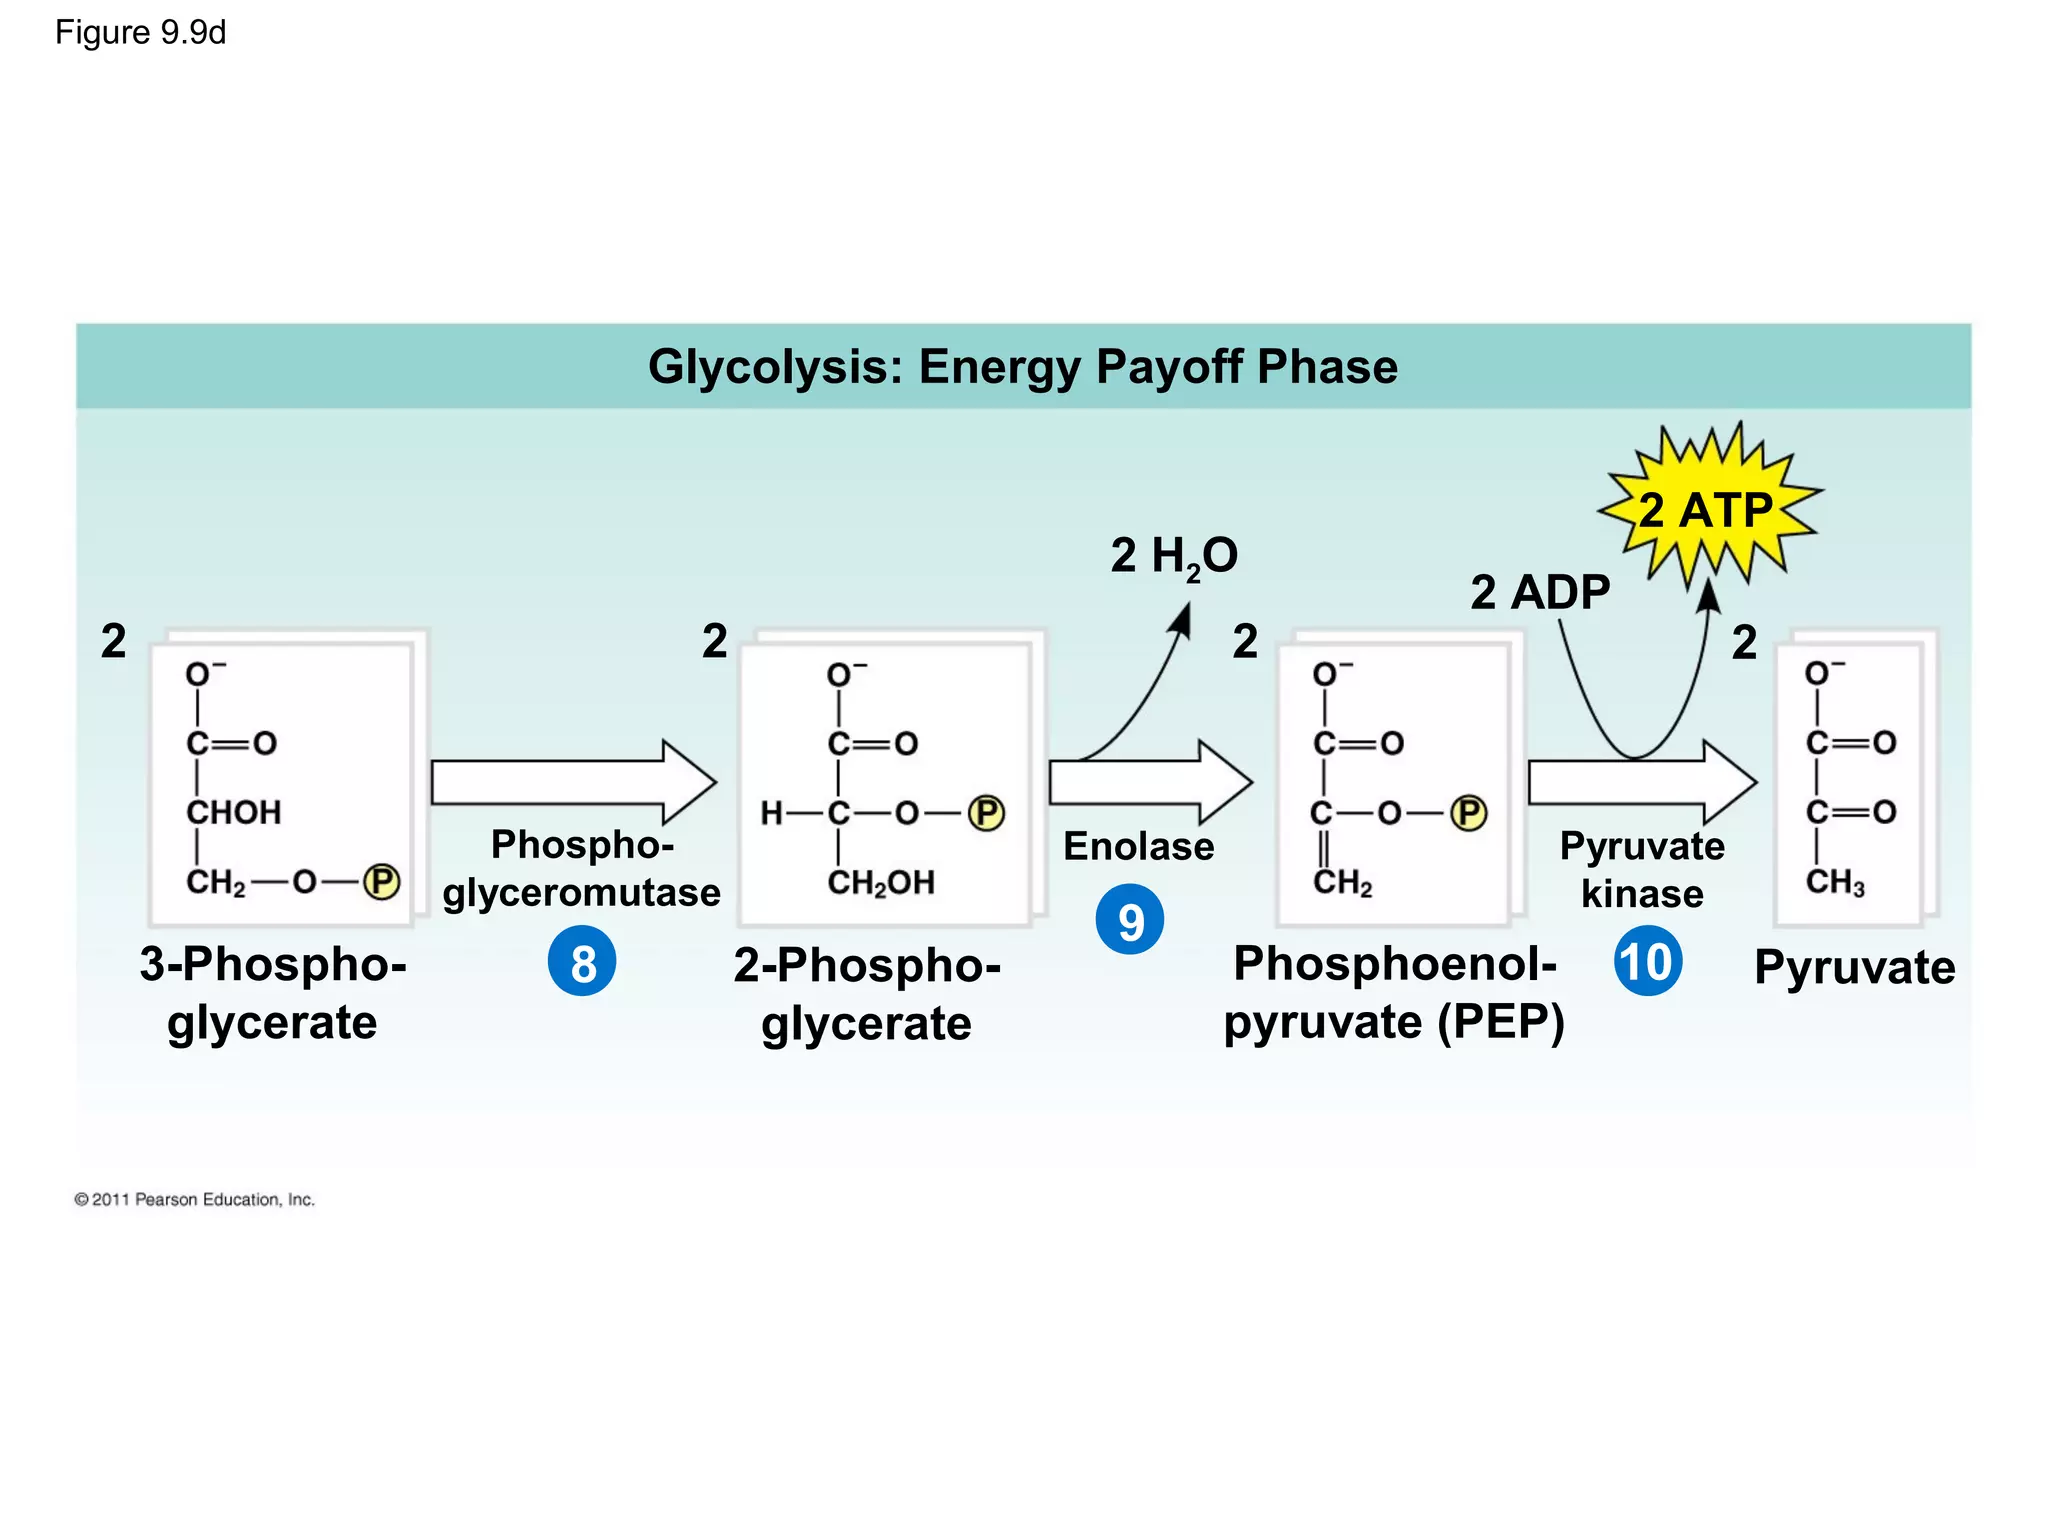
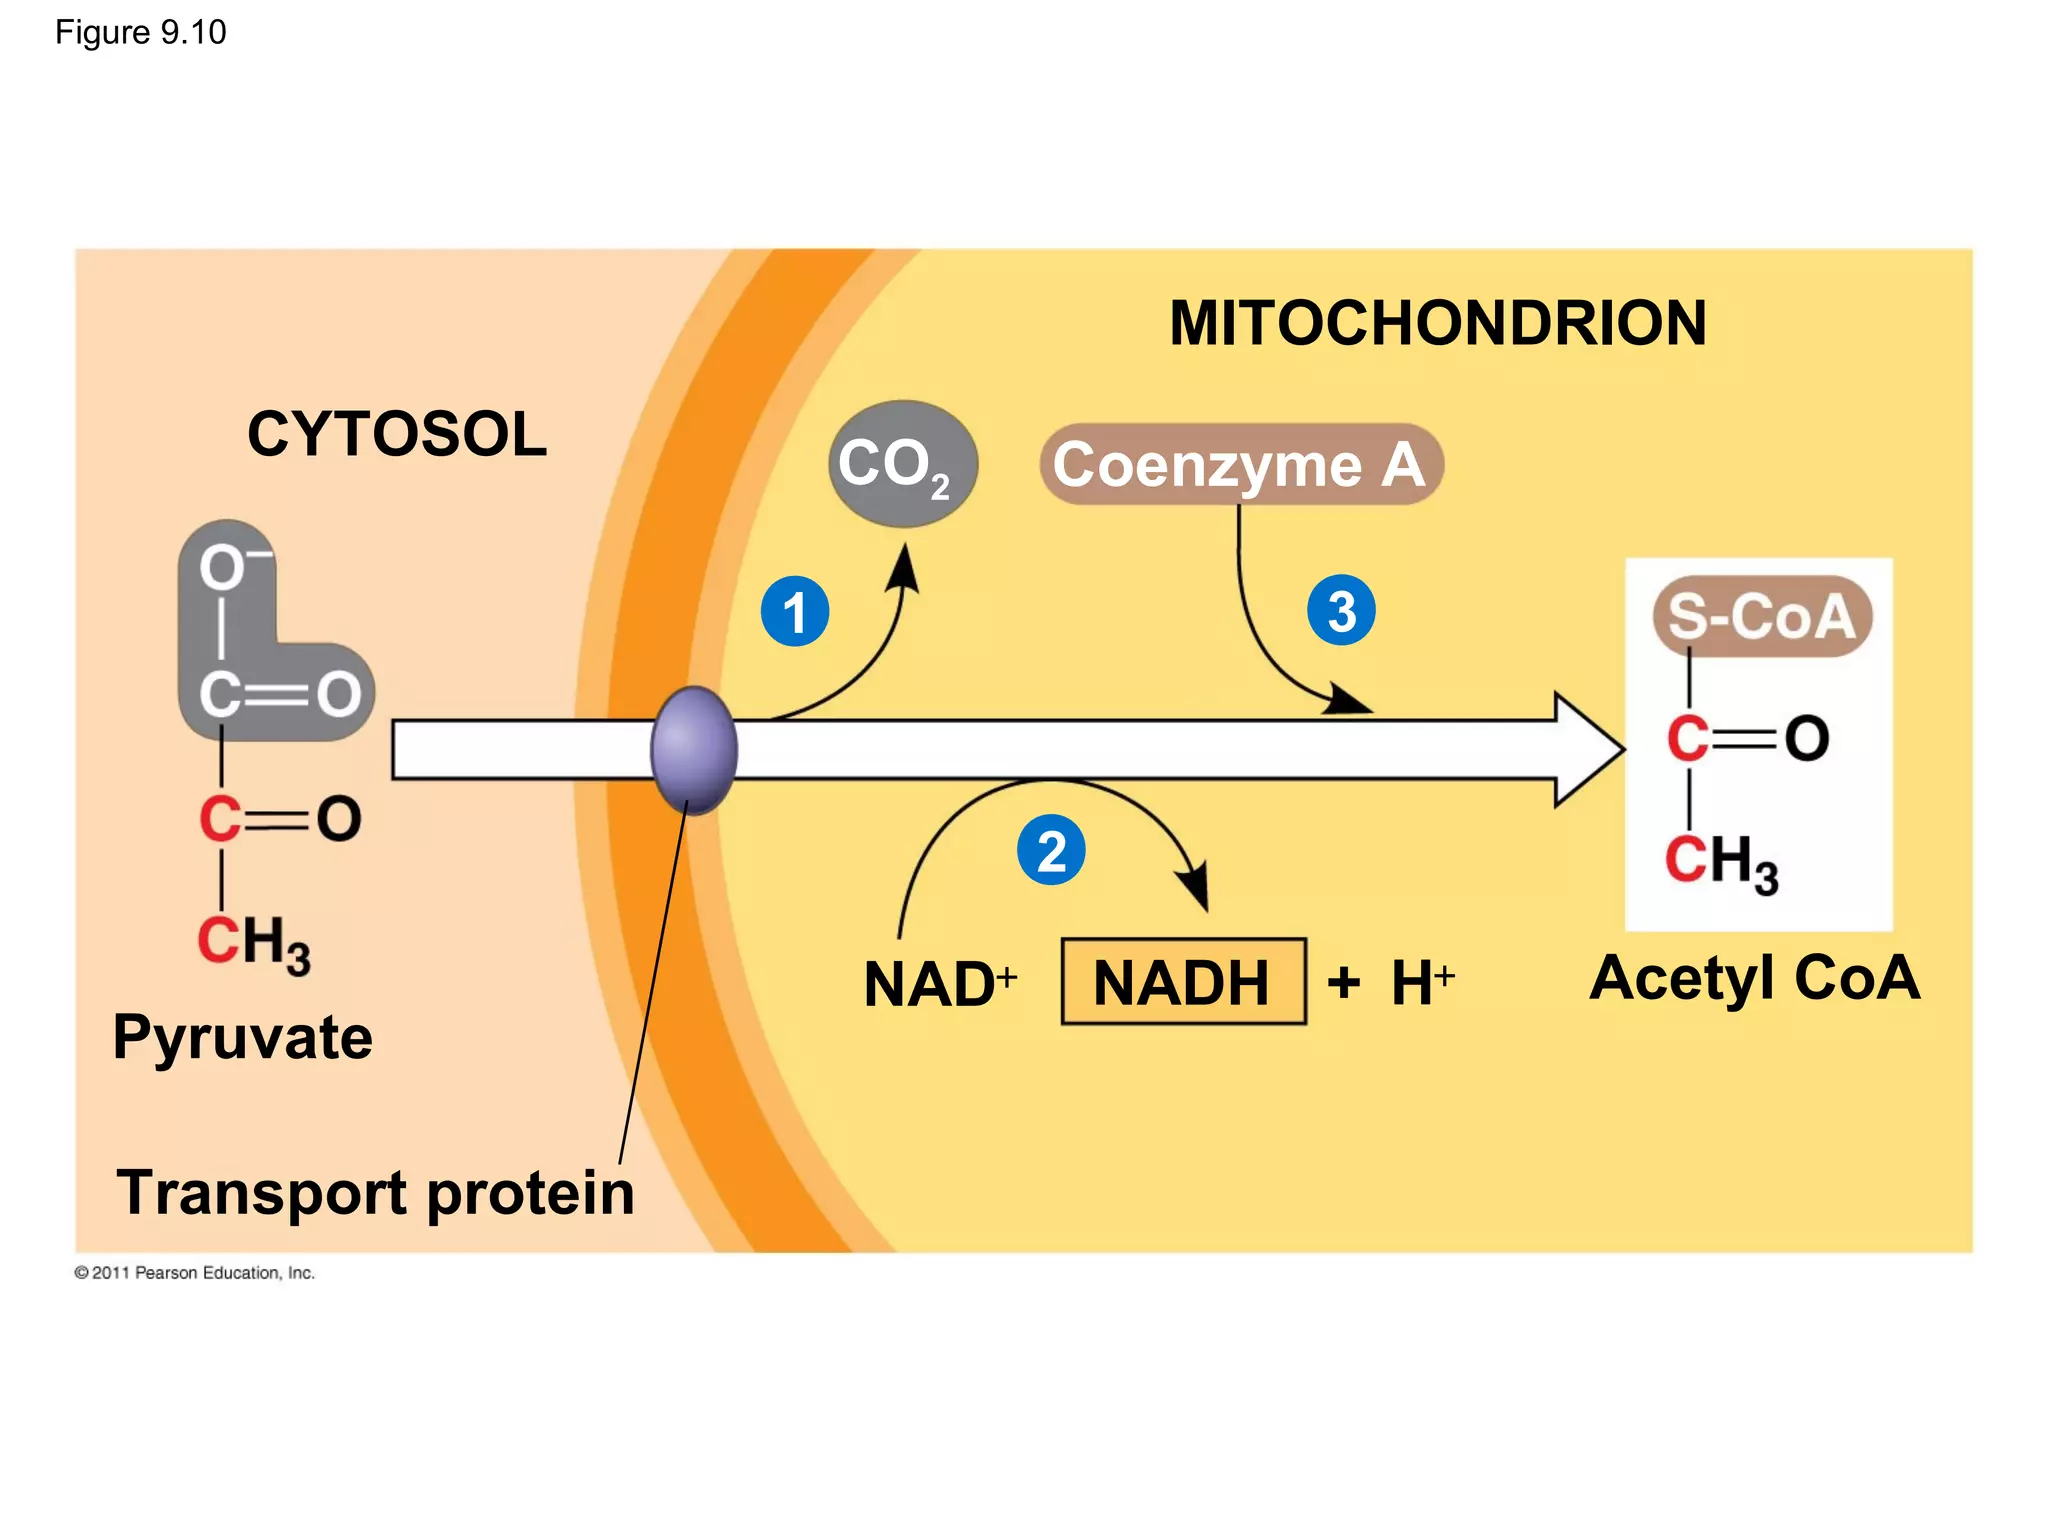
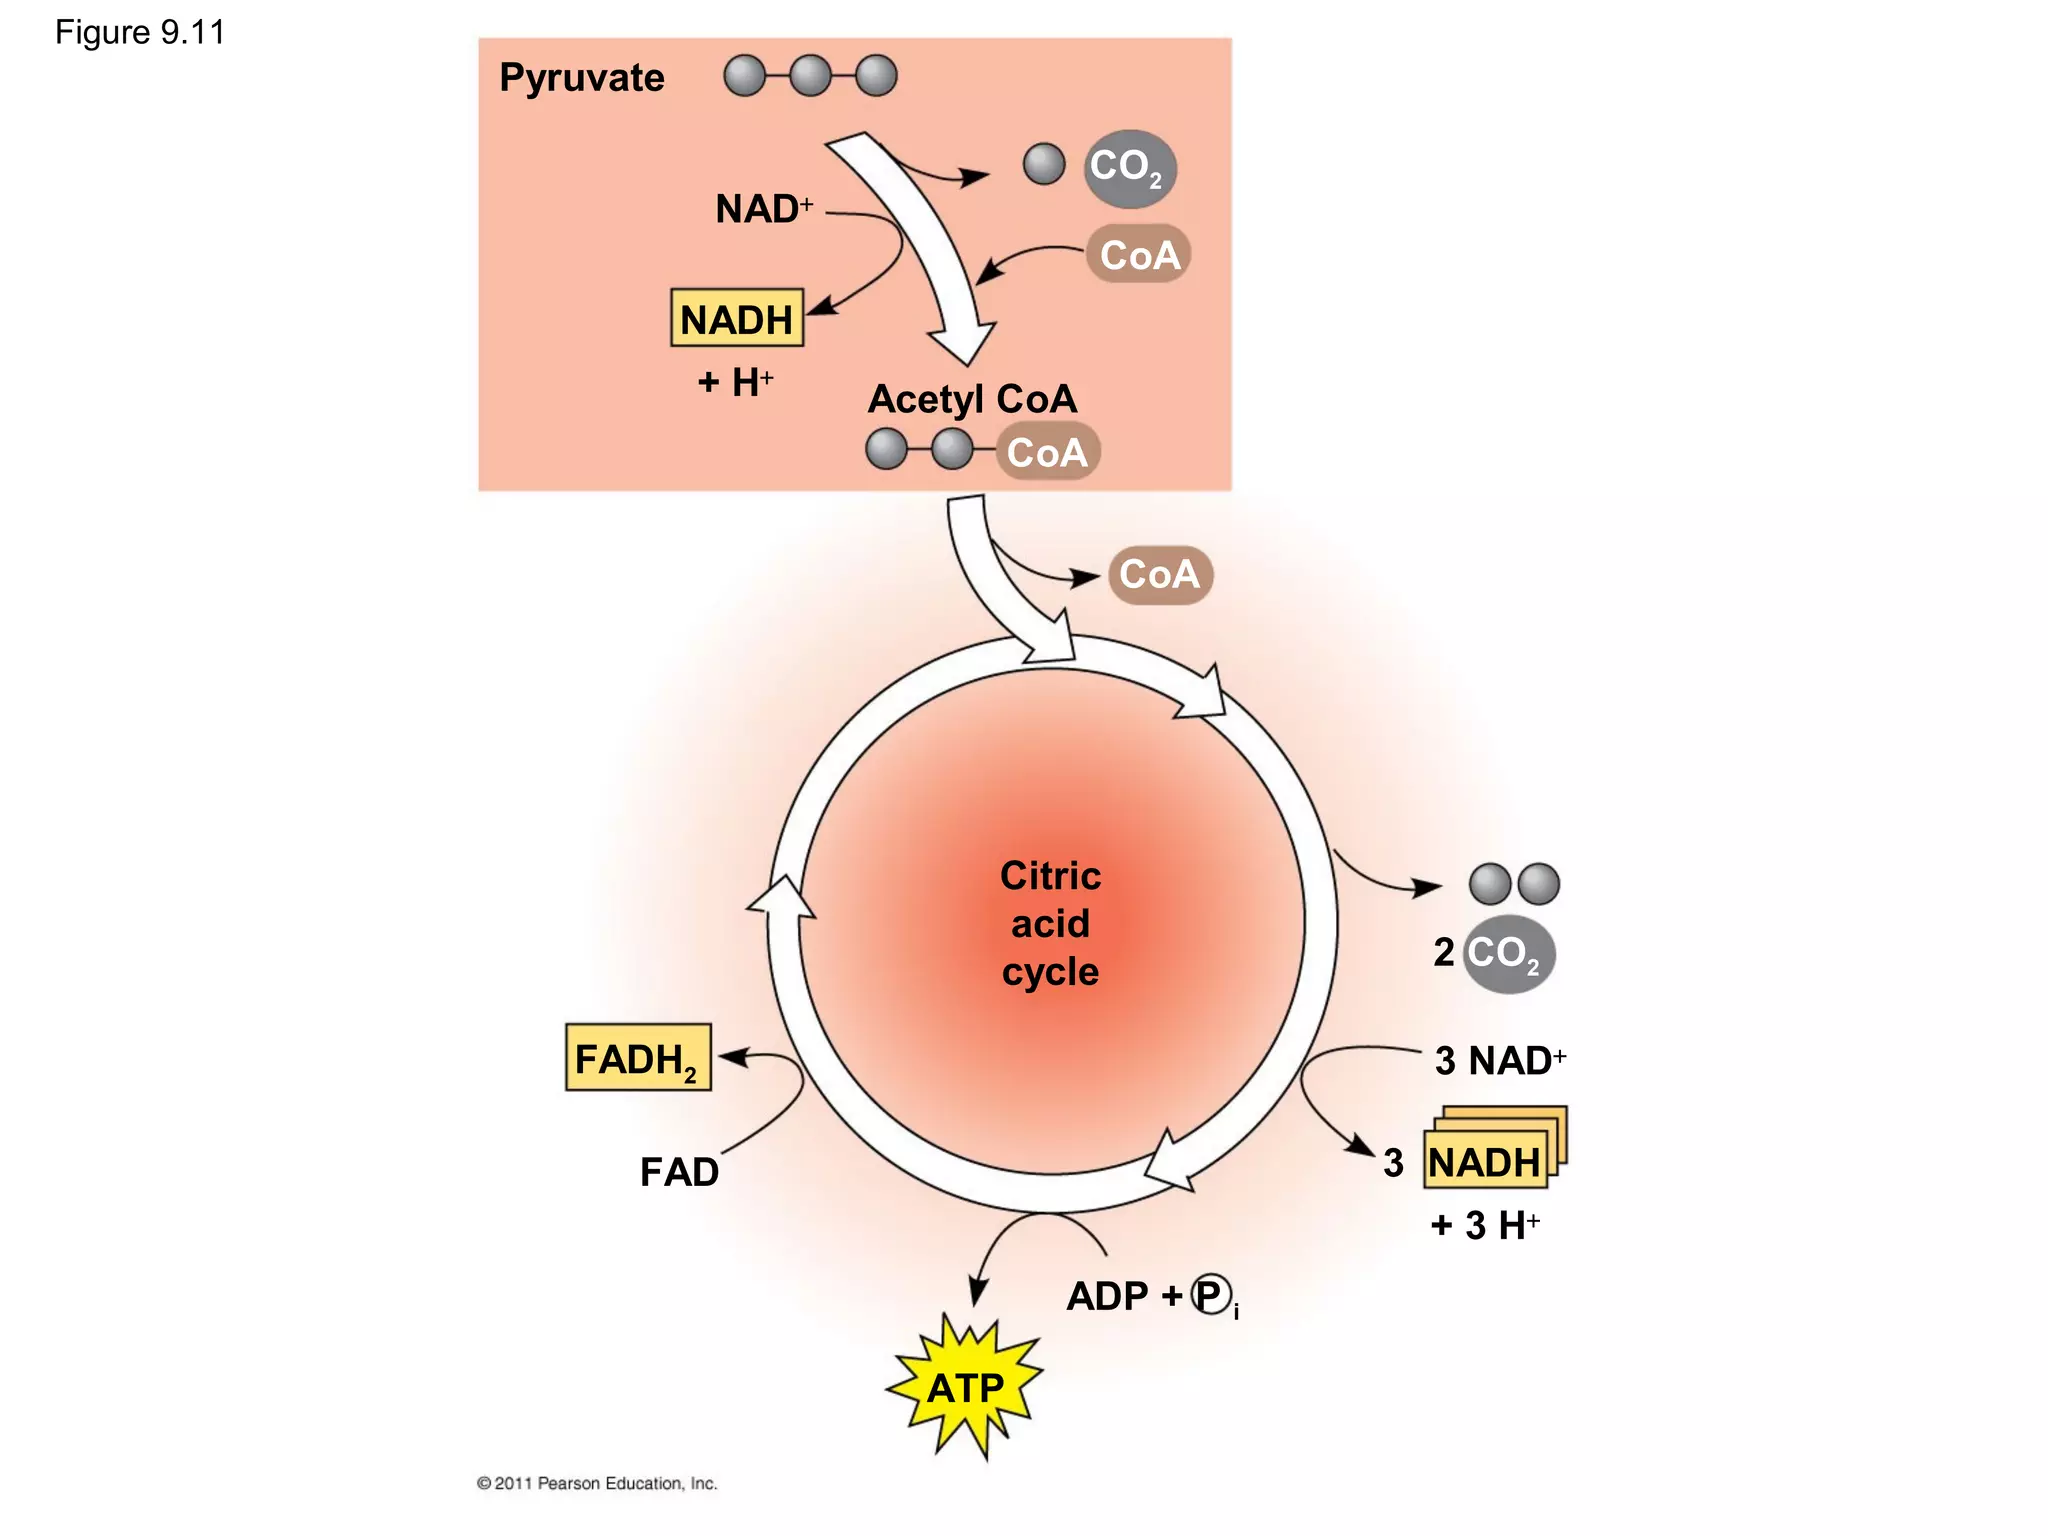
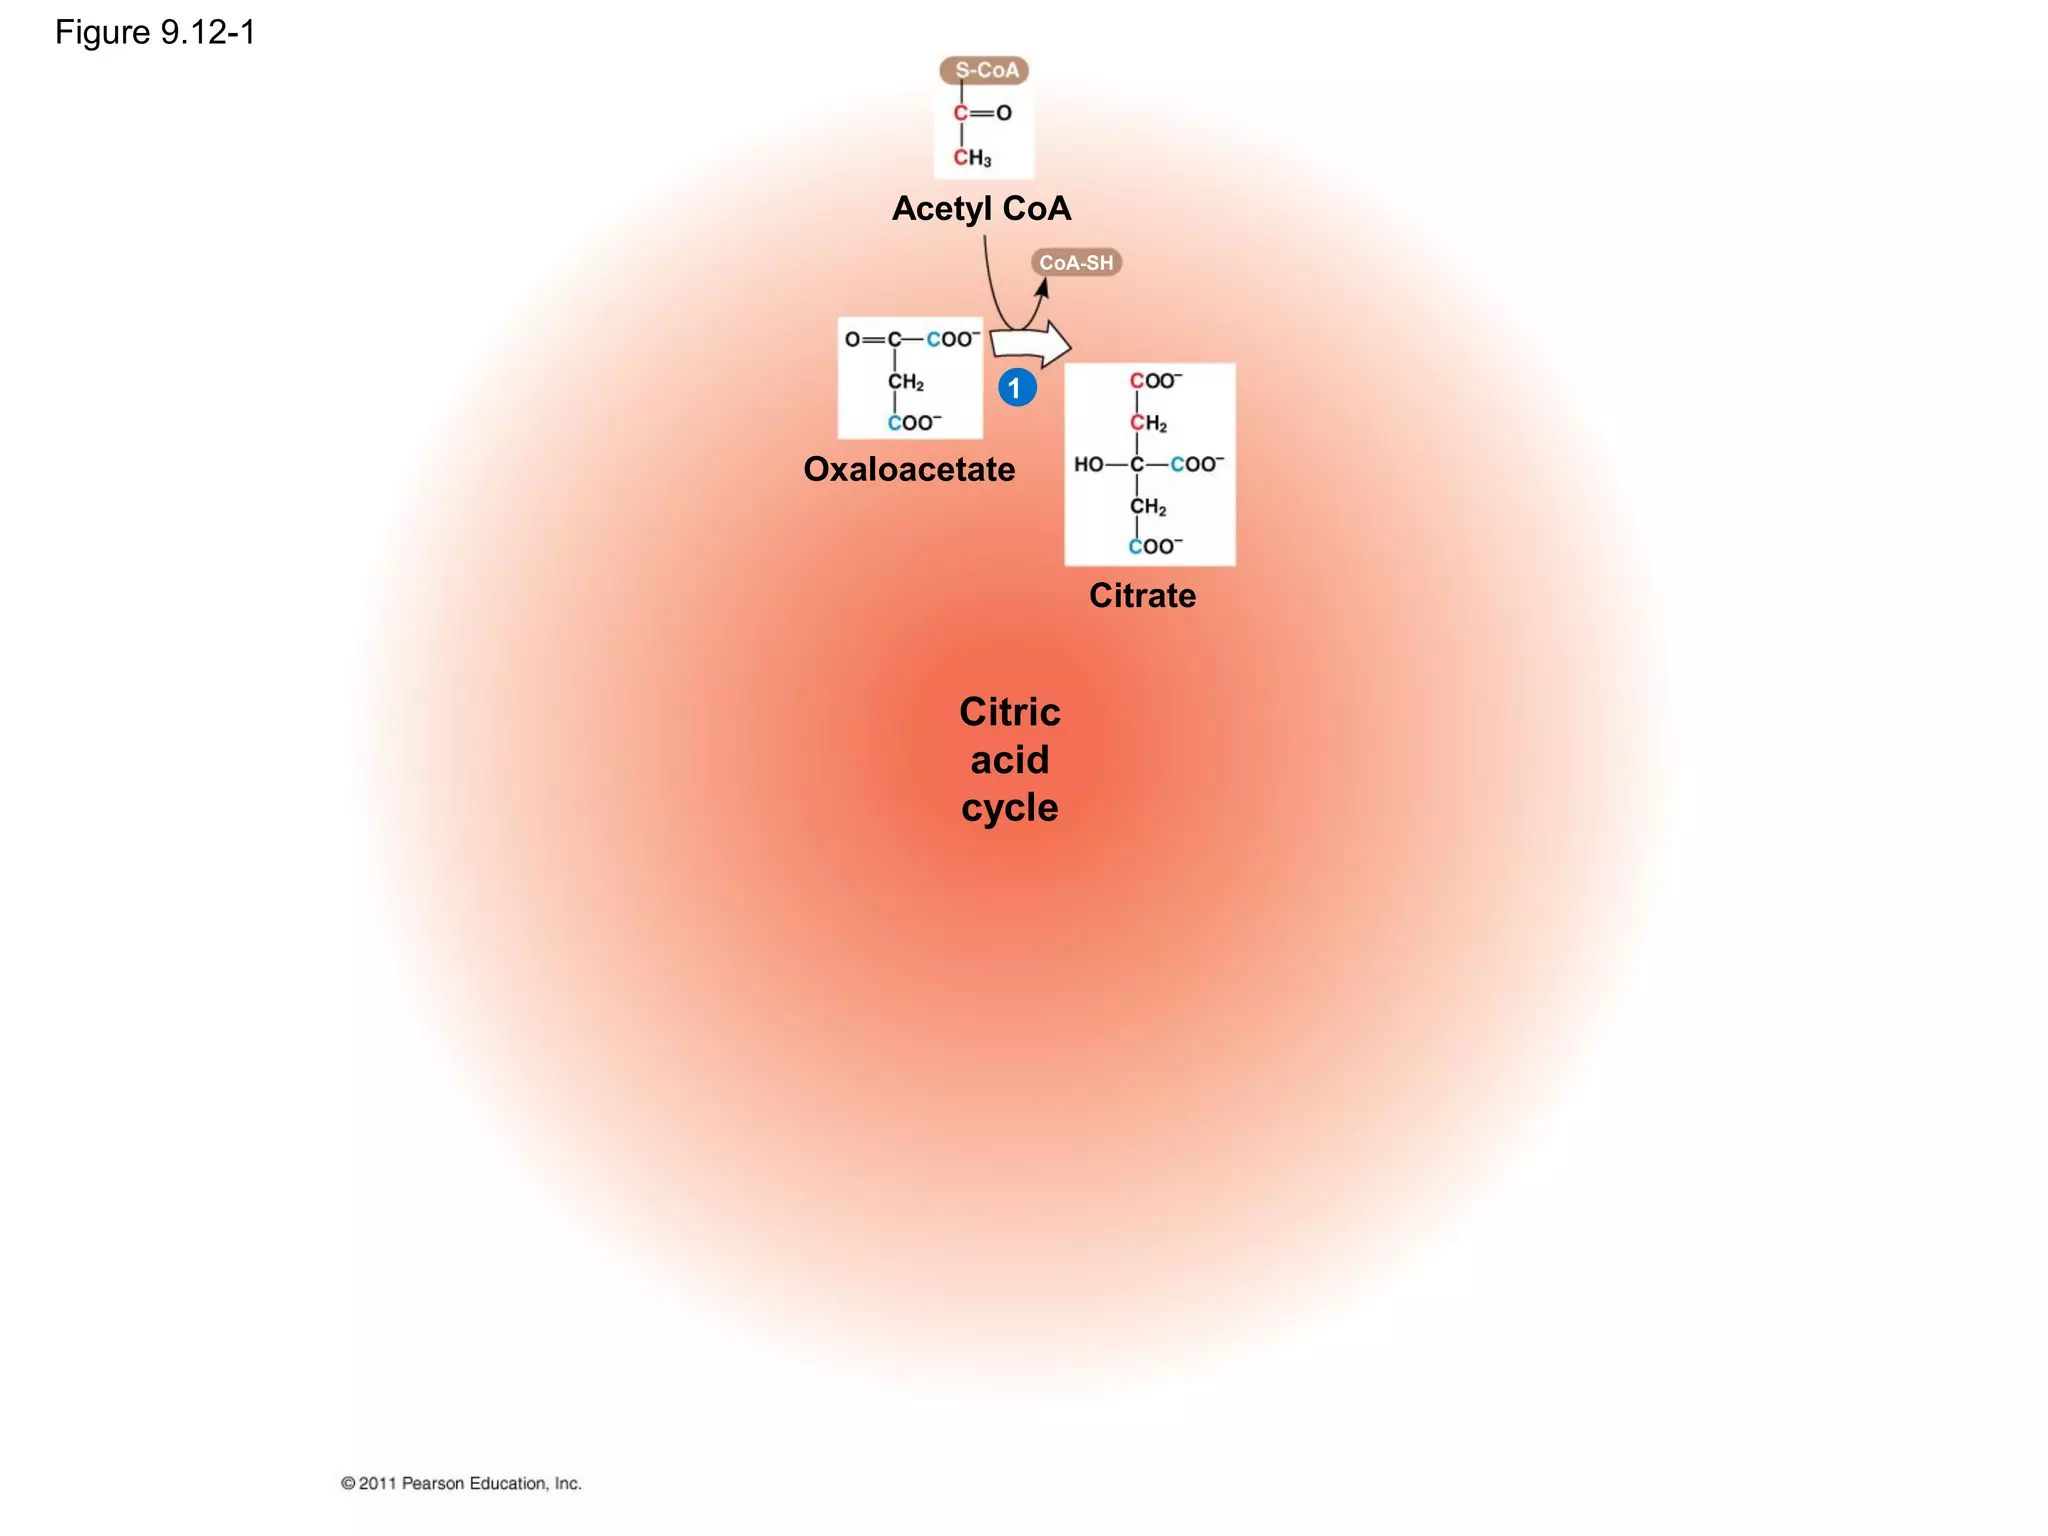
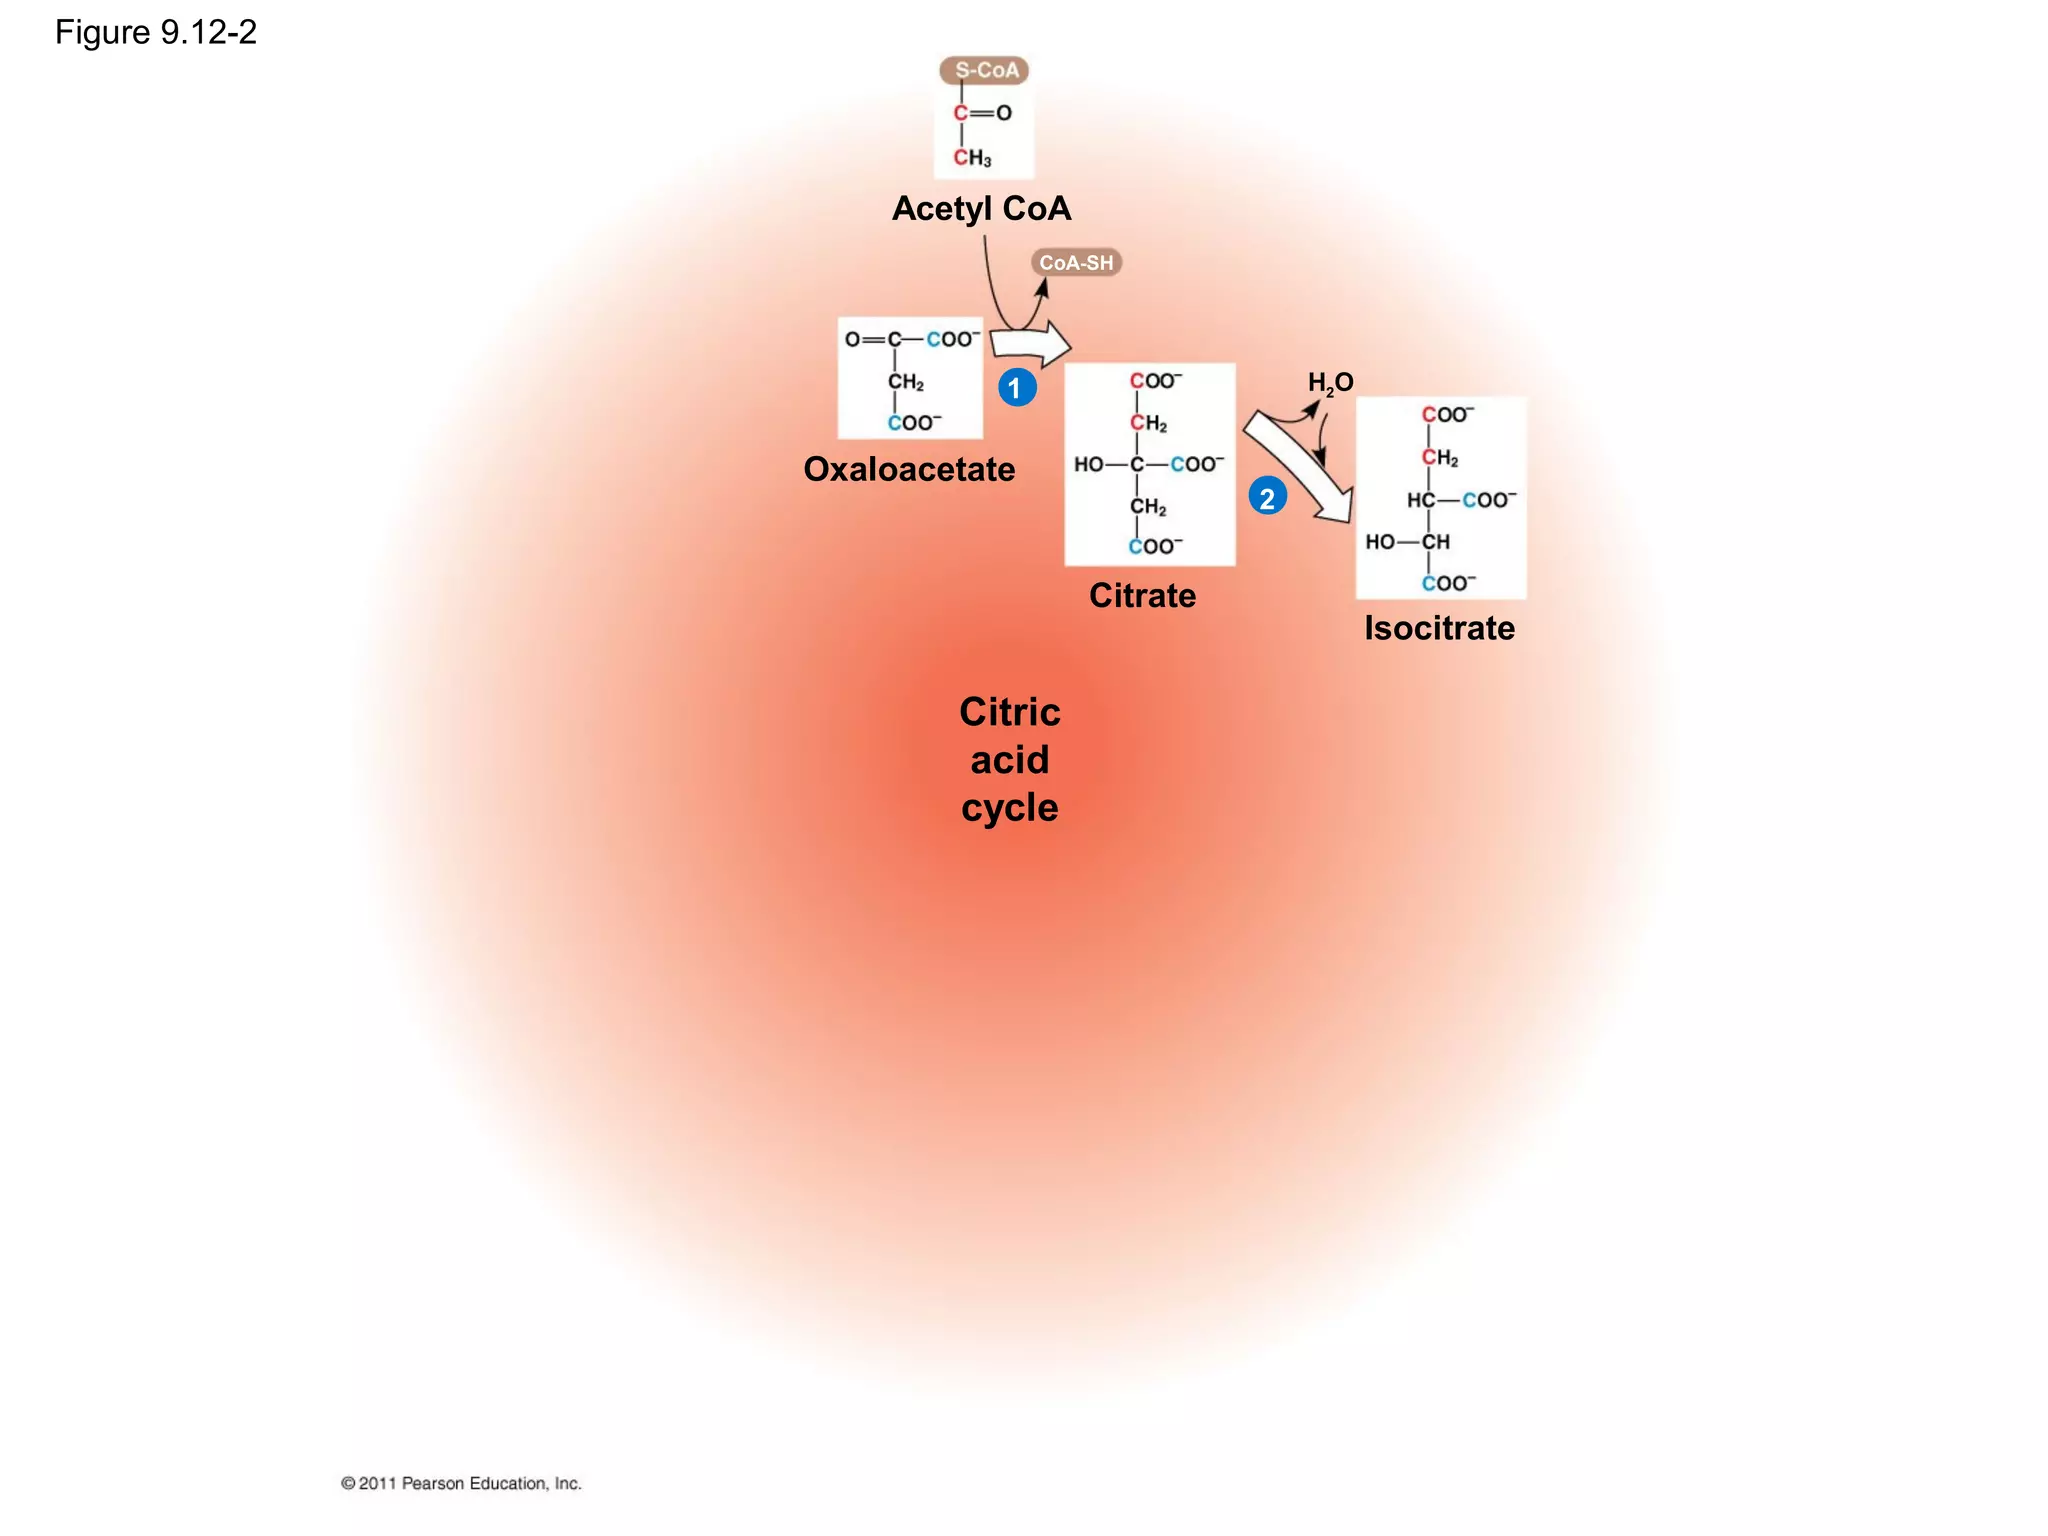
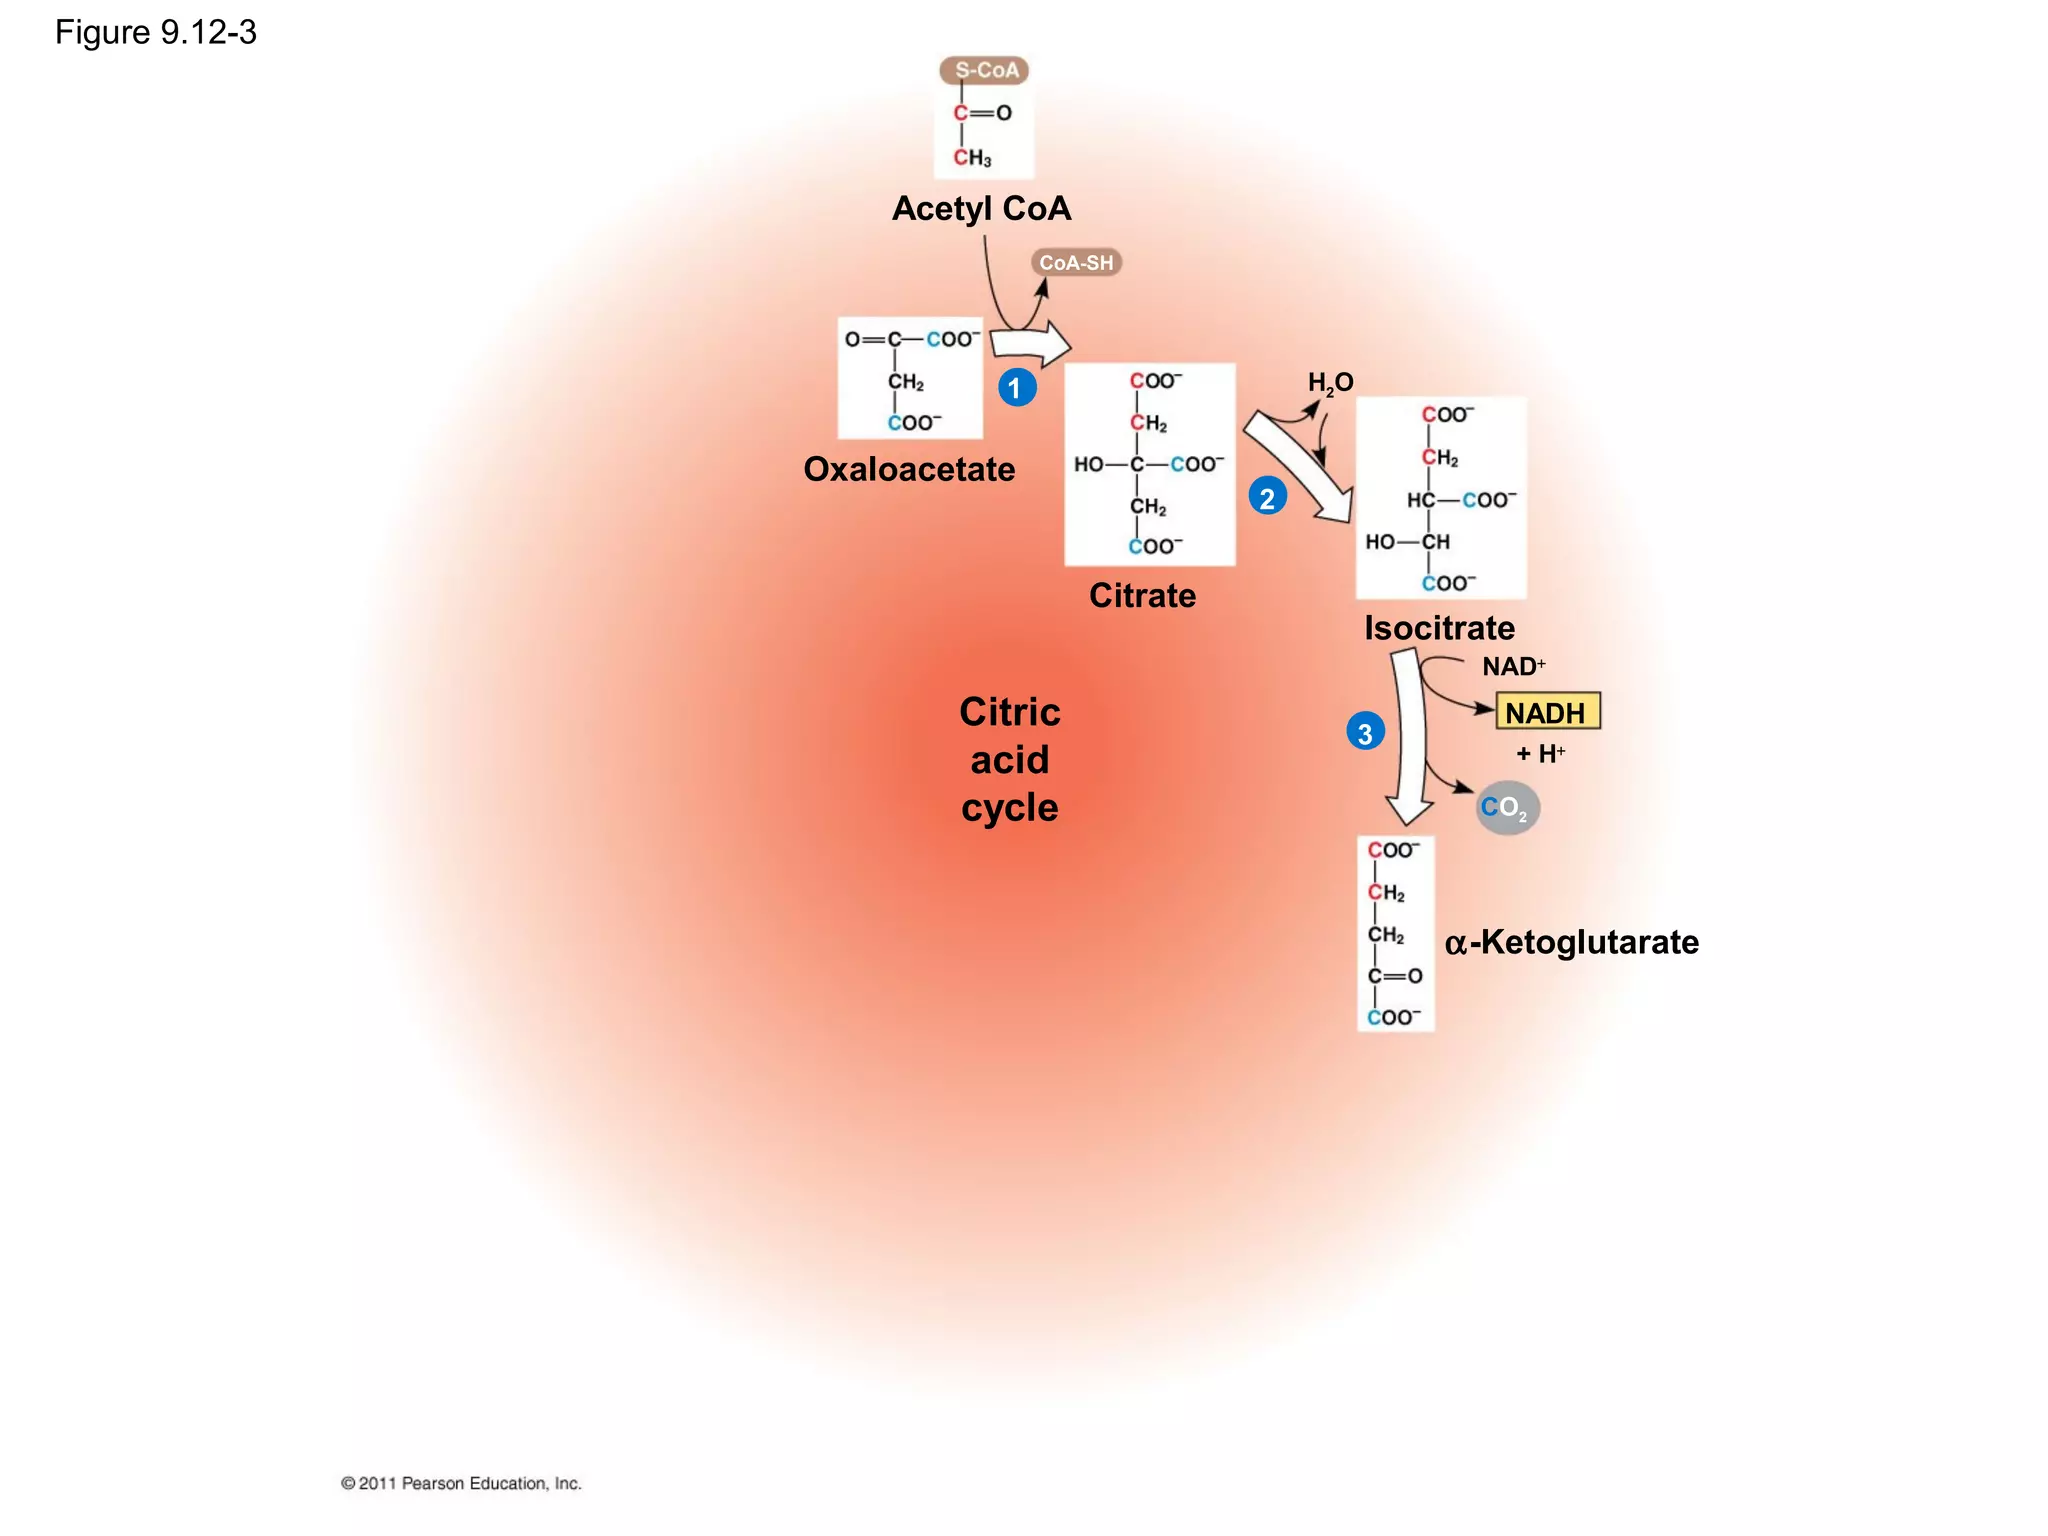
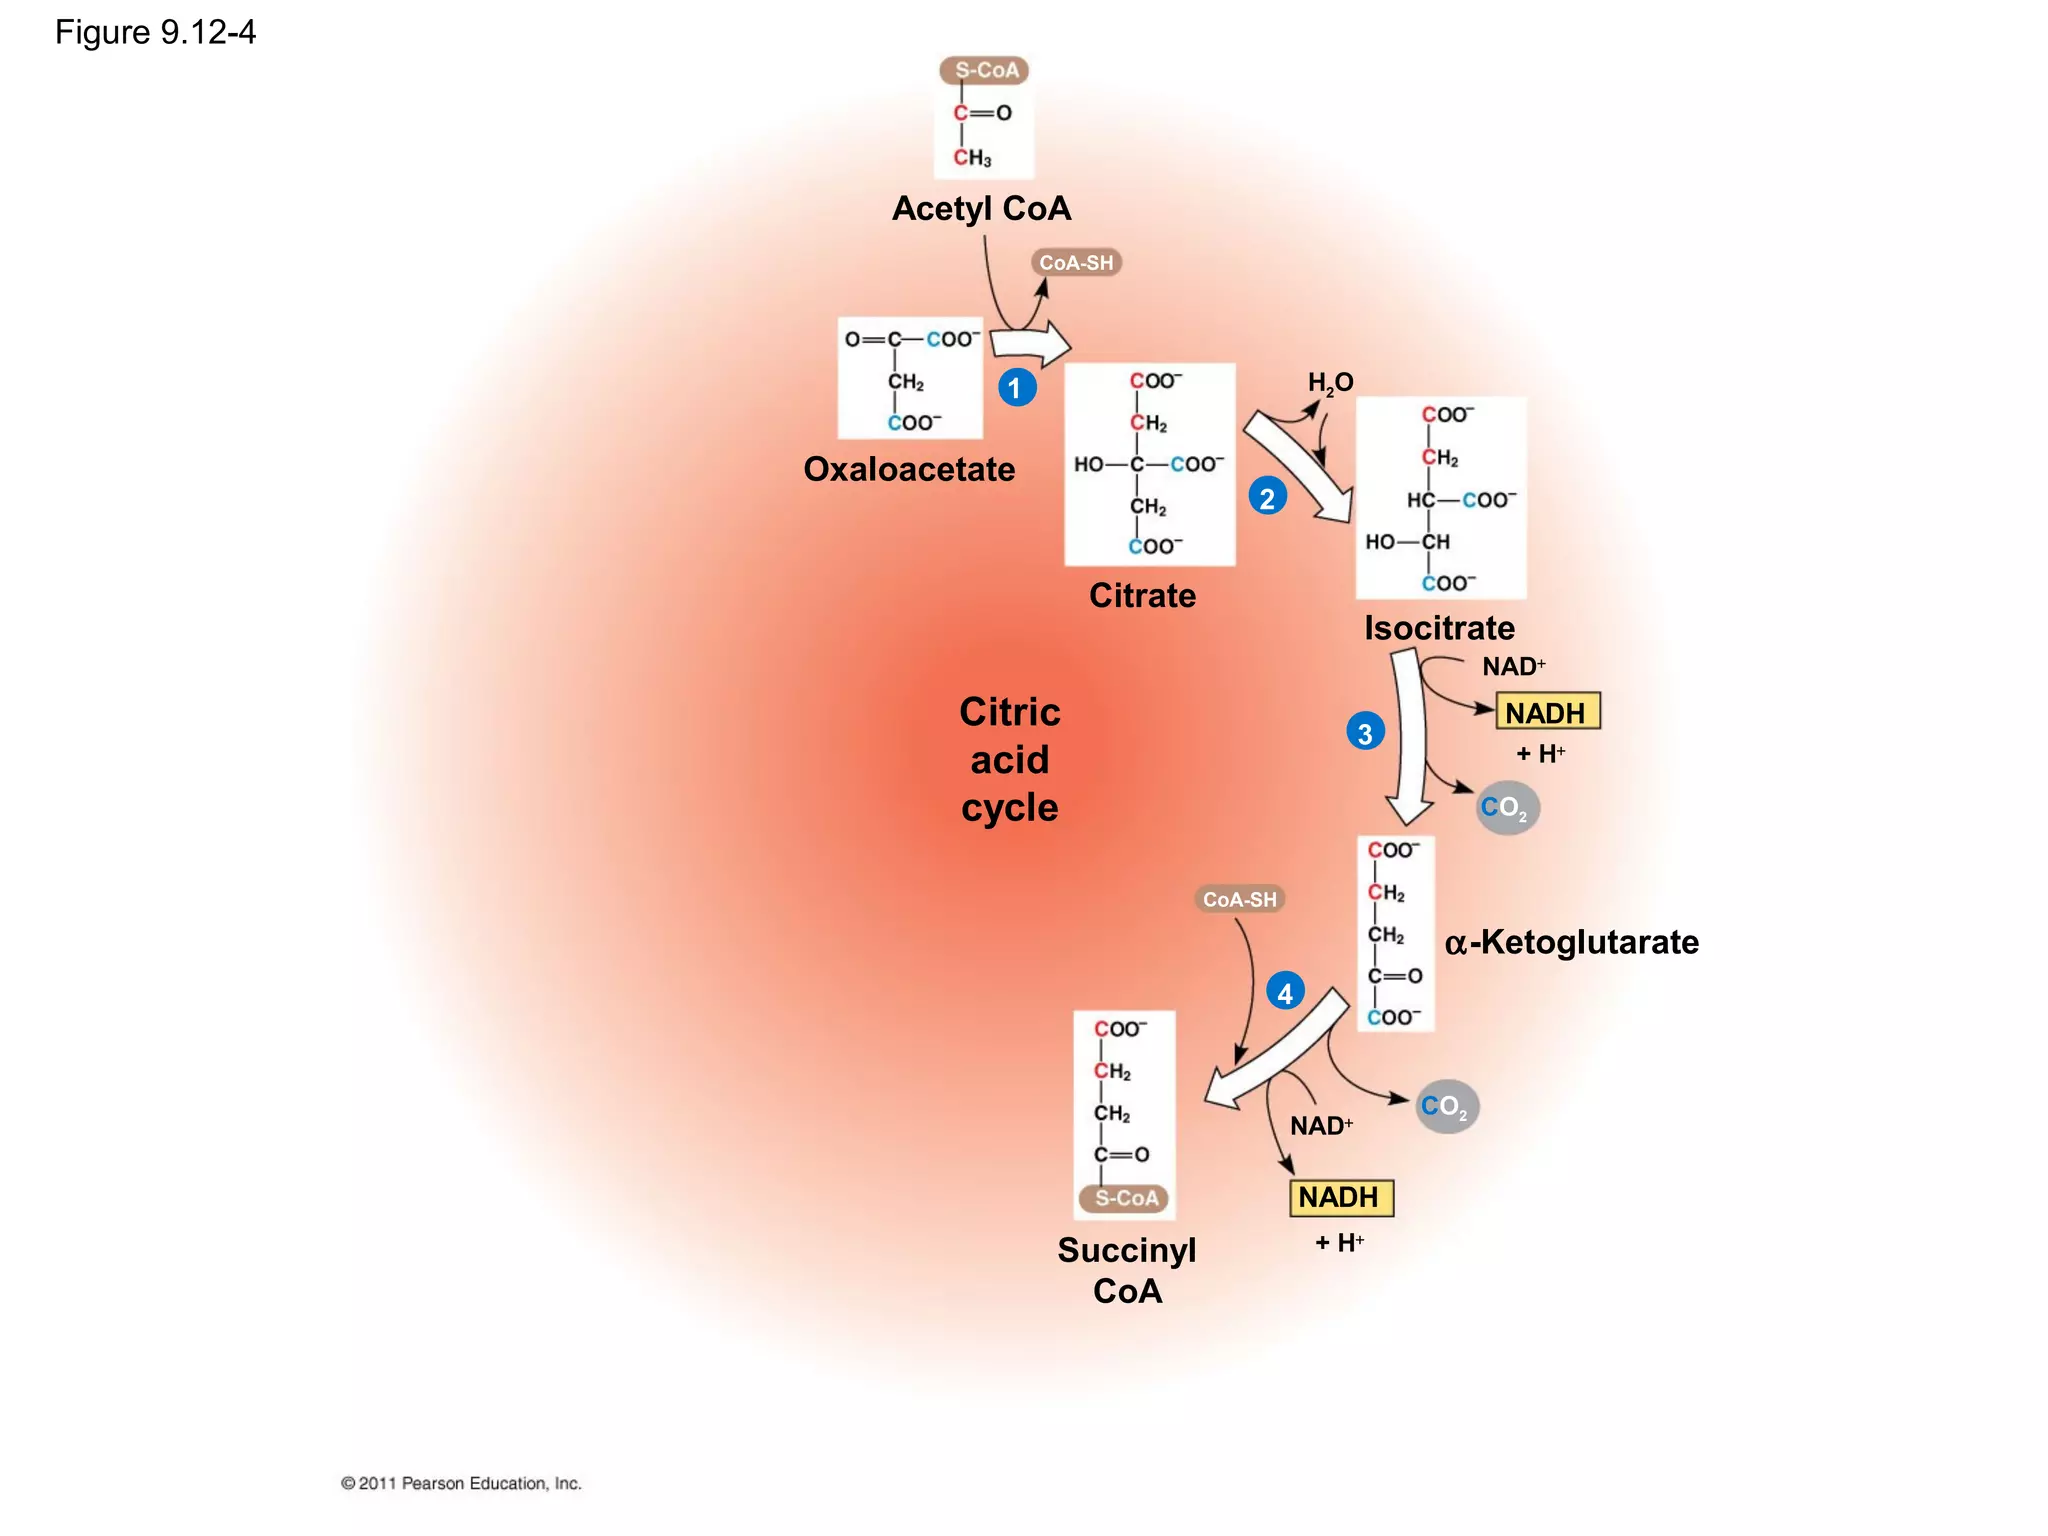
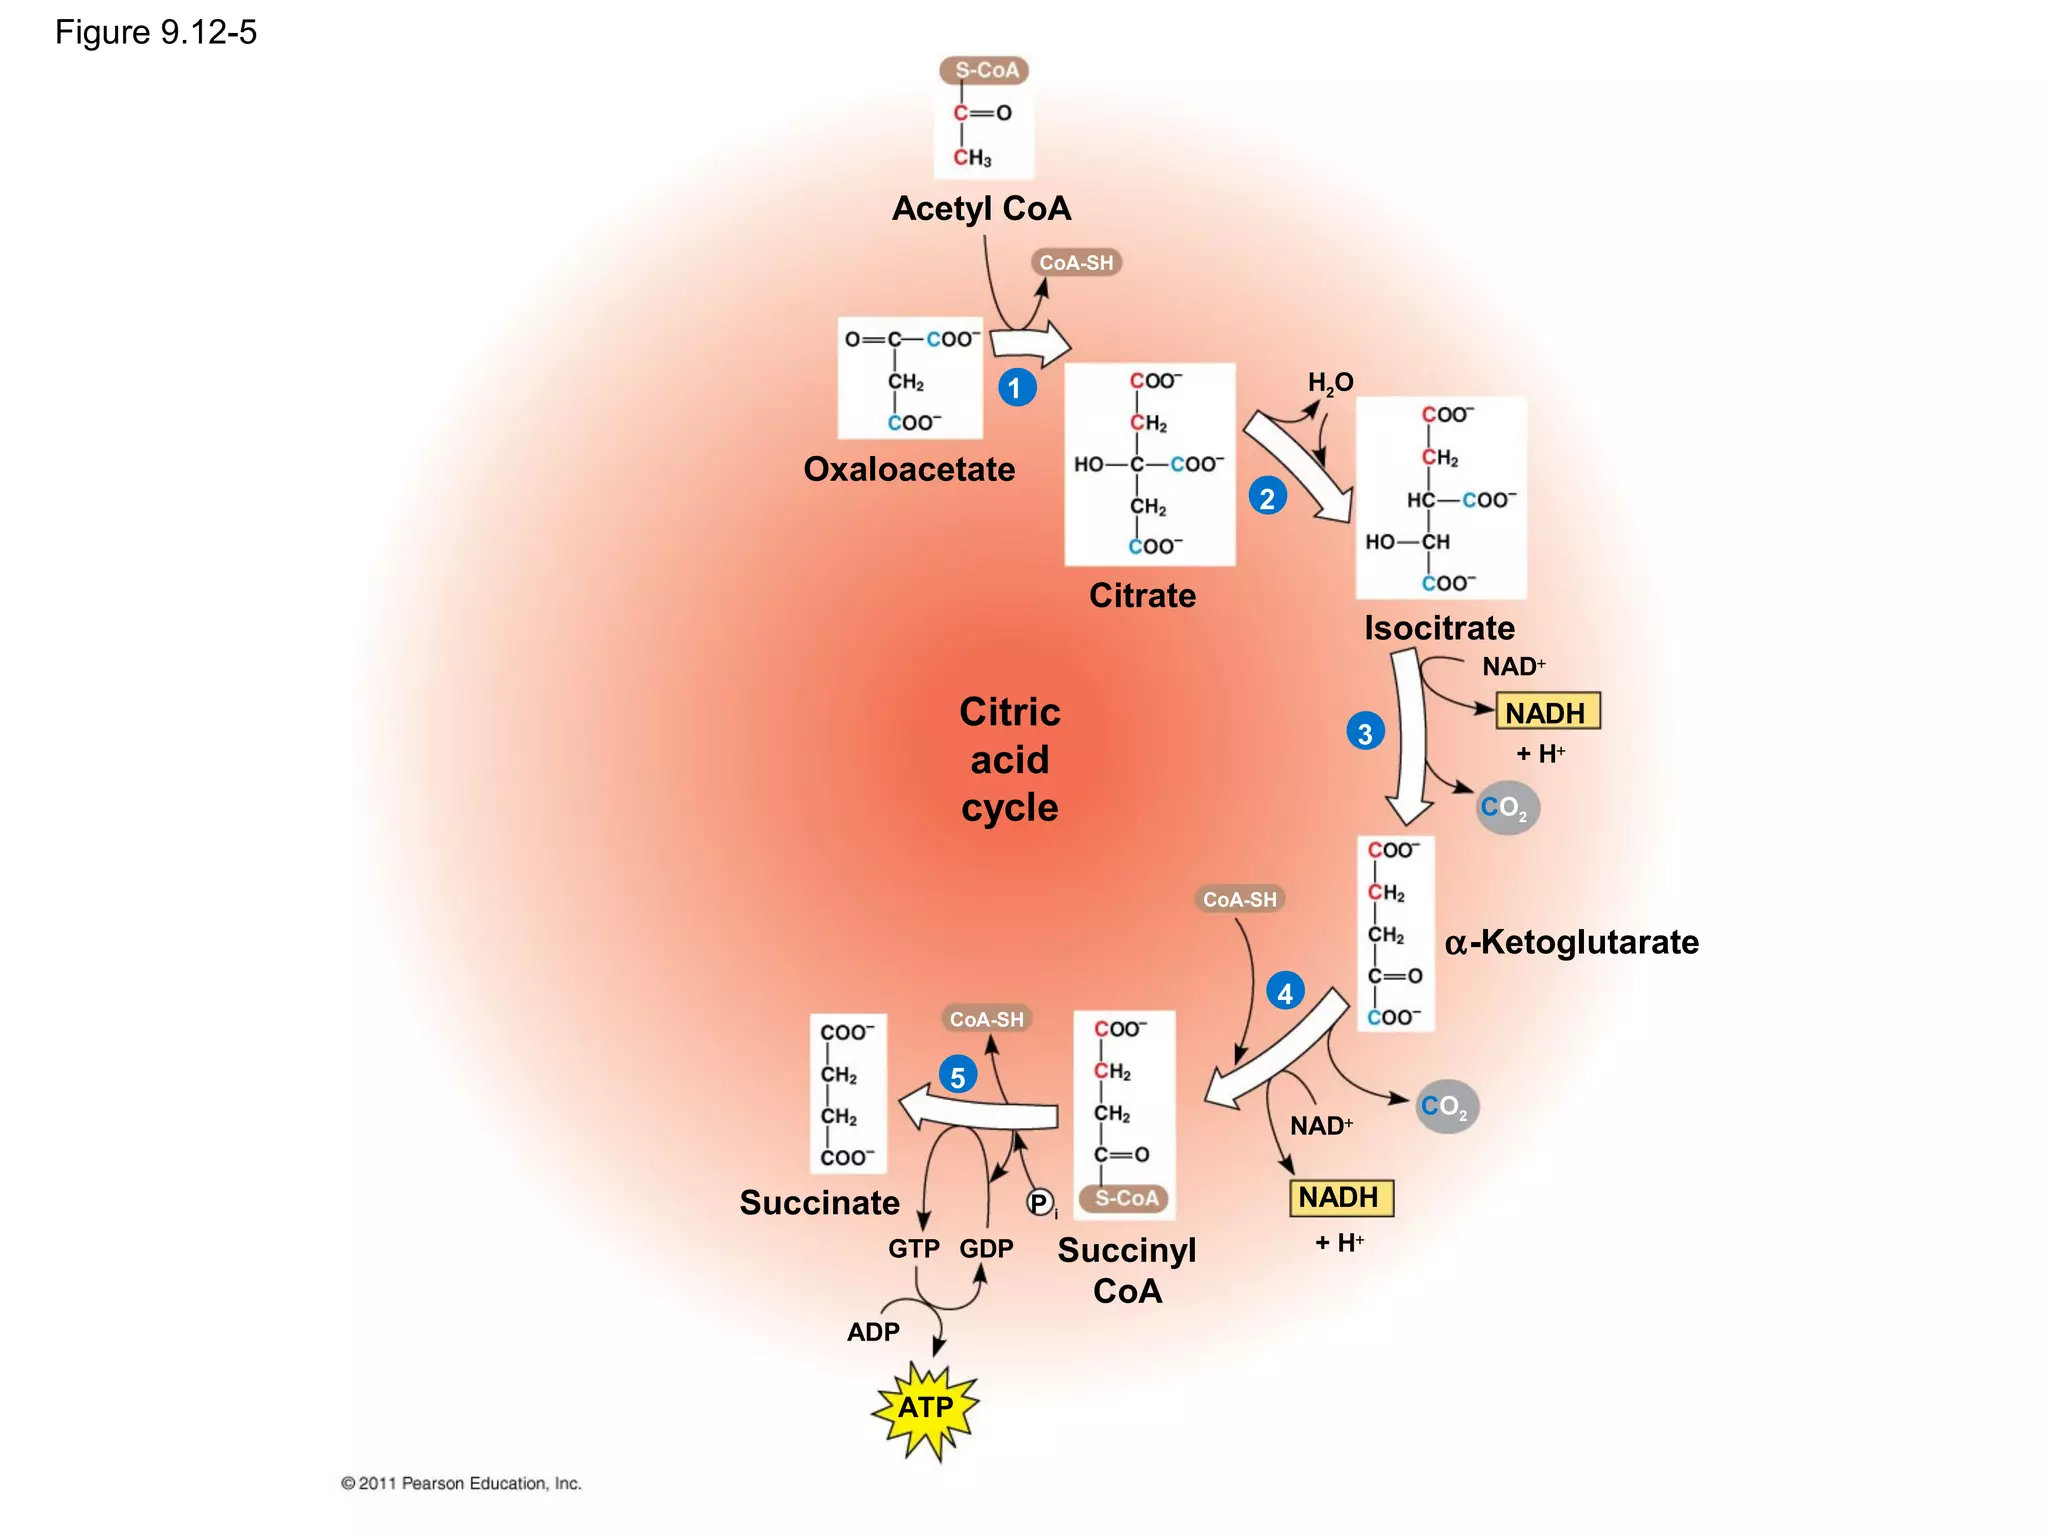
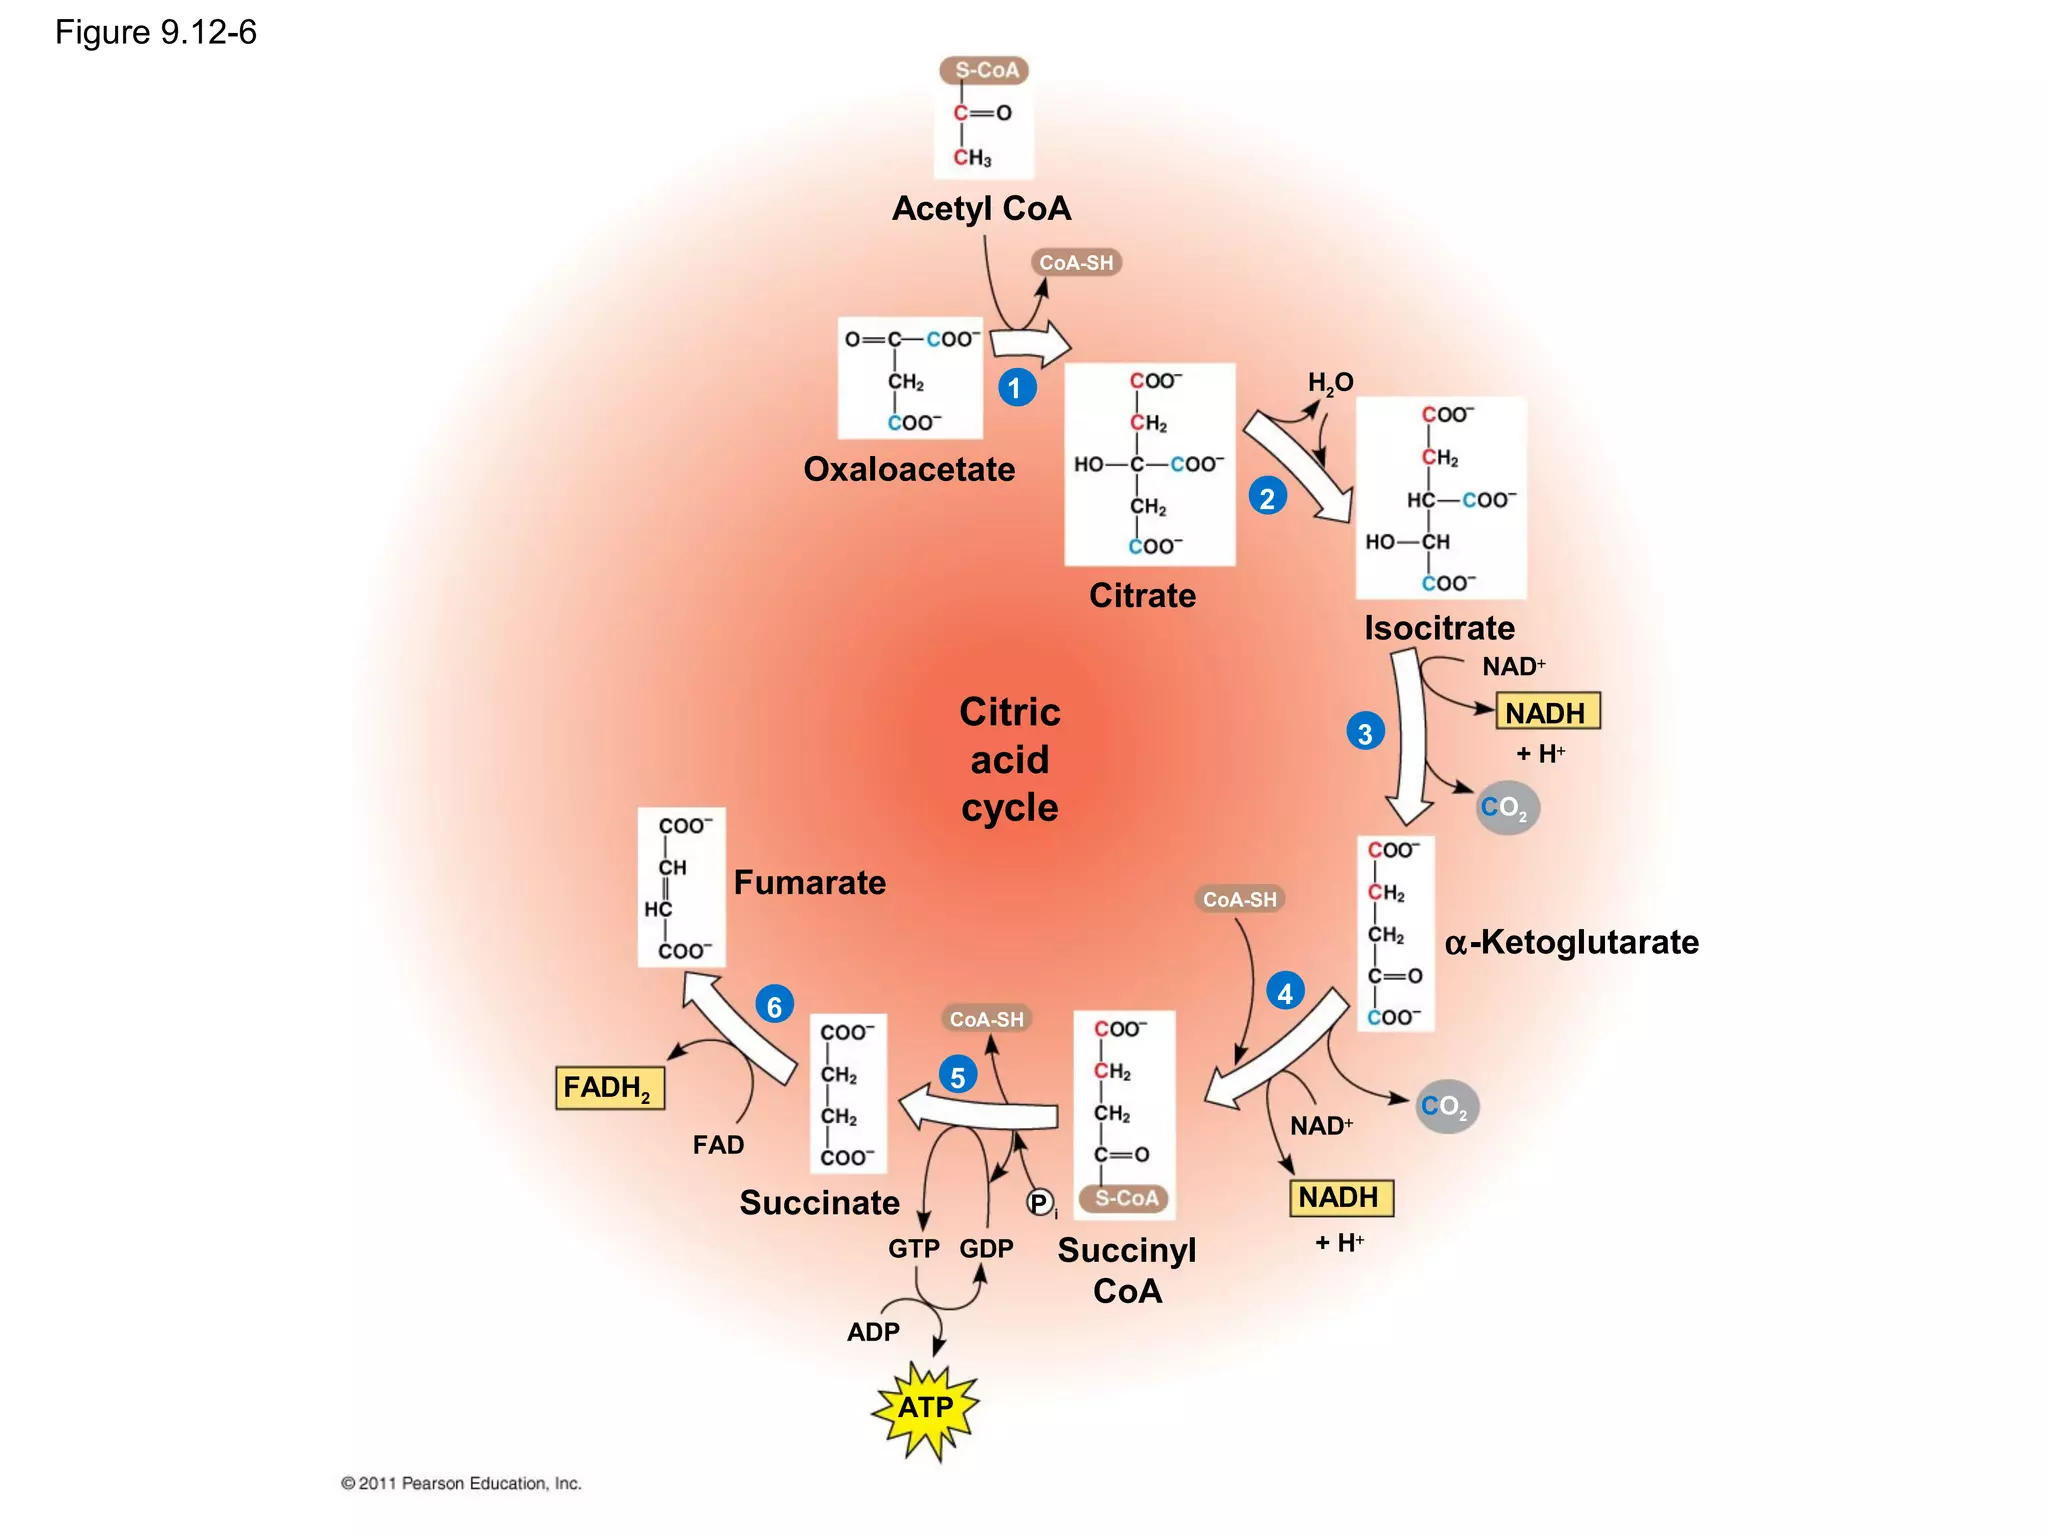
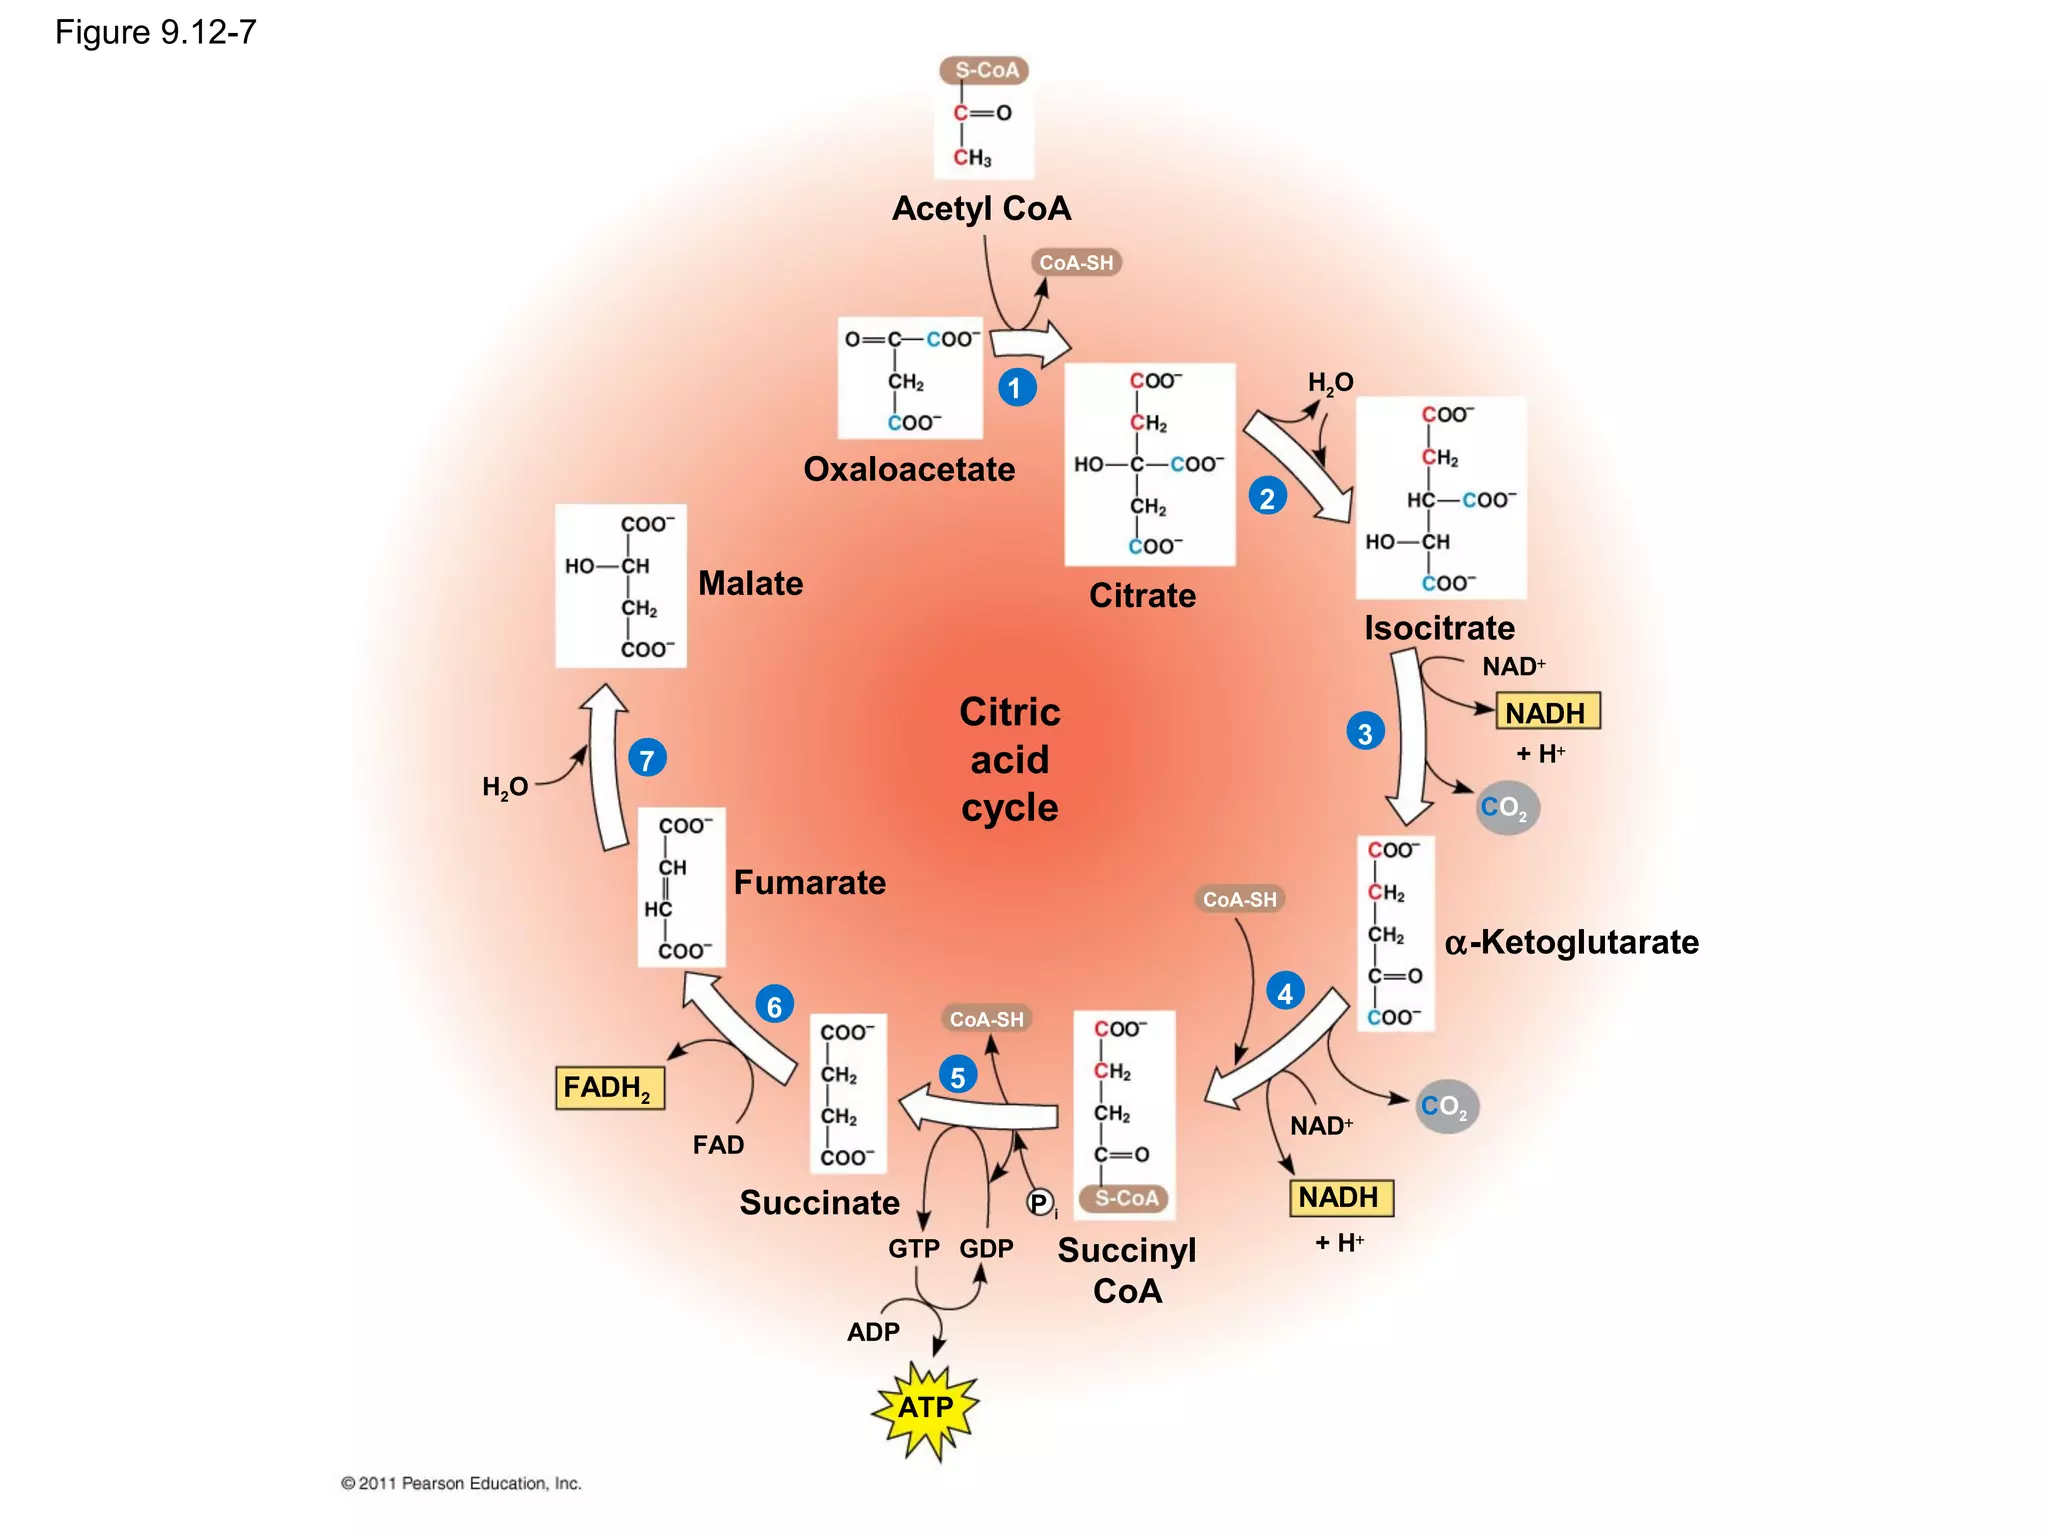
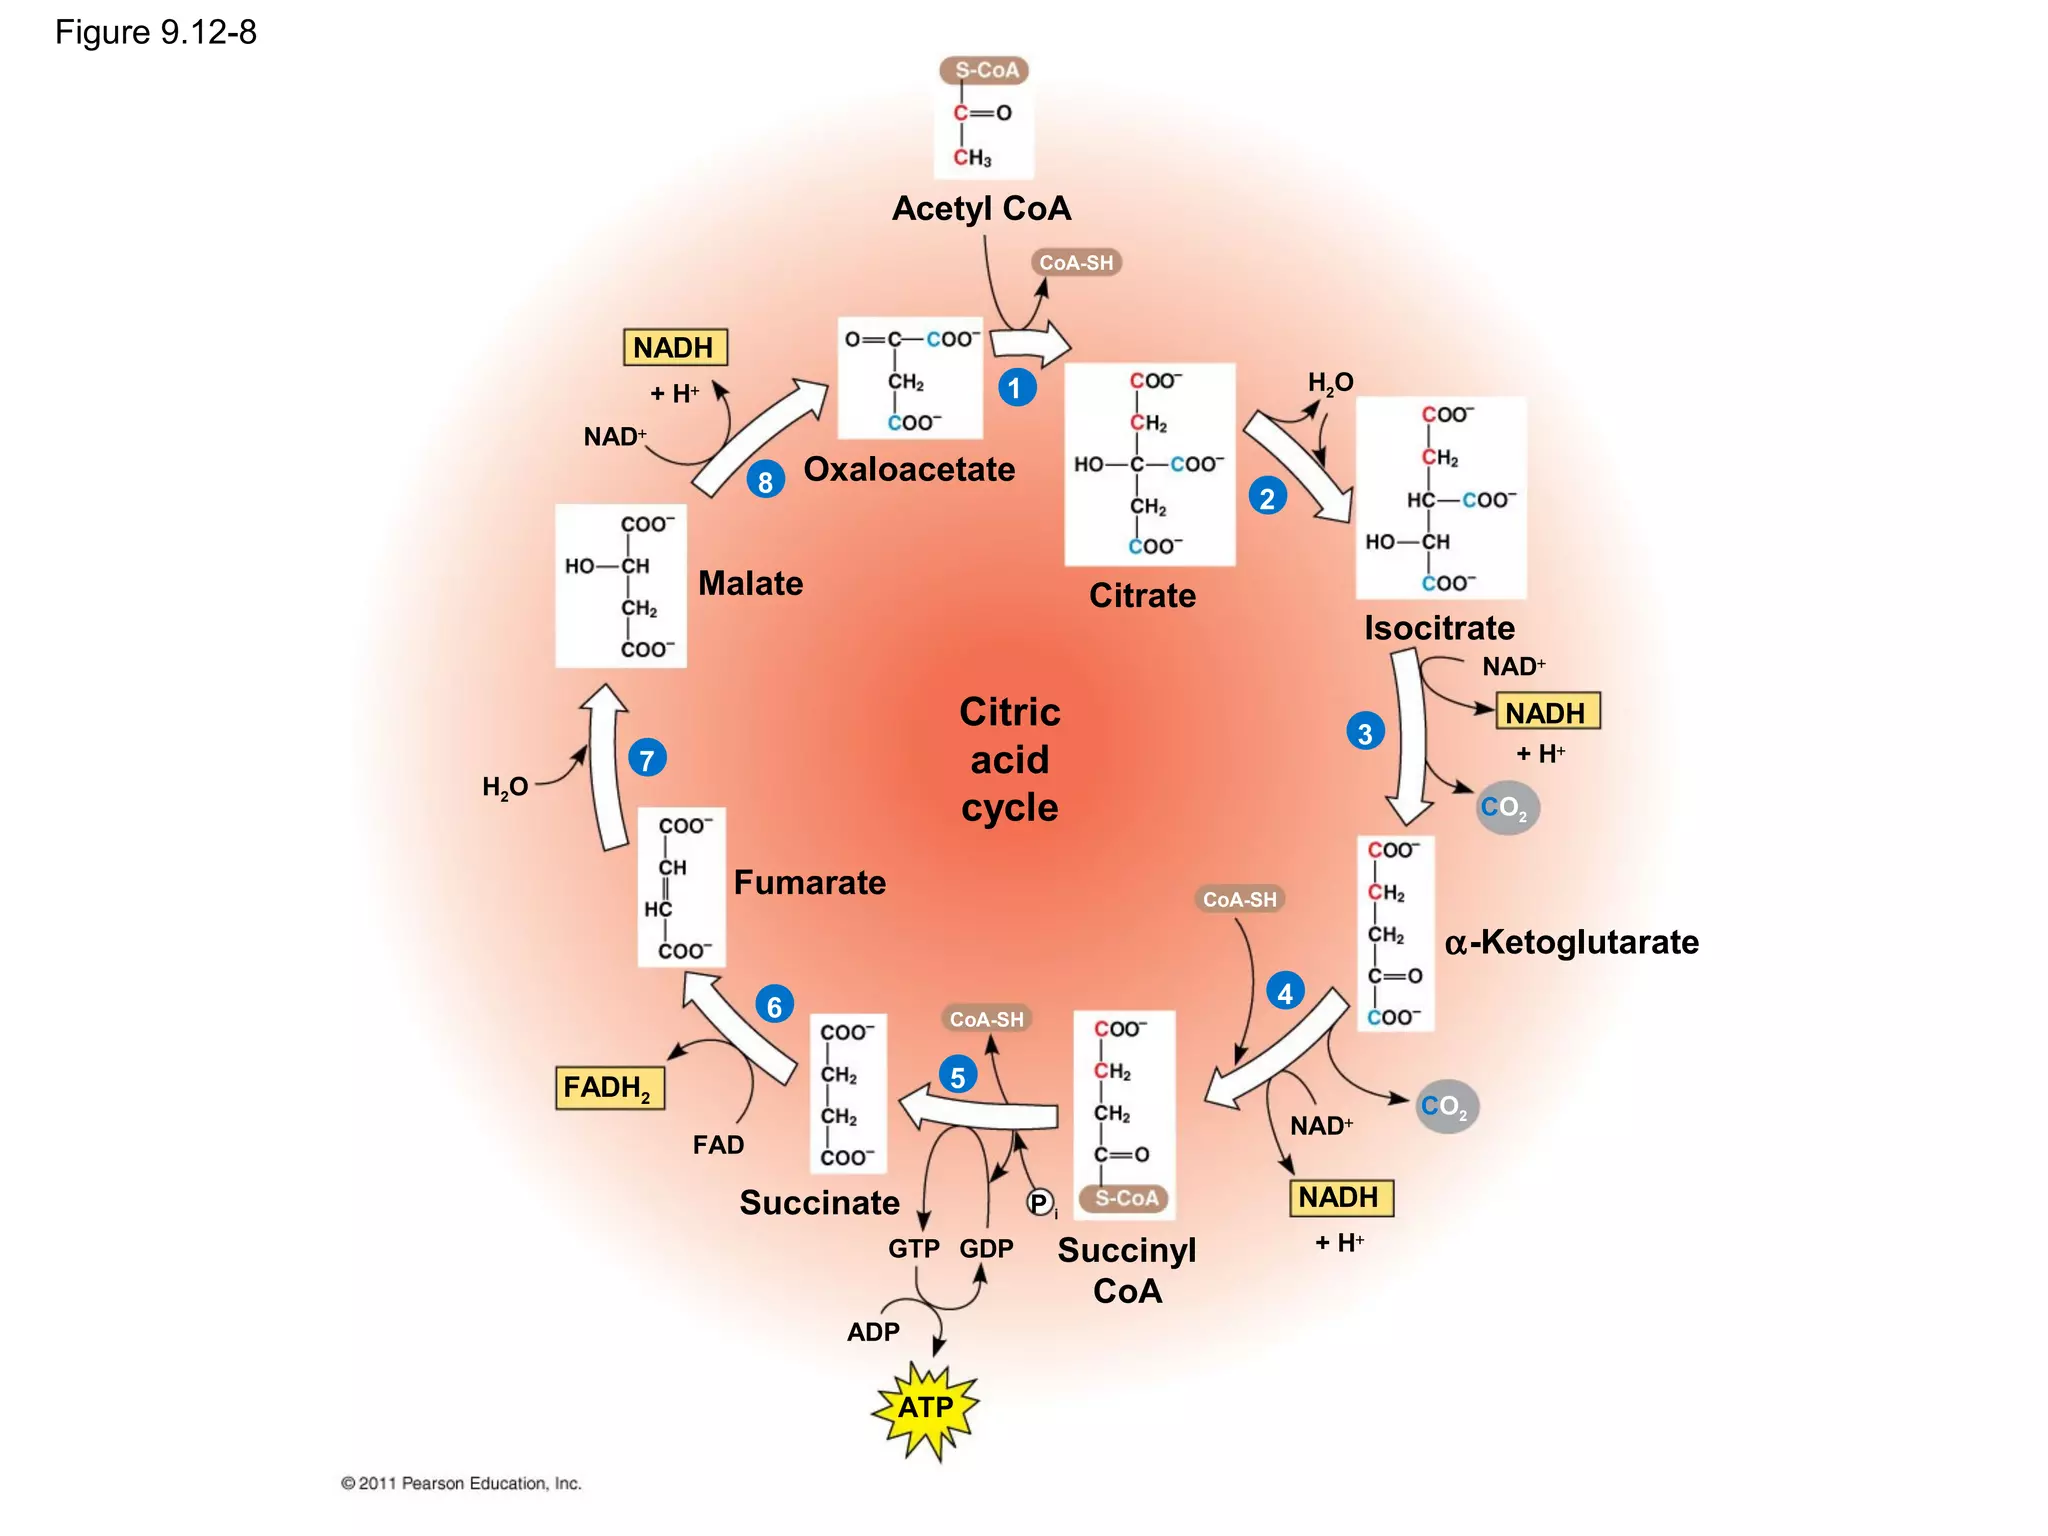
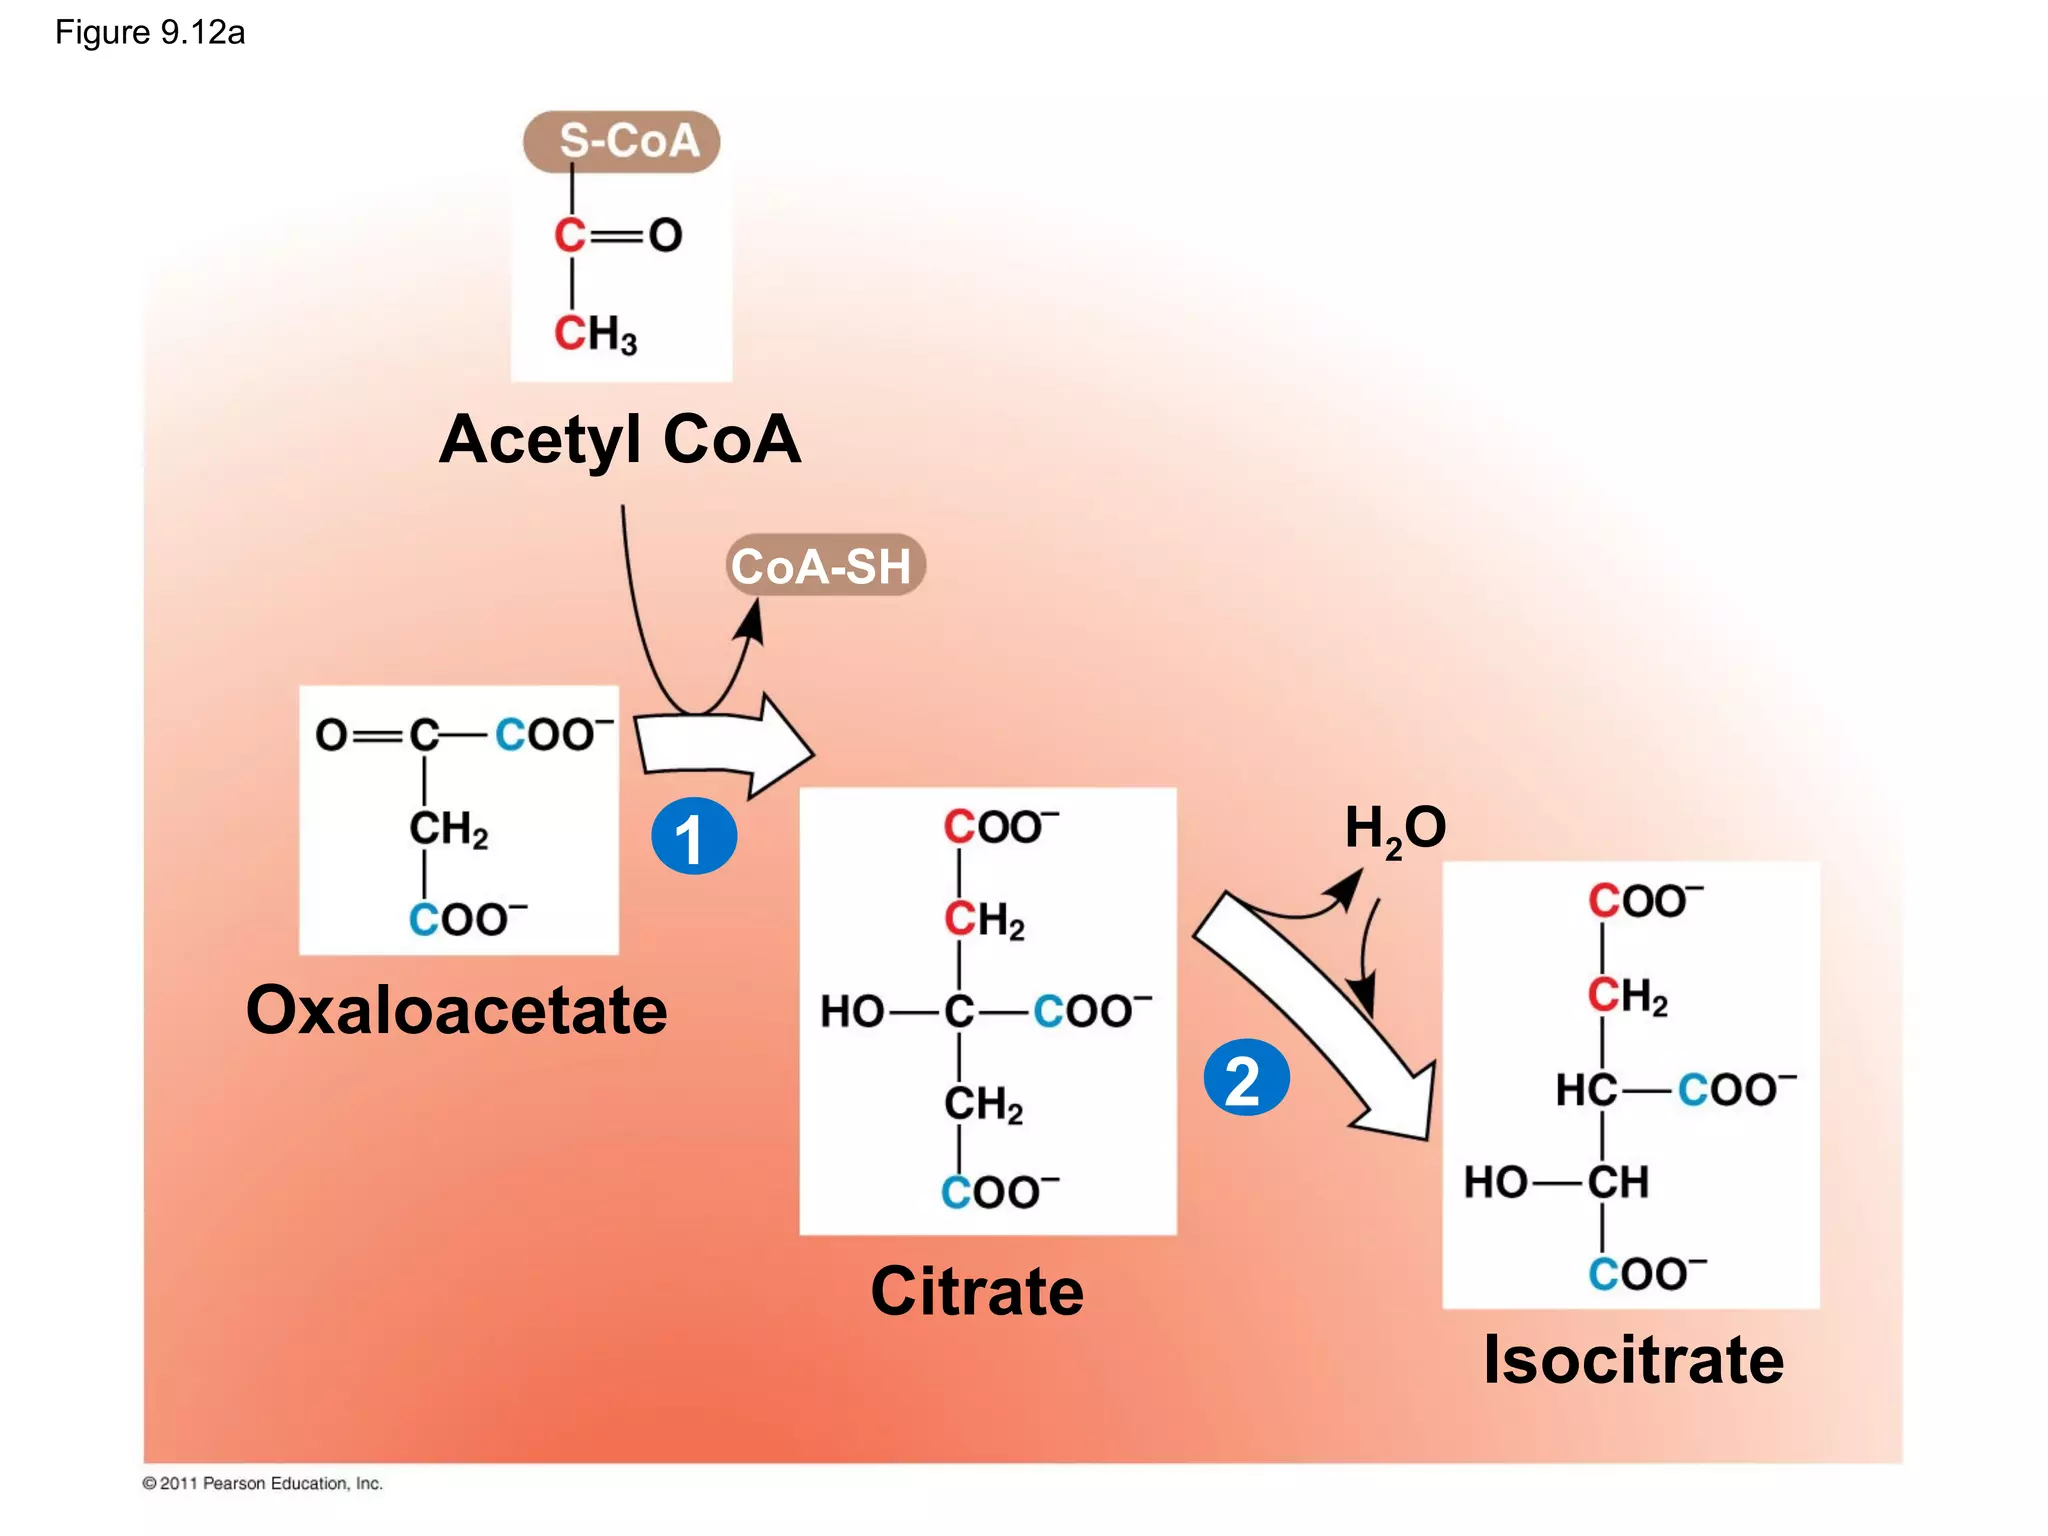
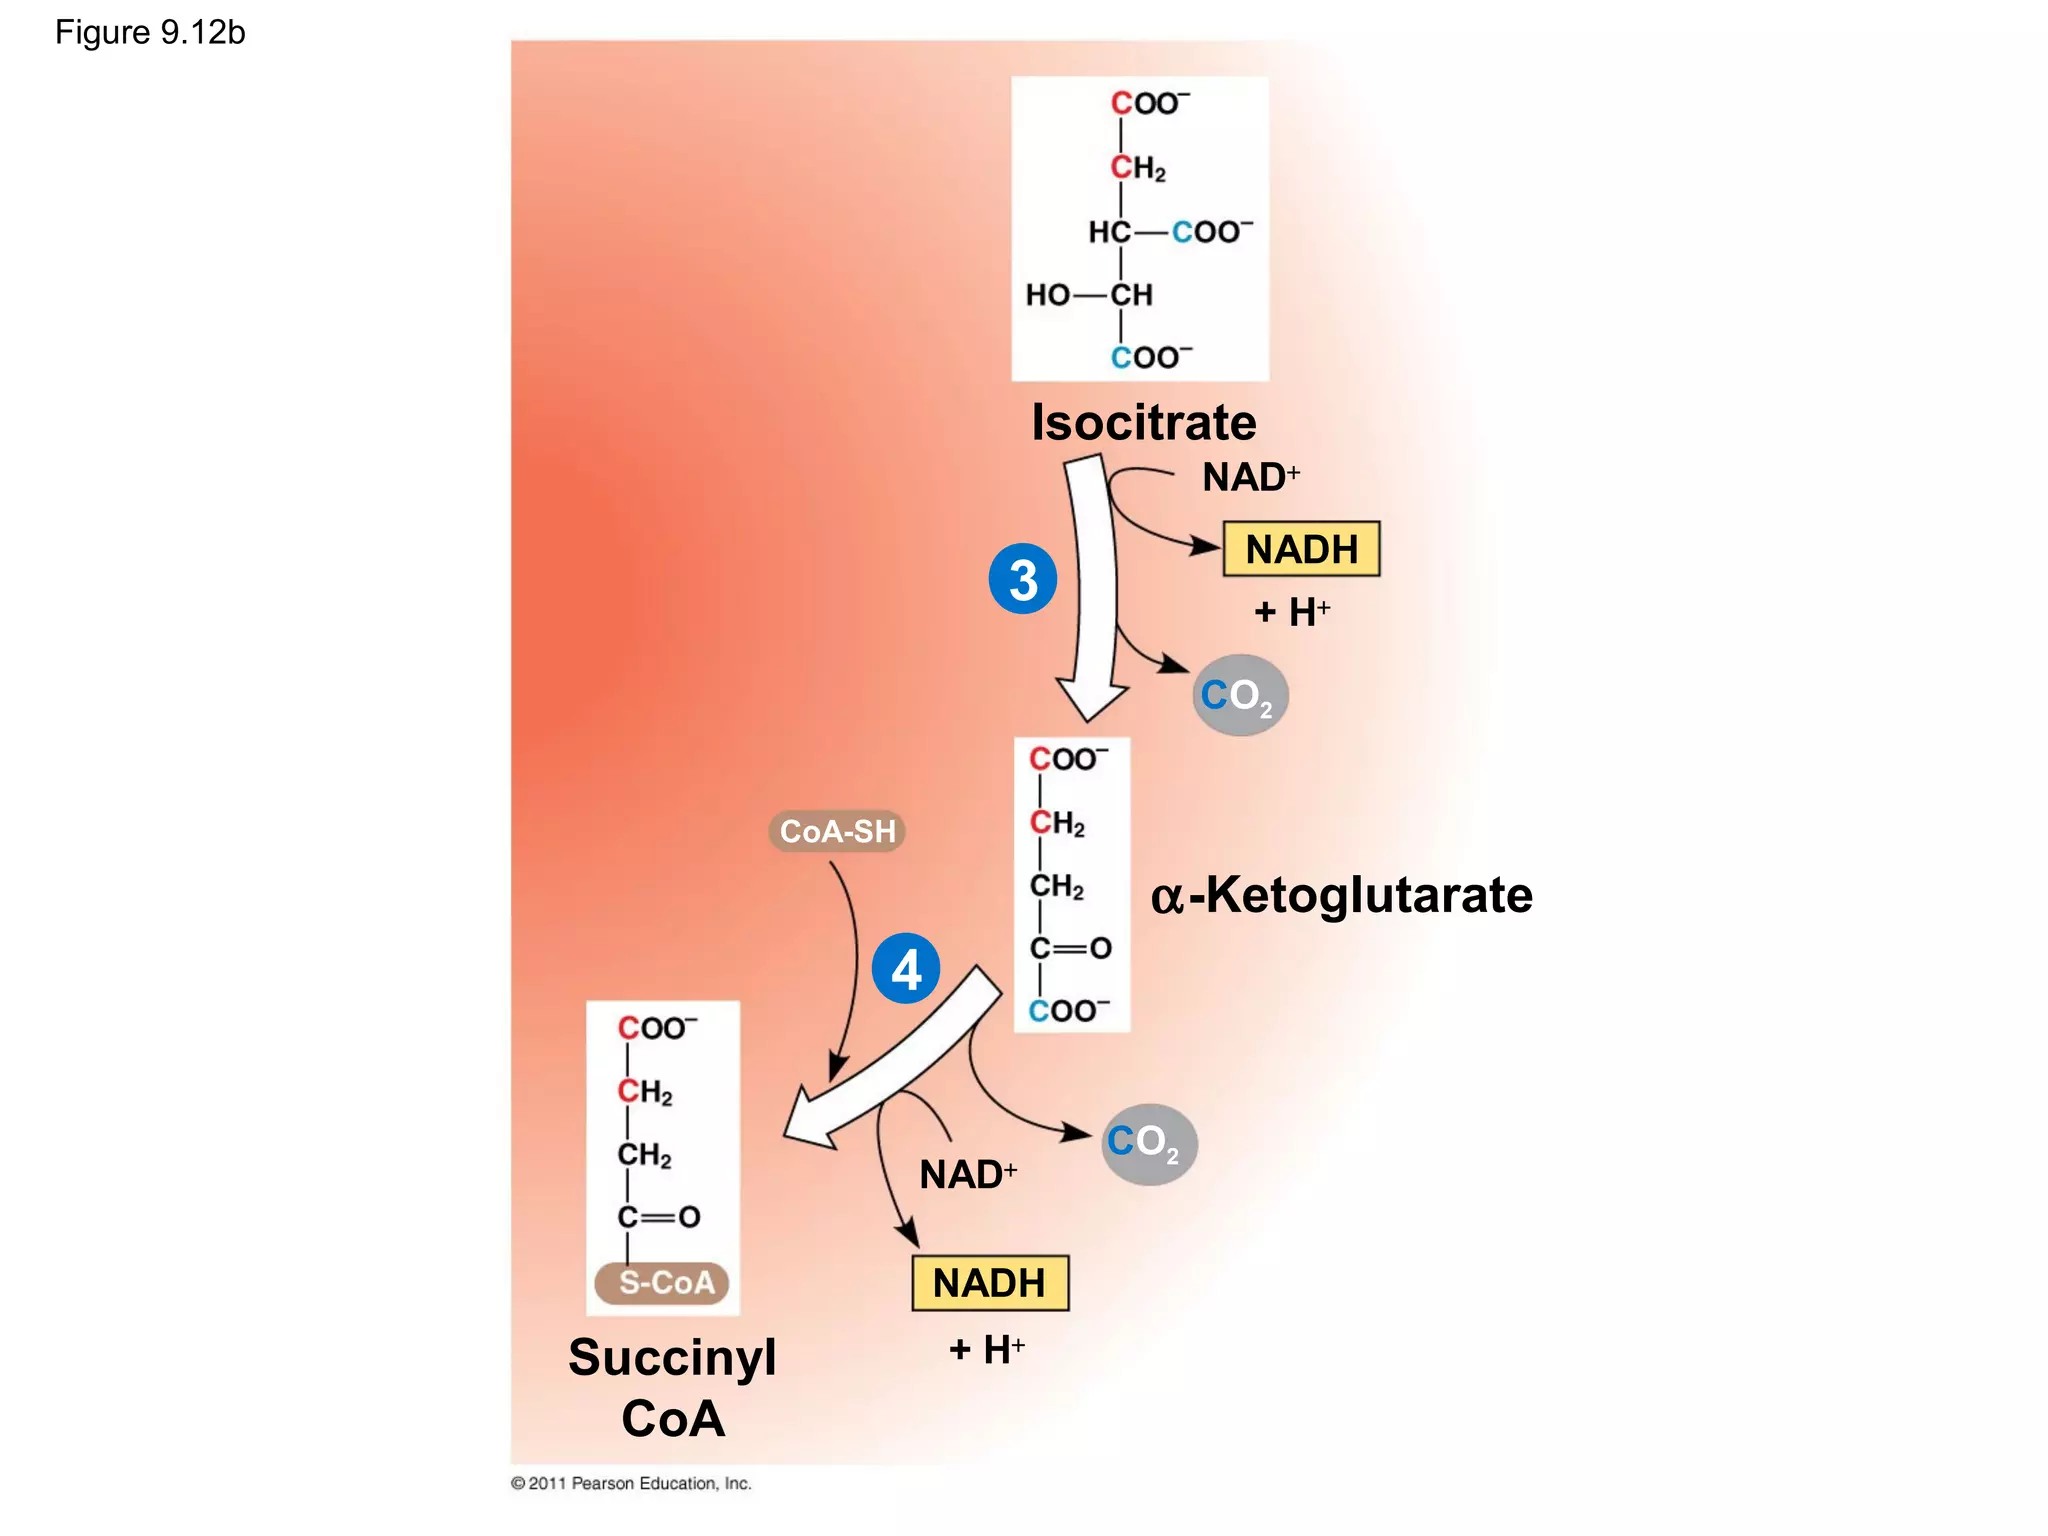
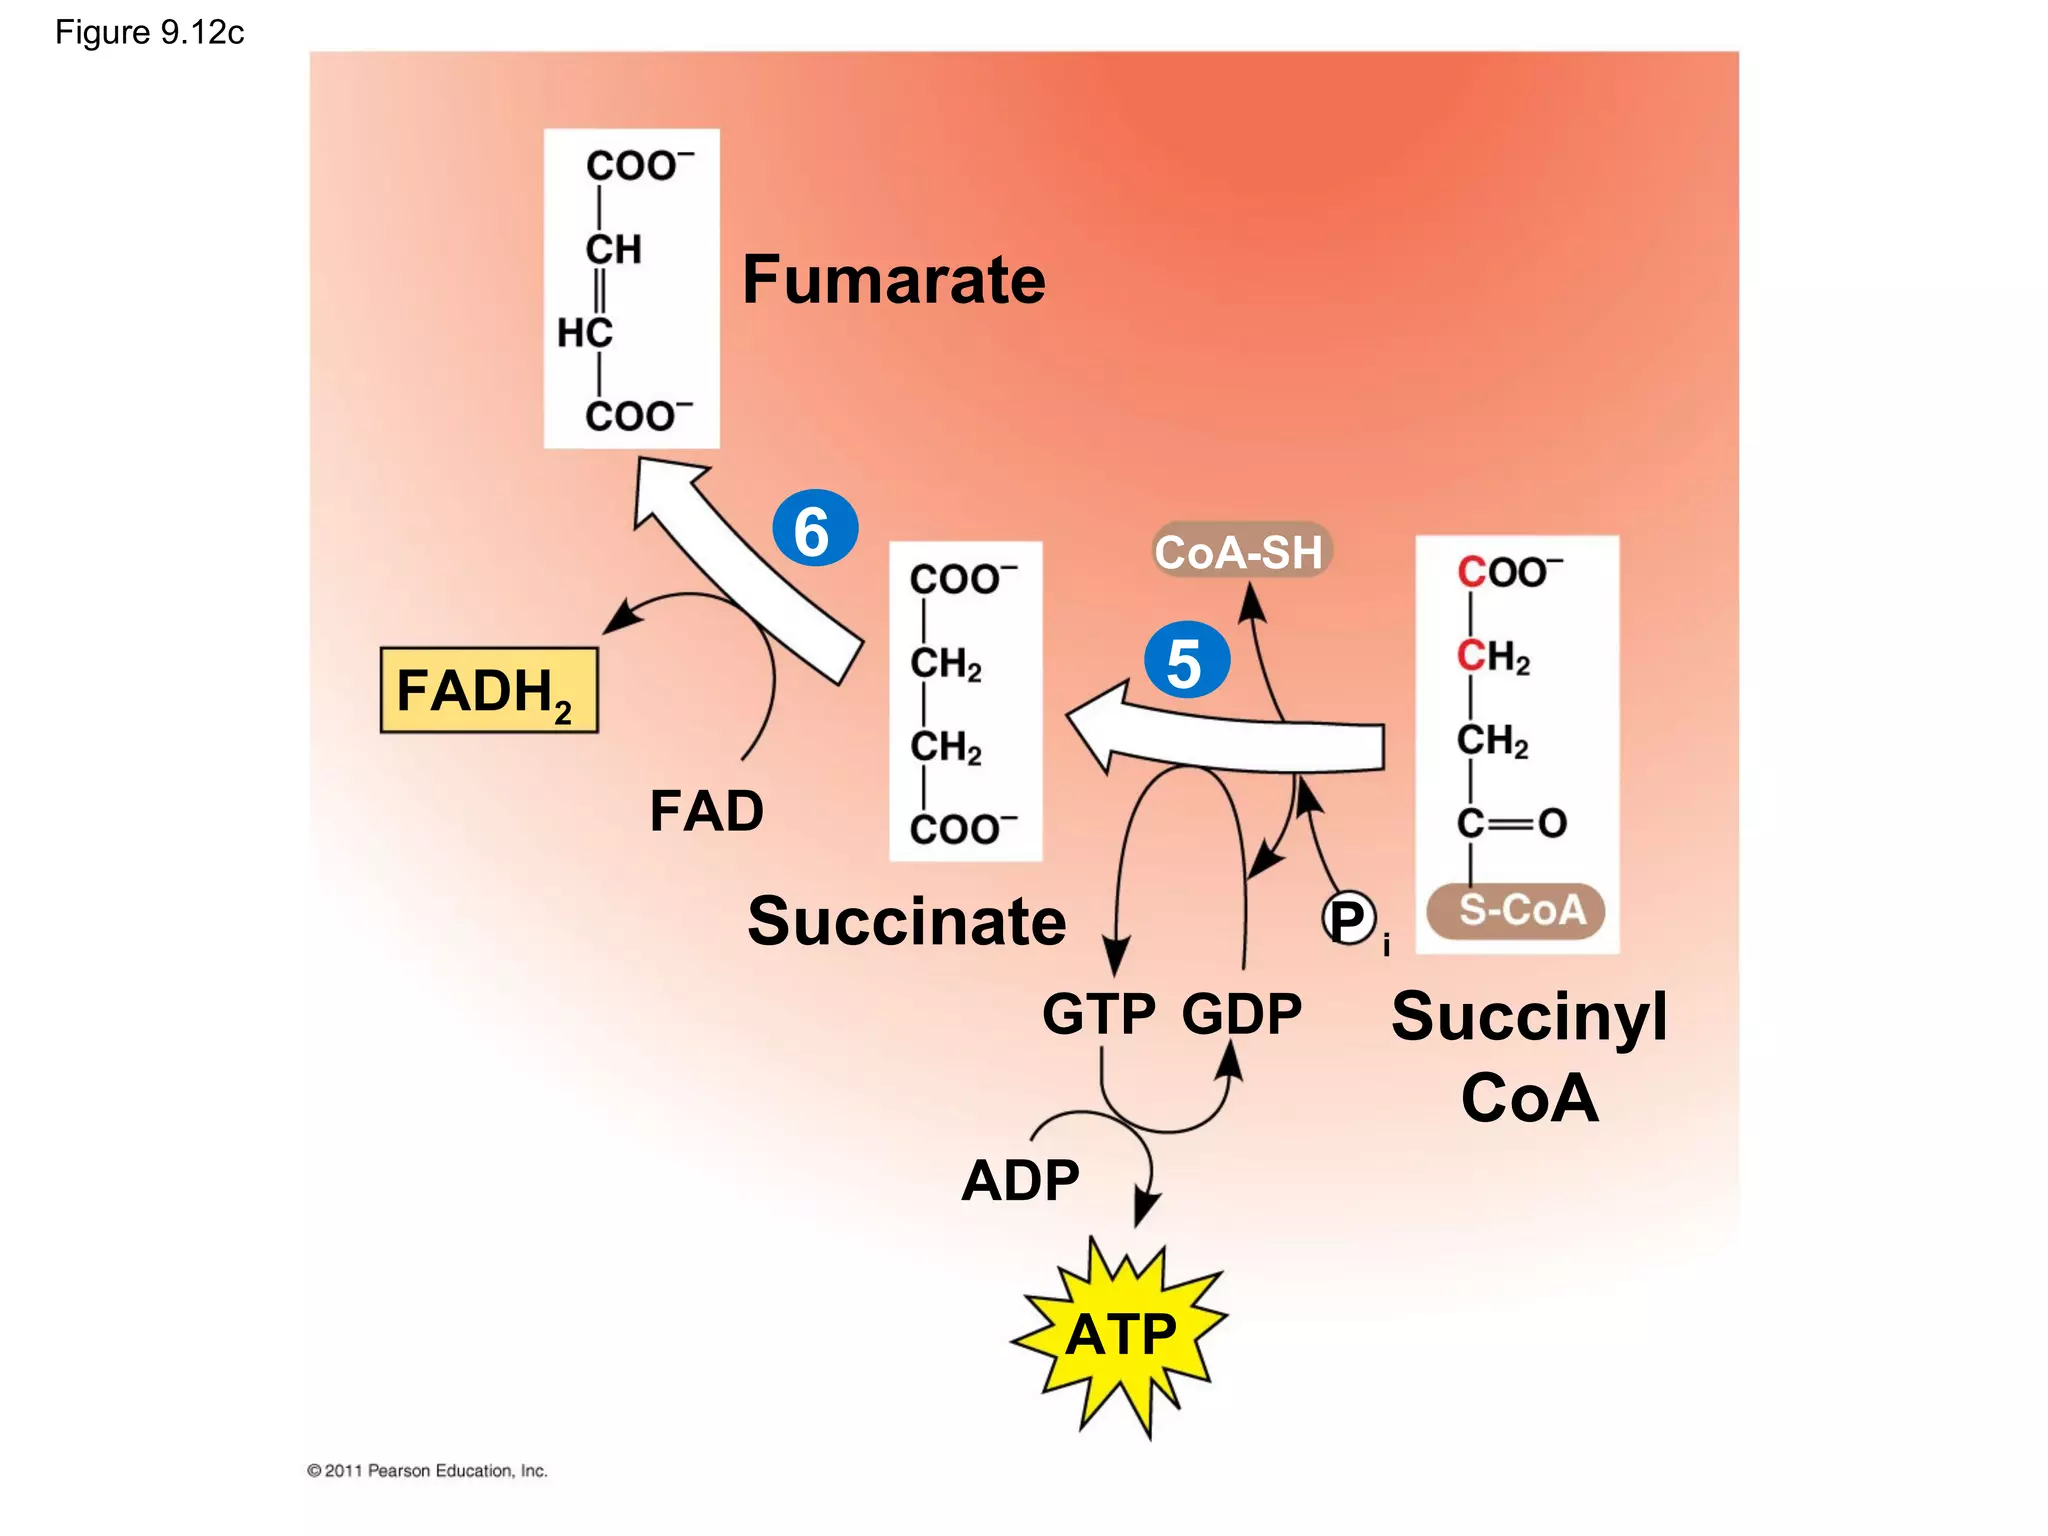
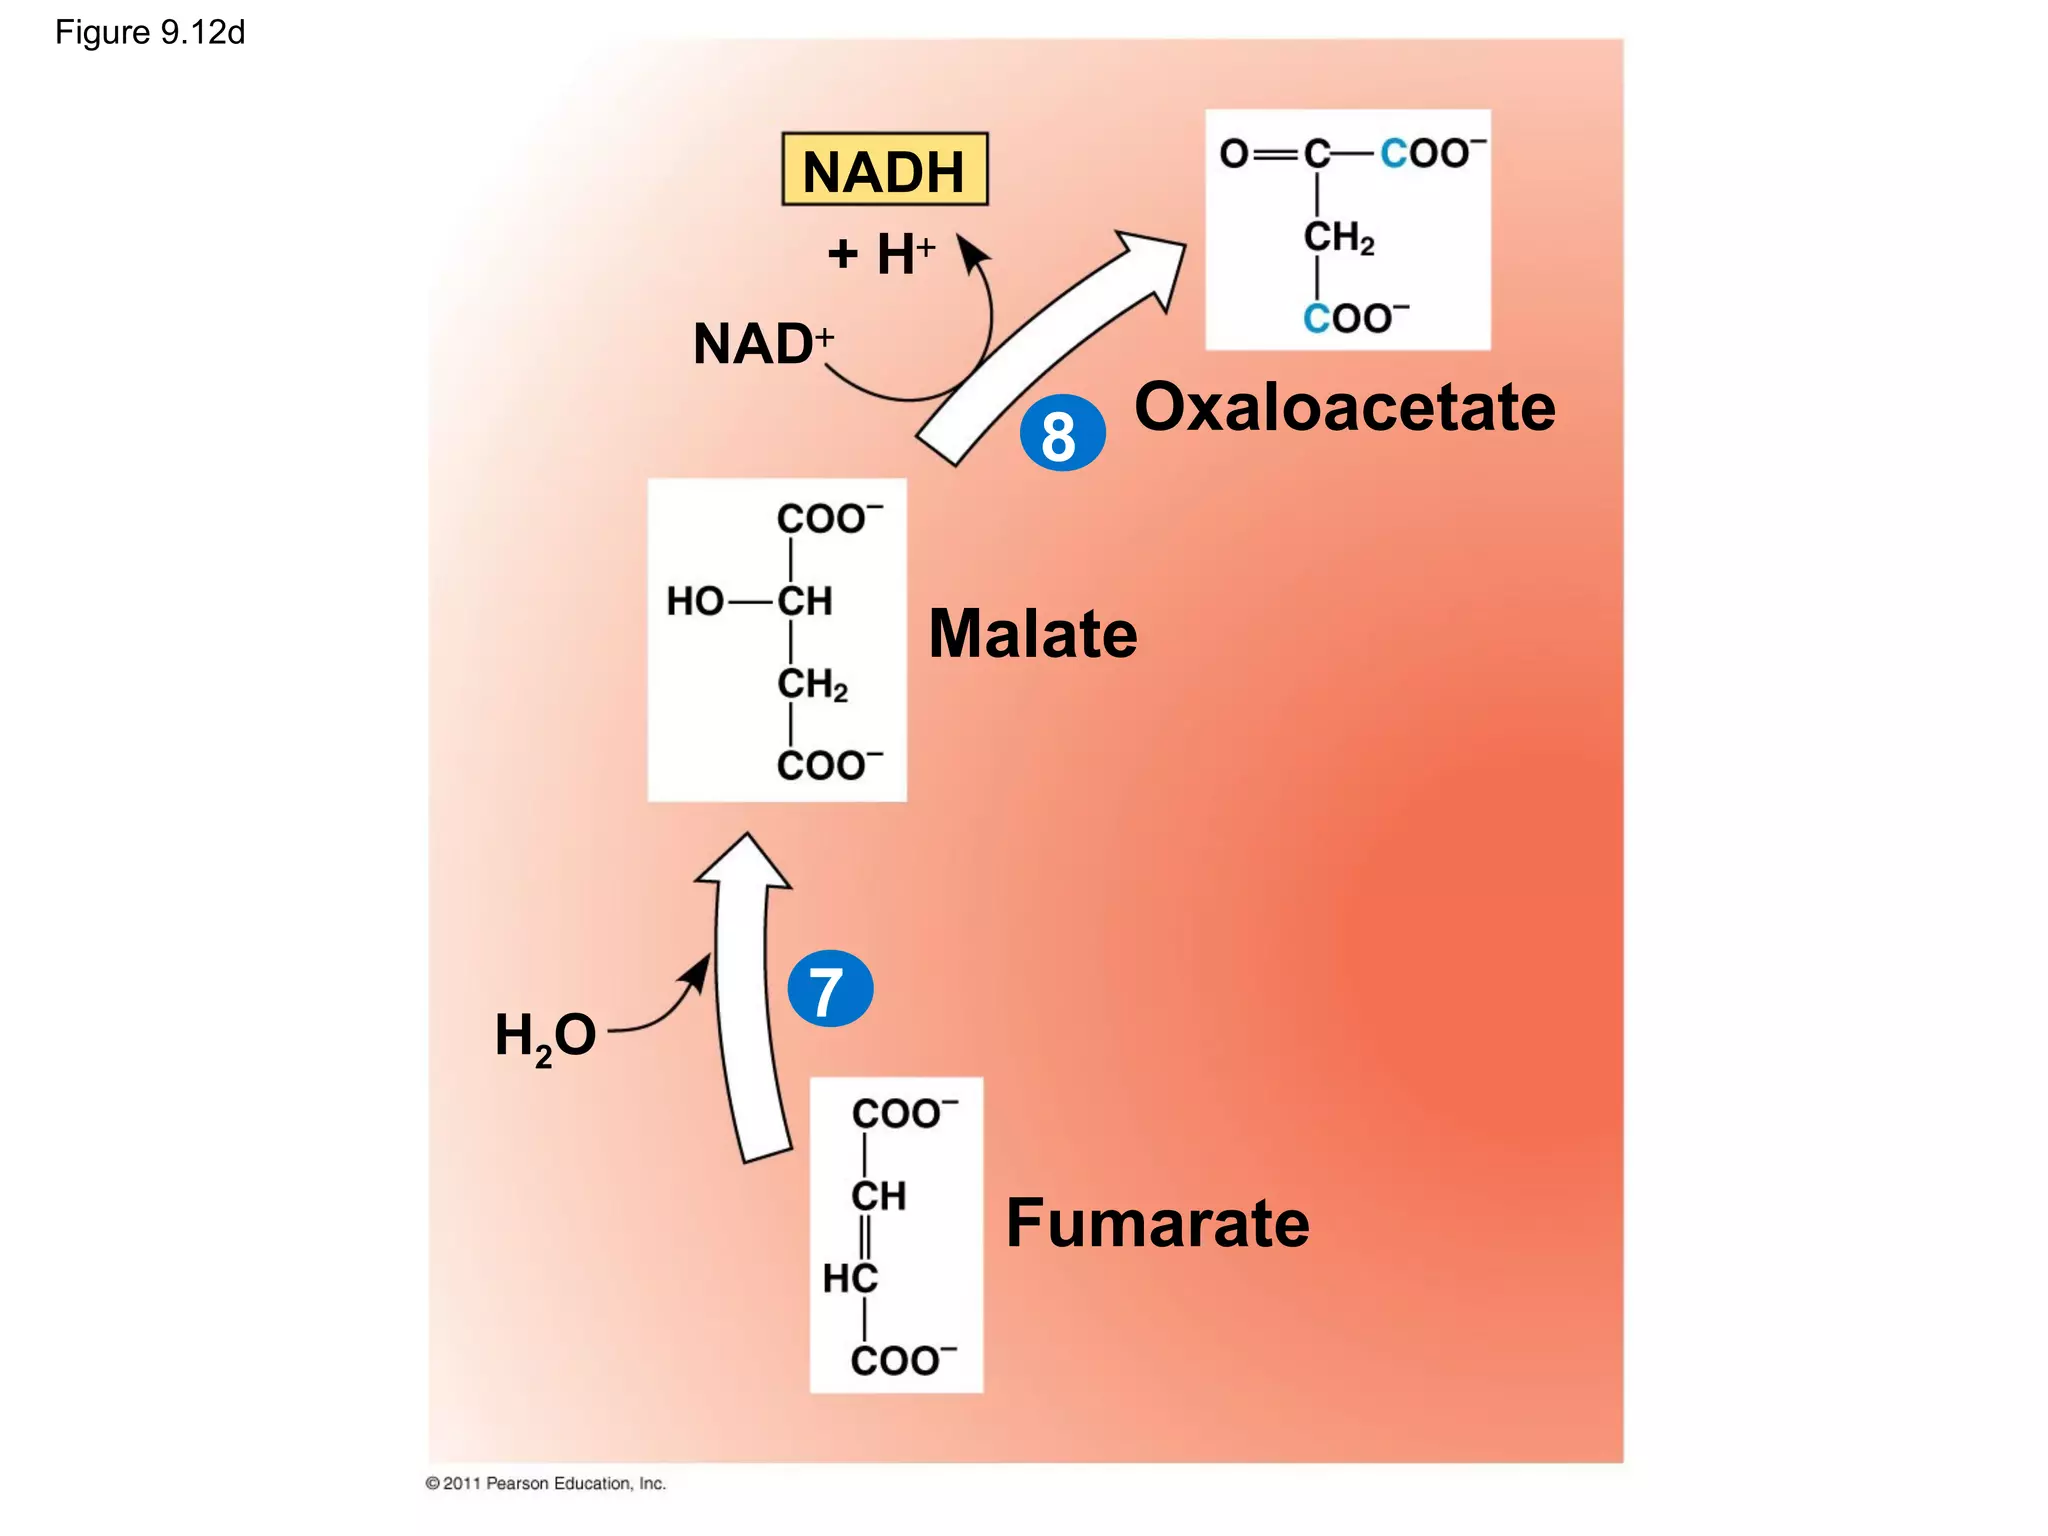
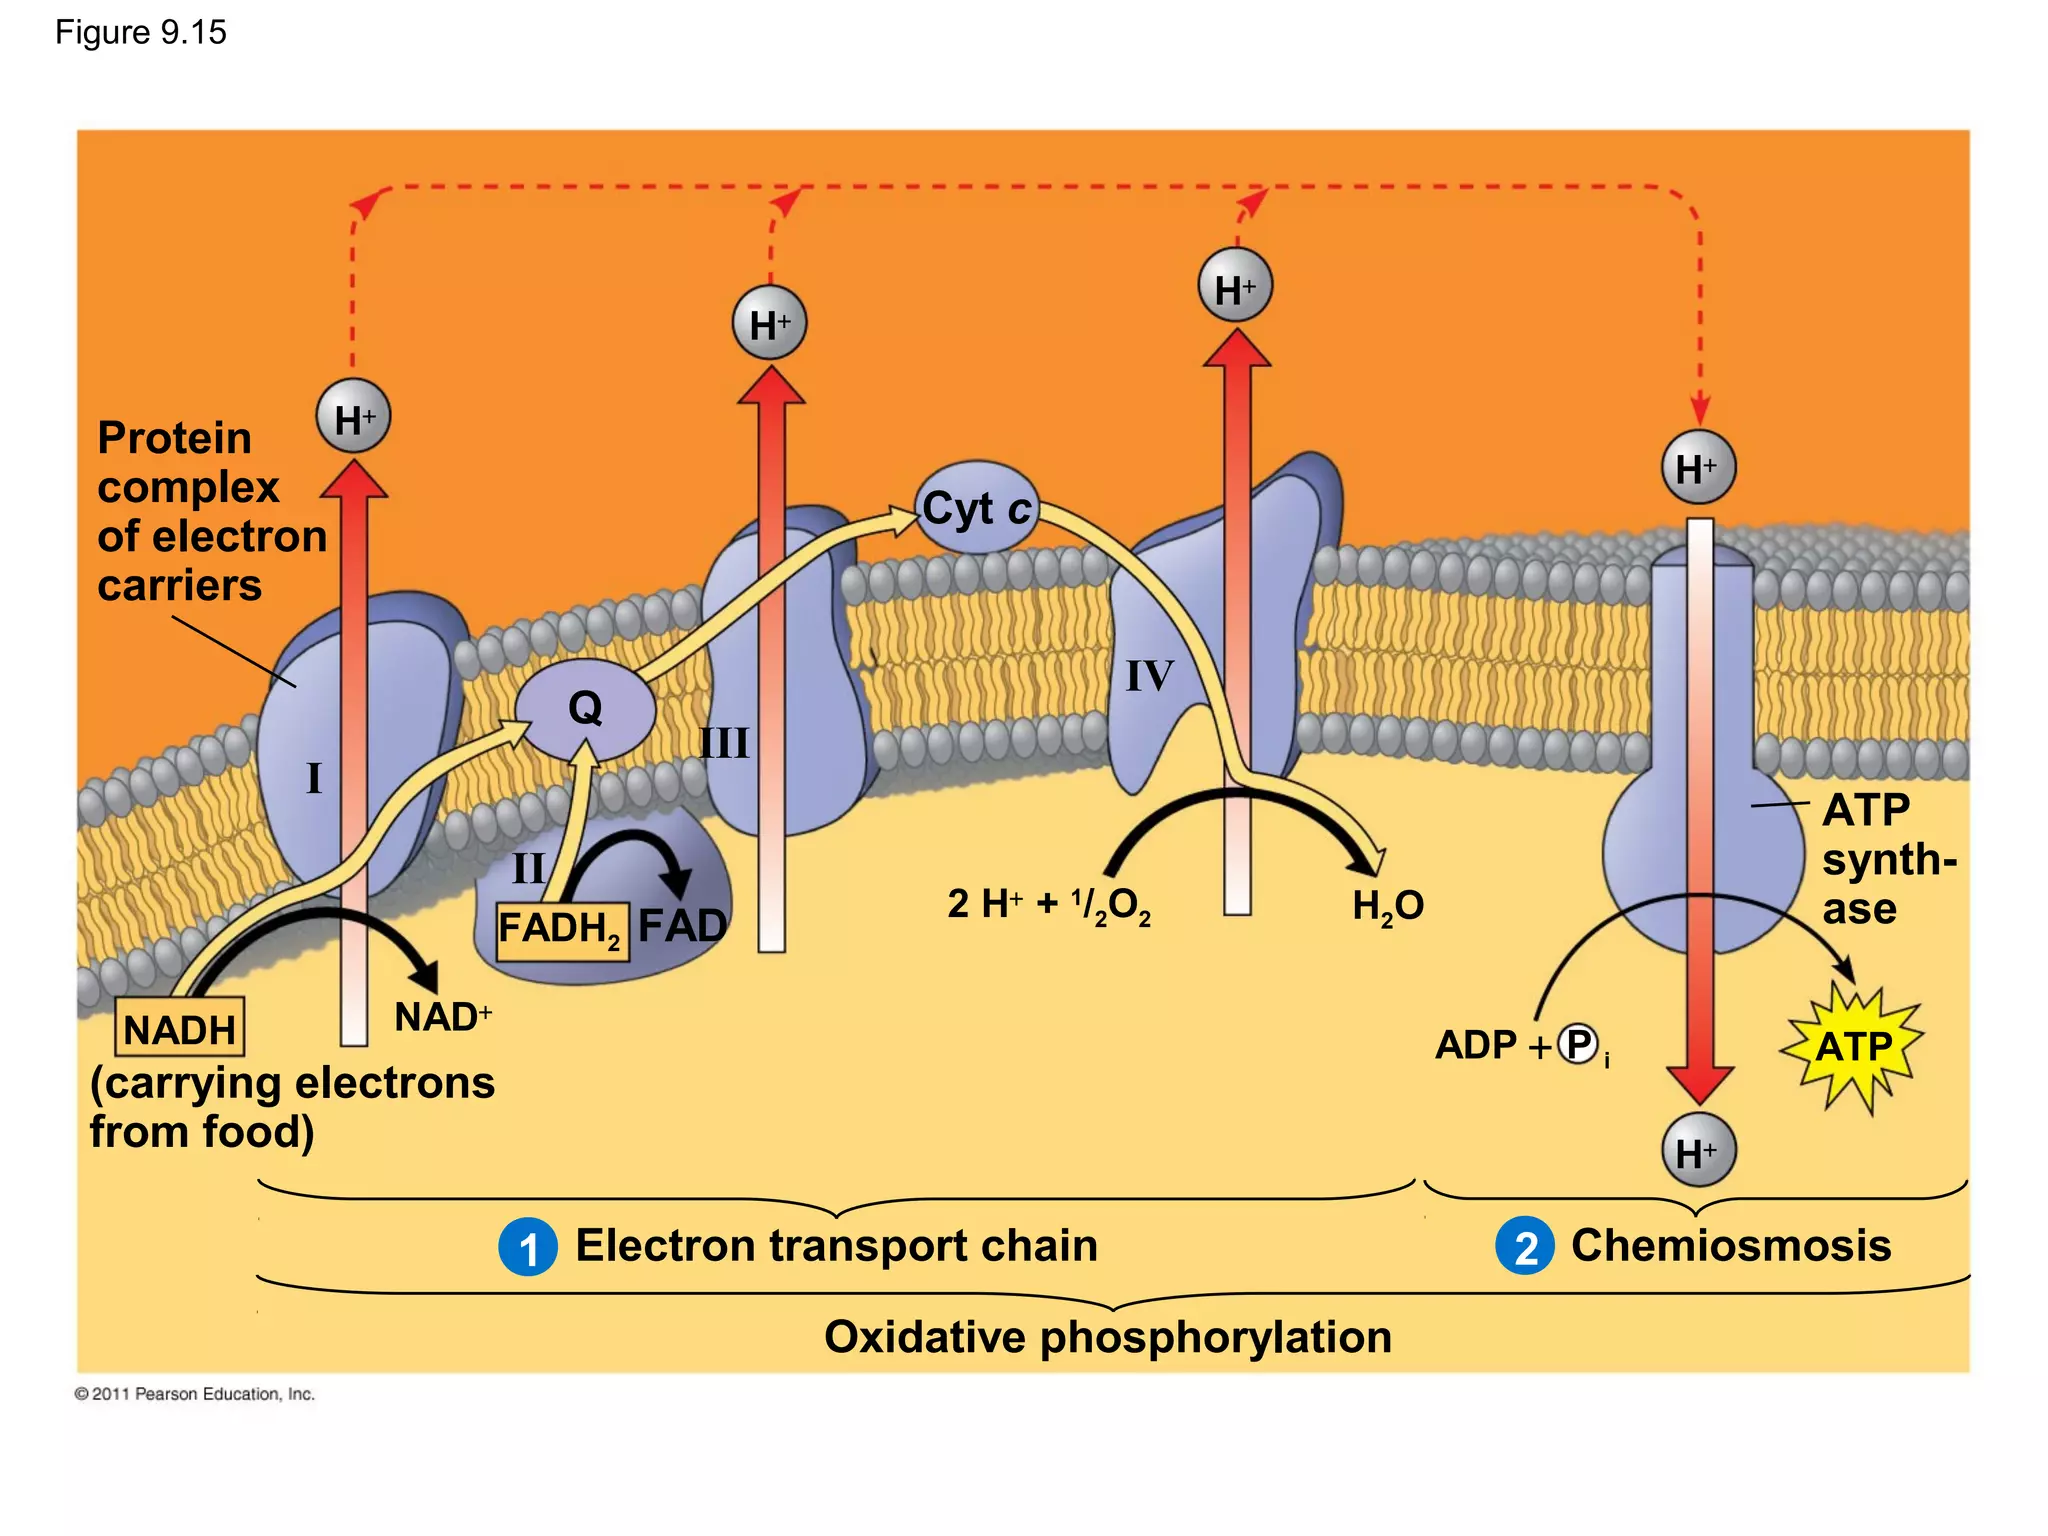
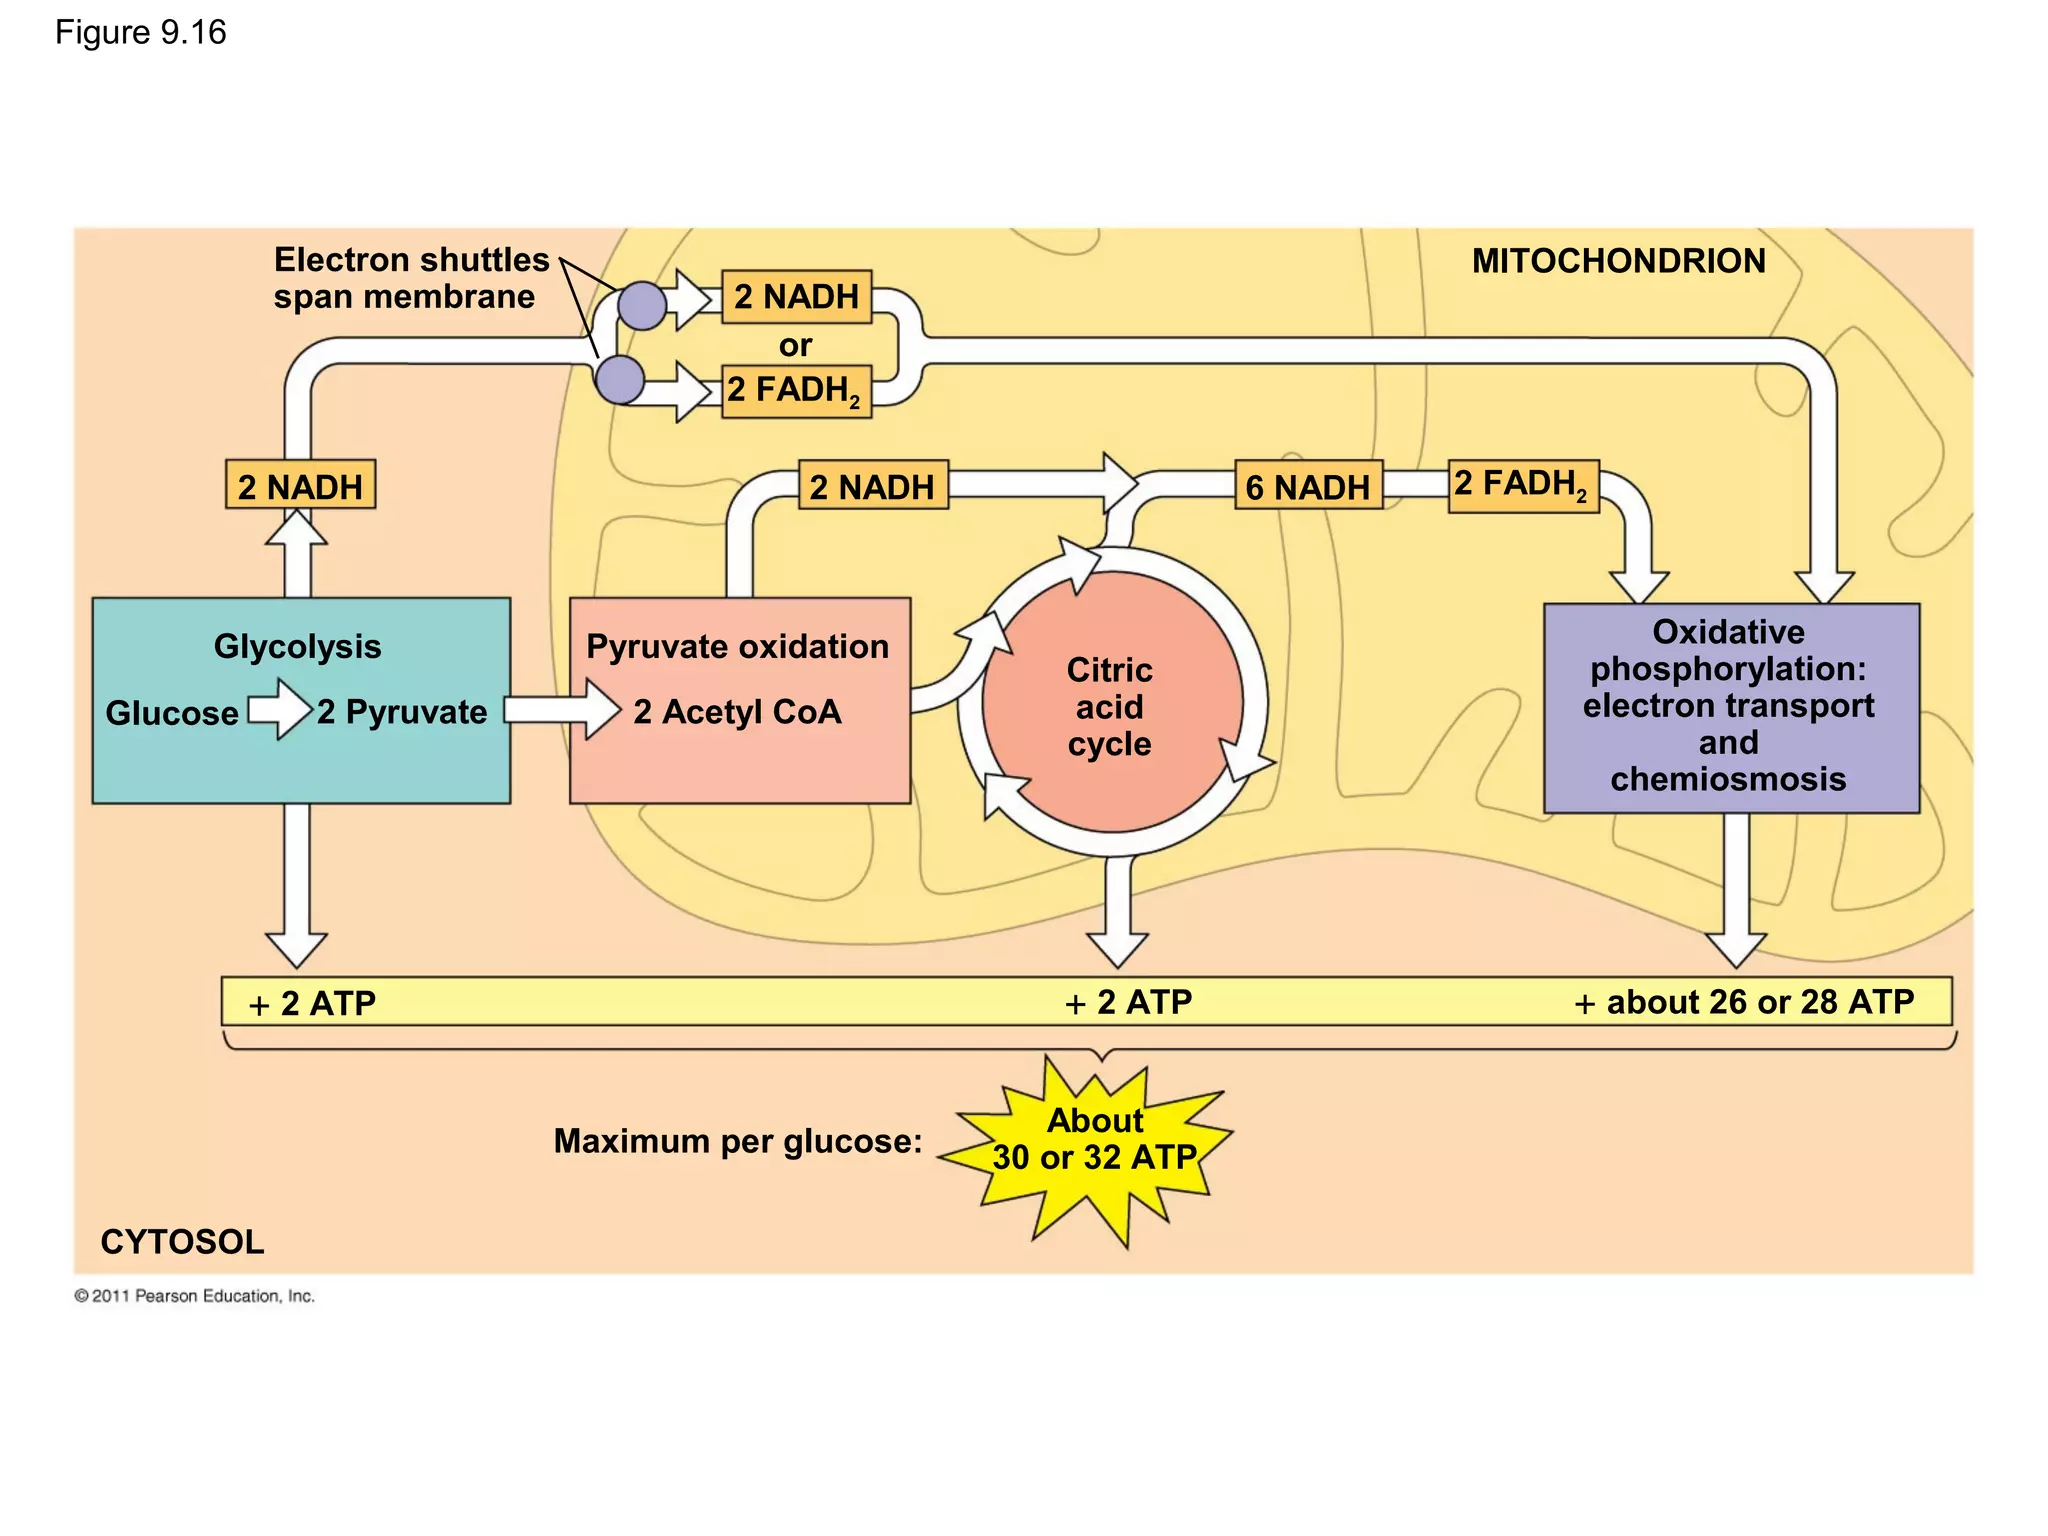
LECTURE PRESENTATIONS
                                    For CAMPBELL BIOLOGY, NINTH EDITION
                Jane B. Reece, Lisa A. Urry, Michael L. Cain, Steven A. Wasserman, Peter V. Minorsky, Robert B. Jackson


Chapter 9

Cellular Respiration and
Fermentation


                                                                                                                    Lectures by
                                                                                                                    Erin Barley
                                                                                                            Kathleen Fitzpatrick

© 2011 Pearson Education, Inc.
Overview: Life Is Work
     • Living cells require energy from outside
       sources
     • Some animals, such as the chimpanzee, obtain
       energy by eating plants, and some animals
       feed on other organisms that eat plants


© 2011 Pearson Education, Inc.
Figure 9.1
• Energy flows into an ecosystem as sunlight
       and leaves as heat
     • Photosynthesis generates O2 and organic
       molecules, which are used in cellular
       respiration
     • Cells use chemical energy stored in organic
       molecules to regenerate ATP, which powers
       work


© 2011 Pearson Education, Inc.
Figure 9.2

                      Light
                      energy

             ECOSYSTEM


                             Photosynthesis
                             in chloroplasts
                CO2 + H2O                           Organic
                                                             + O2
                                                   molecules
                            Cellular respiration
                             in mitochondria


                                          ATP powers
                                   ATP
                                          most cellular work

                         Heat
                         energy
Concept 9.1: Catabolic pathways yield
energy by oxidizing organic fuels
     • Several processes are central to cellular
       respiration and related pathways


© 2011 Pearson Education, Inc.
Catabolic Pathways and Production of ATP
     • The breakdown of organic molecules is
       exergonic
     • Fermentation is a partial degradation of
       sugars that occurs without O2
     • Aerobic respiration consumes organic
       molecules and O2 and yields ATP
     • Anaerobic respiration is similar to aerobic
       respiration but consumes compounds other
       than O2


© 2011 Pearson Education, Inc.
• Cellular respiration includes both aerobic and
       anaerobic respiration but is often used to refer
       to aerobic respiration
     • Although carbohydrates, fats, and proteins are
       all consumed as fuel, it is helpful to trace
       cellular respiration with the sugar glucose
        C6H12O6 + 6 O2 → 6 CO2 + 6 H2O + Energy (ATP
       + heat)


© 2011 Pearson Education, Inc.
Redox Reactions: Oxidation and Reduction
     • The transfer of electrons during chemical
       reactions releases energy stored in organic
       molecules
     • This released energy is ultimately used to
       synthesize ATP


© 2011 Pearson Education, Inc.
The Principle of Redox
     • Chemical reactions that transfer electrons
       between reactants are called oxidation-reduction
       reactions, or redox reactions
     • In oxidation, a substance loses electrons, or is
       oxidized
     • In reduction, a substance gains electrons, or is
       reduced (the amount of positive charge is
       reduced)


© 2011 Pearson Education, Inc.
Figure 9.UN01


                becomes oxidized
                 (loses electron)

                          becomes reduced
                           (gains electron)
Figure 9.UN02


                becomes oxidized

                         becomes reduced
• The electron donor is called the reducing
       agent
     • The electron receptor is called the oxidizing
       agent
     • Some redox reactions do not transfer electrons
       but change the electron sharing in covalent
       bonds
     • An example is the reaction between methane
       and O2


© 2011 Pearson Education, Inc.
Figure 9.3


             Reactants                    Products
              becomes oxidized

                                              Energy

                                  becomes reduced


       Methane       Oxygen      Carbon dioxide      Water
      (reducing     (oxidizing
        agent)        agent)
Oxidation of Organic Fuel Molecules During
Cellular Respiration
     • During cellular respiration, the fuel (such as
       glucose) is oxidized, and O2 is reduced


© 2011 Pearson Education, Inc.
Figure 9.UN03


                becomes oxidized


                             becomes reduced
Stepwise Energy Harvest via NAD+ and the
Electron Transport Chain
     • In cellular respiration, glucose and other organic
       molecules are broken down in a series of steps
     • Electrons from organic compounds are usually
       first transferred to NAD+, a coenzyme
     • As an electron acceptor, NAD+ functions as an
       oxidizing agent during cellular respiration
     • Each NADH (the reduced form of NAD+)
       represents stored energy that is tapped to
       synthesize ATP
© 2011 Pearson Education, Inc.
Figure 9.4


             NAD+                                                        NADH
                                                     Dehydrogenase
                                                    Reduction of NAD+

                                      (from food)   Oxidation of NADH
                    Nicotinamide                                        Nicotinamide
                    (oxidized form)                                     (reduced form)
Figure 9.UN04


                Dehydrogenase
• NADH passes the electrons to the electron
       transport chain
     • Unlike an uncontrolled reaction, the electron
       transport chain passes electrons in a series of
       steps instead of one explosive reaction
     • O2 pulls electrons down the chain in an energy-
       yielding tumble
     • The energy yielded is used to regenerate ATP


© 2011 Pearson Education, Inc.
Figure 9.5


                 H2 + 1/2 O2                                         2H                            +           /2 O2
                                                                                                               1


                                                              (from food via NADH)
                                                                                 Controlled
                                                                                 release of
                                                                 2H + 2e
                                                                    +      −
                                                                                 energy for
                                                                                synthesis of
                                                                                    ATP


                                                                      Elec chain
                                                                                                         ATP


                                             Free energy, G
Free energy, G


                                                                          tron
                              Explosive                                                                ATP
                              release of


                                                                               tran
                            heat and light                                                              ATP
                                energy


                                                                                    spor
                                                                                            2 e−


                                                                                        t
                                                                                                               1
                                                                                                                   /2 O2
                                                                                            2H +


                    H2O                                                                                H2O

                 (a) Uncontrolled reaction                    (b) Cellular respiration
The Stages of Cellular Respiration:
A Preview
     • Harvesting of energy from glucose has three
       stages
         – Glycolysis (breaks down glucose into two
           molecules of pyruvate)
         – The citric acid cycle (completes the
           breakdown of glucose)
         – Oxidative phosphorylation (accounts for
           most of the ATP synthesis)


© 2011 Pearson Education, Inc.
Figure 9.UN05


 1. Glycolysis (color-coded teal throughout the chapter)
 2. Pyruvate oxidation and the citric acid cycle
    (color-coded salmon)
 3. Oxidative phosphorylation: electron transport and
    chemiosmosis (color-coded violet)
Figure 9.6-1


               Electrons
                carried
               via NADH


               Glycolysis

    Glucose            Pyruvate


   CYTOSOL                        MITOCHONDRION


                 ATP

         Substrate-level
        phosphorylation
Figure 9.6-2


               Electrons                                Electrons carried
                carried                                  via NADH and
               via NADH                                      FADH2


                                   Pyruvate
               Glycolysis                           Citric
                                   oxidation
                                                    acid
    Glucose            Pyruvate   Acetyl CoA        cycle


   CYTOSOL                            MITOCHONDRION


                 ATP                                ATP

         Substrate-level                        Substrate-level
        phosphorylation                        phosphorylation
Figure 9.6-3


               Electrons                                Electrons carried
                carried                                  via NADH and
               via NADH                                      FADH2


                                                                         Oxidative
                                   Pyruvate
               Glycolysis                           Citric           phosphorylation:
                                   oxidation
                                                    acid             electron transport
    Glucose            Pyruvate   Acetyl CoA        cycle                   and
                                                                       chemiosmosis


   CYTOSOL                            MITOCHONDRION


                 ATP                                ATP                          ATP

         Substrate-level                        Substrate-level               Oxidative
        phosphorylation                        phosphorylation              phosphorylation
• The process that generates most of the ATP is
       called oxidative phosphorylation because it is
       powered by redox reactions


© 2011 Pearson Education, Inc.
• Oxidative phosphorylation accounts for almost
       90% of the ATP generated by cellular
       respiration
     • A smaller amount of ATP is formed in glycolysis
       and the citric acid cycle by substrate-level
       phosphorylation
     • For each molecule of glucose degraded to CO2
       and water by respiration, the cell makes up to
       32 molecules of ATP


© 2011 Pearson Education, Inc.
Figure 9.7


             Enzyme               Enzyme

                      ADP
             P
      Substrate                            ATP
                            Product
Concept 9.2: Glycolysis harvests chemical
energy by oxidizing glucose to pyruvate
     • Glycolysis (“splitting of sugar”) breaks down
       glucose into two molecules of pyruvate
     • Glycolysis occurs in the cytoplasm and has two
       major phases
                – Energy investment phase
                – Energy payoff phase
     • Glycolysis occurs whether or not O2 is present


© 2011 Pearson Education, Inc.
Figure 9.8

             Energy Investment Phase
                                 Glucose


                           2 ADP + 2 P          2 ATP used


             Energy Payoff Phase

                           4 ADP + 4 P          4 ATP formed


                   2 NAD+ + 4 e− + 4 H+         2 NADH + 2 H+


                                               2 Pyruvate + 2 H2O

             Net
                                 Glucose    2 Pyruvate + 2 H2O
             4 ATP formed − 2 ATP used      2 ATP
                     2 NAD+ + 4 e− + 4 H+   2 NADH + 2 H+
Figure 9.9-1


                                          Glycolysis: Energy Investment Phase


               ATP
     Glucose             Glucose 6-phosphate
                     ADP


               Hexokinase

                     1
Figure 9.9-2


                                          Glycolysis: Energy Investment Phase


               ATP
     Glucose             Glucose 6-phosphate       Fructose 6-phosphate
                     ADP


               Hexokinase                Phosphogluco-
                                           isomerase
                     1
                                               2
Figure 9.9-3


                                          Glycolysis: Energy Investment Phase


               ATP                                                        ATP
     Glucose             Glucose 6-phosphate       Fructose 6-phosphate                  Fructose 1,6-bisphosphate
                     ADP                                                           ADP


               Hexokinase                Phosphogluco-                      Phospho-
                                           isomerase                      fructokinase
                     1
                                               2                               3
Figure 9.9-4


                                          Glycolysis: Energy Investment Phase


               ATP                                                        ATP
     Glucose             Glucose 6-phosphate       Fructose 6-phosphate                  Fructose 1,6-bisphosphate
                     ADP                                                           ADP


               Hexokinase                Phosphogluco-                      Phospho-
                                           isomerase                      fructokinase
                     1
                                               2                               3
                                                                                                       Aldolase    4


                                                                            Dihydroxyacetone                      Glyceraldehyde
                                                                               phosphate                           3-phosphate


                                                                                                                               To
                                                                                                 Isomerase   5                 step 6
Figure 9.9-5


                                            Glycolysis: Energy Payoff Phase


            2 NADH
   2 NAD+        + 2 H+


     Triose
   phosphate     2Pi
 dehydrogenase
                          1,3-Bisphospho-
       6                      glycerate
Figure 9.9-6


                                                     Glycolysis: Energy Payoff Phase

                                                   2 ATP
            2 NADH
   2 NAD+        + 2 H+                 2 ADP               2


     Triose                                   Phospho-
   phosphate     2Pi                        glycerokinase
 dehydrogenase
                          1,3-Bisphospho-        7              3-Phospho-
       6                      glycerate                          glycerate
Figure 9.9-7


                                                     Glycolysis: Energy Payoff Phase

                                                   2 ATP
            2 NADH
   2 NAD+        + 2 H+                 2 ADP               2                           2


     Triose                                   Phospho-                          Phospho-
   phosphate                                                                 glyceromutase
                 2Pi                        glycerokinase
 dehydrogenase
                          1,3-Bisphospho-        7              3-Phospho-        8          2-Phospho-
       6                      glycerate                          glycerate                    glycerate
Figure 9.9-8


                                                     Glycolysis: Energy Payoff Phase

                                                   2 ATP
            2 NADH                                                                                          2 H2O
   2 NAD+        + 2 H+                 2 ADP               2                           2                           2


     Triose                                   Phospho-                          Phospho-                  Enolase
   phosphate                                                                 glyceromutase
                 2Pi                        glycerokinase
 dehydrogenase                                                                                              9
                          1,3-Bisphospho-        7              3-Phospho-        8          2-Phospho-             Phosphoenol-
       6                      glycerate                          glycerate                    glycerate             pyruvate (PEP)
Figure 9.9-9


                                                     Glycolysis: Energy Payoff Phase

                                                   2 ATP                                                                              2 ATP
            2 NADH                                                                                          2 H2O
                                                                                                                              2 ADP
   2 NAD+        + 2 H+                 2 ADP               2                           2                           2


     Triose                                   Phospho-                          Phospho-                  Enolase                Pyruvate
   phosphate                                                                 glyceromutase                                        kinase
                 2Pi                        glycerokinase
 dehydrogenase                                                                                              9
                          1,3-Bisphospho-        7              3-Phospho-        8          2-Phospho-             Phosphoenol-      10    Pyruvate
       6                      glycerate                          glycerate                    glycerate             pyruvate (PEP)
Figure 9.9a


                    Glycolysis: Energy Investment Phase


                  ATP
        Glucose            Glucose 6-phosphate       Fructose 6-phosphate
                        ADP


                  Hexokinase               Phosphogluco-
                                             isomerase
                        1
                                                 2
Figure 9.9b


                    Glycolysis: Energy Investment Phase


                        ATP
 Fructose 6-phosphate               Fructose 1,6-bisphosphate
                              ADP


                      Phospho-
                    fructokinase
                                                 Aldolase 4
                          3


                        Dihydroxyacetone                 Glyceraldehyde
                           phosphate                      3-phosphate


                                                                        To
                                           Isomerase 5
                                                                      step 6
Figure 9.9c


                         Glycolysis: Energy Payoff Phase


                                                        2 ATP
                  2 NADH
    2 NAD+         + 2 H+                     2 ADP           2
                            2

      Triose                                        Phospho-
    phosphate      2Pi                            glycerokinase
  dehydrogenase
                                1,3-Bisphospho-        7          3-Phospho-
              6                     glycerate                      glycerate
Figure 9.9d


                            Glycolysis: Energy Payoff Phase

                                                                            2 ATP
                                                  2 H2O
                                                                    2 ADP
  2                            2                          2                       2


                      Phospho-                  Enolase                Pyruvate
                   glyceromutase                                        kinase
                                                  9
      3-Phospho-        8          2-Phospho-             Phosphoenol-      10    Pyruvate
       glycerate                    glycerate             pyruvate (PEP)
Concept 9.3: After pyruvate is oxidized, the
citric acid cycle completes the energy-
yielding oxidation of organic molecules
     • In the presence of O2, pyruvate enters the
       mitochondrion (in eukaryotic cells) where the
       oxidation of glucose is completed


© 2011 Pearson Education, Inc.
Oxidation of Pyruvate to Acetyl CoA
     • Before the citric acid cycle can begin, pyruvate
       must be converted to acetyl Coenzyme A
       (acetyl CoA), which links glycolysis to the citric
       acid cycle
     • This step is carried out by a multienzyme
       complex that catalyses three reactions


© 2011 Pearson Education, Inc.
Figure 9.10


                                        MITOCHONDRION
              CYTOSOL       CO2    Coenzyme A

                        1                   3


                                   2

                            NAD+       NADH + H+   Acetyl CoA
   Pyruvate

   Transport protein
The Citric Acid Cycle
     • The citric acid cycle, also called the Krebs
       cycle, completes the break down of pyrvate to
       CO2
     • The cycle oxidizes organic fuel derived from
       pyruvate, generating 1 ATP, 3 NADH, and 1
       FADH2 per turn


© 2011 Pearson Education, Inc.
Figure 9.11
              Pyruvate

                                                 CO2
                          NAD   +

                                                 CoA
                         NADH
                         + H+       Acetyl CoA
                                           CoA


                                                  CoA


                                         Citric
                                         acid
                                         cycle           2 CO2

                 FADH2                                   3 NAD+

                    FAD                                 3 NADH
                                                         + 3 H+
                                            ADP + P i

                                      ATP
• The citric acid cycle has eight steps, each
       catalyzed by a specific enzyme
     • The acetyl group of acetyl CoA joins the cycle
       by combining with oxaloacetate, forming citrate
     • The next seven steps decompose the citrate
       back to oxaloacetate, making the process a
       cycle
     • The NADH and FADH2 produced by the cycle
       relay electrons extracted from food to the
       electron transport chain
© 2011 Pearson Education, Inc.
Figure 9.12-1


                     Acetyl CoA
                               CoA-SH


                           1

                Oxaloacetate


                                  Citrate


                        Citric
                        acid
                        cycle
Figure 9.12-2


                     Acetyl CoA
                               CoA-SH


                           1                    H2O


                Oxaloacetate
                                            2


                                  Citrate
                                                      Isocitrate

                        Citric
                        acid
                        cycle
Figure 9.12-3


                     Acetyl CoA
                               CoA-SH


                           1                    H2O


                Oxaloacetate
                                            2


                                  Citrate
                                                      Isocitrate
                                                             NAD+
                        Citric                        3
                                                               NADH
                        acid                                       + H+

                        cycle                                CO2


                                                           α-Ketoglutarate
Figure 9.12-4


                     Acetyl CoA
                               CoA-SH


                           1                            H2O


                Oxaloacetate
                                                2


                                  Citrate
                                                               Isocitrate
                                                                        NAD+
                        Citric                                3
                                                                         NADH
                        acid                                                + H+

                        cycle                                           CO2


                                            CoA-SH

                                                                    α-Ketoglutarate
                                                    4


                                                                  CO2
                                                     NAD+

                                                        NADH
                                Succinyl                + H+

                                  CoA
Figure 9.12-5


                        Acetyl CoA
                                     CoA-SH


                                1                               H2O


                   Oxaloacetate
                                                        2


                                          Citrate
                                                                       Isocitrate
                                                                                NAD+
                              Citric                                  3
                                                                                 NADH
                              acid                                                  + H+

                              cycle                                             CO2


                                                    CoA-SH

                                                                            α-Ketoglutarate
                                                            4
                            CoA-SH


                            5
                                                                          CO2
                                                             NAD+


                Succinate            Pi                         NADH
                        GTP GDP       Succinyl                  + H+

                                        CoA
                      ADP

                        ATP
Figure 9.12-6


                                       Acetyl CoA
                                                   CoA-SH


                                               1                              H2O


                                  Oxaloacetate
                                                                      2


                                                        Citrate
                                                                                     Isocitrate
                                                                                              NAD+
                                             Citric                                 3
                                                                                               NADH
                                             acid                                                 + H+

                                             cycle                                            CO2


                          Fumarate                                CoA-SH

                                                                                          α-Ketoglutarate
                              6                                           4
                                          CoA-SH


                FADH2                     5
                                                                                        CO2
                                                                           NAD+
                        FAD

                          Succinate                Pi                         NADH
                                      GTP GDP       Succinyl                  + H+

                                                      CoA
                                    ADP

                                       ATP
Figure 9.12-7


                                              Acetyl CoA
                                                          CoA-SH


                                                      1                              H2O


                                         Oxaloacetate
                                                                             2


                               Malate                          Citrate
                                                                                            Isocitrate
                                                                                                     NAD+
                                                    Citric                                 3
                                                                                                      NADH
                           7                        acid                                                 + H+
                H2 O
                                                    cycle                                            CO2


                                 Fumarate                                CoA-SH

                                                                                                 α-Ketoglutarate
                                     6                                           4
                                                 CoA-SH


                       FADH2                     5
                                                                                               CO2
                                                                                  NAD+
                               FAD

                                 Succinate                Pi                         NADH
                                             GTP GDP       Succinyl                  + H+

                                                             CoA
                                           ADP

                                              ATP
Figure 9.12-8


                                                 Acetyl CoA
                                                             CoA-SH


                           NADH
                               + H+                      1                              H2O

                        NAD+
                                        8   Oxaloacetate
                                                                                2


                                  Malate                          Citrate
                                                                                               Isocitrate
                                                                                                        NAD+
                                                       Citric                                 3
                                                                                                         NADH
                           7                           acid                                                 + H+
                H2 O
                                                       cycle                                            CO2


                                      Fumarate                              CoA-SH

                                                                                                    α-Ketoglutarate
                                        6                                           4
                                                    CoA-SH


                       FADH2                        5
                                                                                                  CO2
                                                                                     NAD+
                                  FAD

                                      Succinate              Pi                         NADH
                                                 GTP GDP      Succinyl                  + H+

                                                                CoA
                                              ADP

                                                 ATP
Figure 9.12a


                Acetyl CoA
                              CoA-SH


                          1                     H2O


           Oxaloacetate
                                            2


                                  Citrate
                                                      Isocitrate
Figure 9.12b


                                           Isocitrate
                                                    NAD+
                                                     NADH
                                       3              + H+

                                                    CO2


                          CoA-SH

                                                α-Ketoglutarate
                               4

                                              CO2
                                   NAD+

                                   NADH
               Succinyl             + H+
                 CoA
Figure 9.12c


                         Fumarate


                             6         CoA-SH


               FADH2                   5

                       FAD

                         Succinate              Pi
                                  GTP GDP        Succinyl
                                                   CoA
                                 ADP

                                    ATP
Figure 9.12d


                        NADH
                         + H+
                     NAD+
                                8 Oxaloacetate

                            Malate


                        7
               H2O


                                Fumarate
Concept 9.4: During oxidative
phosphorylation, chemiosmosis couples
electron transport to ATP synthesis
     • Following glycolysis and the citric acid cycle,
       NADH and FADH2 account for most of the
       energy extracted from food
     • These two electron carriers donate electrons to
       the electron transport chain, which powers ATP
       synthesis via oxidative phosphorylation


© 2011 Pearson Education, Inc.
The Pathway of Electron Transport
     • The electron transport chain is in the inner
       membrane (cristae) of the mitochondrion
     • Most of the chain’s components are proteins,
       which exist in multiprotein complexes
     • The carriers alternate reduced and oxidized
       states as they accept and donate electrons
     • Electrons drop in free energy as they go down
       the chain and are finally passed to O2, forming
       H2O


© 2011 Pearson Education, Inc.
Figure 9.13
                                                                 NADH
                                                          50
                                                               2 e−
                                                                      NAD+
                                                                                     FADH2

                                                                                 2 e−    FAD                   Multiprotein


              Free energy (G) relative to O2 (kcal/mol)
                                                          40   FMN
                                                                             I                                 complexes
                                                                                 Fe• S   II
                                                                       Fe• S
                                                                                 Q
                                                                                                     III
                                                                                     Cyt b
                                                                                             Fe• S
                                                          30
                                                                                                     Cyt c1
                                                                                                                                 IV
                                                                                                              Cyt c
                                                                                                                      Cyt a
                                                                                                                              Cyt a3
                                                          20


                                                                                                                              2 e−
                                                          10
                                                                                                       (originally from
                                                                                                       NADH or FADH2)


                                                           0                                                     2 H+ + 1/2 O2


                                                                                                                                 H2O
• Electrons are transferred from NADH or FADH2
       to the electron transport chain
     • Electrons are passed through a number of
       proteins including cytochromes (each with an
       iron atom) to O2
     • The electron transport chain generates no ATP
       directly
     • It breaks the large free-energy drop from food
       to O2 into smaller steps that release energy in
       manageable amounts

© 2011 Pearson Education, Inc.
Chemiosmosis: The Energy-Coupling
Mechanism
     • Electron transfer in the electron transport chain
       causes proteins to pump H+ from the
       mitochondrial matrix to the intermembrane space
     • H+ then moves back across the membrane,
       passing through the proton, ATP synthase
     • ATP synthase uses the exergonic flow of H+ to
       drive phosphorylation of ATP
     • This is an example of chemiosmosis, the use of
       energy in a H+ gradient to drive cellular work

© 2011 Pearson Education, Inc.
Figure 9.14
               INTERMEMBRANE SPACE


                              H+
                                      Stator
                     Rotor


               Internal
               rod

              Catalytic
              knob


                 ADP
                  +
                  Pi               ATP

               MITOCHONDRIAL MATRIX
Figure 9.15


                                                                     H+
                                         H   +


  Protein     H   +


  complex                                                                                   H+
                                                     Cyt c
  of electron
  carriers
                                                                IV
                                  Q
                                      III
              I
                                                                                                 ATP
                             II                                                                  synth-
                                                      2 H+ + 1/2O2        H2O                    ase
                             FADH2 FAD

    NADH              NAD+
                                                                                ADP + P i        ATP
  (carrying electrons
  from food)                                                                                H+

                             1 Electron transport chain                             2 Chemiosmosis
                                                 Oxidative phosphorylation
• The energy stored in a H+ gradient across a
       membrane couples the redox reactions of the
       electron transport chain to ATP synthesis
     • The H+ gradient is referred to as a proton-
       motive force, emphasizing its capacity to do
       work


© 2011 Pearson Education, Inc.
An Accounting of ATP Production by
Cellular Respiration
     • During cellular respiration, most energy flows
       in this sequence:
       glucose → NADH → electron transport chain
       → proton-motive force → ATP
     • About 34% of the energy in a glucose molecule
       is transferred to ATP during cellular respiration,
       making about 32 ATP
     • There are several reasons why the number of
       ATP is not known exactly

© 2011 Pearson Education, Inc.
Figure 9.16


               Electron shuttles                                                  MITOCHONDRION
               span membrane                2 NADH
                                               or
                                            2 FADH2

              2 NADH                             2 NADH                  6 NADH   2 FADH2


          Glycolysis                Pyruvate oxidation                                      Oxidative
                                                              Citric                    phosphorylation:
   Glucose       2 Pyruvate            2 Acetyl CoA           acid                      electron transport
                                                              cycle                            and
                                                                                          chemiosmosis


              + 2 ATP                                         + 2 ATP                   + about 26 or 28 ATP


                                                             About
                                   Maximum per glucose:   30 or 32 ATP

  CYTOSOL
Concept 9.5: Fermentation and anaerobic
respiration enable cells to produce ATP
without the use of oxygen
     • Most cellular respiration requires O2 to produce
       ATP
     • Without O2, the electron transport chain will
       cease to operate
     • In that case, glycolysis couples with
       fermentation or anaerobic respiration to
       produce ATP


© 2011 Pearson Education, Inc.
• Anaerobic respiration uses an electron
       transport chain with a final electron acceptor
       other than O2, for example sulfate
     • Fermentation uses substrate-level
       phosphorylation instead of an electron
       transport chain to generate ATP


© 2011 Pearson Education, Inc.
Types of Fermentation
     • Fermentation consists of glycolysis plus
       reactions that regenerate NAD+, which can be
       reused by glycolysis
     • Two common types are alcohol fermentation
       and lactic acid fermentation


© 2011 Pearson Education, Inc.
• In alcohol fermentation, pyruvate is converted
       to ethanol in two steps, with the first releasing
       CO2
     • Alcohol fermentation by yeast is used in
       brewing, winemaking, and baking


© 2011 Pearson Education, Inc.
Figure 9.17


              2 ADP + 2 P        2 ATP                                  2 ADP + 2 P         2 ATP
                            i                                                         i


      Glucose          Glycolysis                               Glucose          Glycolysis

                                             2 Pyruvate

                 2 NAD +            2 NADH          2 CO2                  2 NAD +            2 NADH
                                + 2 H+                                                     + 2 H+
                                                                                                       2 Pyruvate


     2 Ethanol                           2 Acetaldehyde        2 Lactate

  (a) Alcohol fermentation                                  (b) Lactic acid fermentation
Figure 9.17a


                           2 ADP + 2 P i         2 ATP


                Glucose             Glycolysis


                                                             2 Pyruvate

                             2 NAD +           2 NADH               2 CO2
                                             + 2 H+


               2 Ethanol                                 2 Acetaldehyde

       (a) Alcohol fermentation
• In lactic acid fermentation, pyruvate is reduced
       to NADH, forming lactate as an end product,
       with no release of CO2
     • Lactic acid fermentation by some fungi and
       bacteria is used to make cheese and yogurt
     • Human muscle cells use lactic acid
       fermentation to generate ATP when O2 is
       scarce


© 2011 Pearson Education, Inc.
Figure 9.17b


                           2 ADP + 2 P i         2 ATP


                Glucose             Glycolysis


                             2 NAD +          2 NADH
                                            + 2 H+
                                                         2 Pyruvate


               2 Lactate

          (b) Lactic acid fermentation
Comparing Fermentation with Anaerobic
and Aerobic Respiration
     • All use glycolysis (net ATP =2) to oxidize glucose
       and harvest chemical energy of food
     • In all three, NAD+ is the oxidizing agent that accepts
       electrons during glycolysis
     • The processes have different final electron
       acceptors: an organic molecule (such as pyruvate
       or acetaldehyde) in fermentation and O2 in cellular
       respiration
     • Cellular respiration produces 32 ATP per glucose
       molecule; fermentation produces 2 ATP per
       glucose molecule
© 2011 Pearson Education, Inc.
• Obligate anaerobes carry out fermentation or
       anaerobic respiration and cannot survive in the
       presence of O2
     • Yeast and many bacteria are facultative
       anaerobes, meaning that they can survive
       using either fermentation or cellular respiration
     • In a facultative anaerobe, pyruvate is a fork in
       the metabolic road that leads to two alternative
       catabolic routes


© 2011 Pearson Education, Inc.

cellular respiration and fermentation

  • 1.
    LECTURE PRESENTATIONS For CAMPBELL BIOLOGY, NINTH EDITION Jane B. Reece, Lisa A. Urry, Michael L. Cain, Steven A. Wasserman, Peter V. Minorsky, Robert B. Jackson Chapter 9 Cellular Respiration and Fermentation Lectures by Erin Barley Kathleen Fitzpatrick © 2011 Pearson Education, Inc.
  • 2.
    Overview: Life IsWork • Living cells require energy from outside sources • Some animals, such as the chimpanzee, obtain energy by eating plants, and some animals feed on other organisms that eat plants © 2011 Pearson Education, Inc.
  • 3.
  • 4.
    • Energy flowsinto an ecosystem as sunlight and leaves as heat • Photosynthesis generates O2 and organic molecules, which are used in cellular respiration • Cells use chemical energy stored in organic molecules to regenerate ATP, which powers work © 2011 Pearson Education, Inc.
  • 5.
    Figure 9.2 Light energy ECOSYSTEM Photosynthesis in chloroplasts CO2 + H2O Organic + O2 molecules Cellular respiration in mitochondria ATP powers ATP most cellular work Heat energy
  • 6.
    Concept 9.1: Catabolicpathways yield energy by oxidizing organic fuels • Several processes are central to cellular respiration and related pathways © 2011 Pearson Education, Inc.
  • 7.
    Catabolic Pathways andProduction of ATP • The breakdown of organic molecules is exergonic • Fermentation is a partial degradation of sugars that occurs without O2 • Aerobic respiration consumes organic molecules and O2 and yields ATP • Anaerobic respiration is similar to aerobic respiration but consumes compounds other than O2 © 2011 Pearson Education, Inc.
  • 8.
    • Cellular respirationincludes both aerobic and anaerobic respiration but is often used to refer to aerobic respiration • Although carbohydrates, fats, and proteins are all consumed as fuel, it is helpful to trace cellular respiration with the sugar glucose C6H12O6 + 6 O2 → 6 CO2 + 6 H2O + Energy (ATP + heat) © 2011 Pearson Education, Inc.
  • 9.
    Redox Reactions: Oxidationand Reduction • The transfer of electrons during chemical reactions releases energy stored in organic molecules • This released energy is ultimately used to synthesize ATP © 2011 Pearson Education, Inc.
  • 10.
    The Principle ofRedox • Chemical reactions that transfer electrons between reactants are called oxidation-reduction reactions, or redox reactions • In oxidation, a substance loses electrons, or is oxidized • In reduction, a substance gains electrons, or is reduced (the amount of positive charge is reduced) © 2011 Pearson Education, Inc.
  • 11.
    Figure 9.UN01 becomes oxidized (loses electron) becomes reduced (gains electron)
  • 12.
    Figure 9.UN02 becomes oxidized becomes reduced
  • 13.
    • The electrondonor is called the reducing agent • The electron receptor is called the oxidizing agent • Some redox reactions do not transfer electrons but change the electron sharing in covalent bonds • An example is the reaction between methane and O2 © 2011 Pearson Education, Inc.
  • 14.
    Figure 9.3 Reactants Products becomes oxidized Energy becomes reduced Methane Oxygen Carbon dioxide Water (reducing (oxidizing agent) agent)
  • 15.
    Oxidation of OrganicFuel Molecules During Cellular Respiration • During cellular respiration, the fuel (such as glucose) is oxidized, and O2 is reduced © 2011 Pearson Education, Inc.
  • 16.
    Figure 9.UN03 becomes oxidized becomes reduced
  • 17.
    Stepwise Energy Harvestvia NAD+ and the Electron Transport Chain • In cellular respiration, glucose and other organic molecules are broken down in a series of steps • Electrons from organic compounds are usually first transferred to NAD+, a coenzyme • As an electron acceptor, NAD+ functions as an oxidizing agent during cellular respiration • Each NADH (the reduced form of NAD+) represents stored energy that is tapped to synthesize ATP © 2011 Pearson Education, Inc.
  • 18.
    Figure 9.4 NAD+ NADH Dehydrogenase Reduction of NAD+ (from food) Oxidation of NADH Nicotinamide Nicotinamide (oxidized form) (reduced form)
  • 19.
    Figure 9.UN04 Dehydrogenase
  • 20.
    • NADH passesthe electrons to the electron transport chain • Unlike an uncontrolled reaction, the electron transport chain passes electrons in a series of steps instead of one explosive reaction • O2 pulls electrons down the chain in an energy- yielding tumble • The energy yielded is used to regenerate ATP © 2011 Pearson Education, Inc.
  • 21.
    Figure 9.5 H2 + 1/2 O2 2H + /2 O2 1 (from food via NADH) Controlled release of 2H + 2e + − energy for synthesis of ATP Elec chain ATP Free energy, G Free energy, G tron Explosive ATP release of tran heat and light ATP energy spor 2 e− t 1 /2 O2 2H + H2O H2O (a) Uncontrolled reaction (b) Cellular respiration
  • 22.
    The Stages ofCellular Respiration: A Preview • Harvesting of energy from glucose has three stages – Glycolysis (breaks down glucose into two molecules of pyruvate) – The citric acid cycle (completes the breakdown of glucose) – Oxidative phosphorylation (accounts for most of the ATP synthesis) © 2011 Pearson Education, Inc.
  • 23.
    Figure 9.UN05 1.Glycolysis (color-coded teal throughout the chapter) 2. Pyruvate oxidation and the citric acid cycle (color-coded salmon) 3. Oxidative phosphorylation: electron transport and chemiosmosis (color-coded violet)
  • 24.
    Figure 9.6-1 Electrons carried via NADH Glycolysis Glucose Pyruvate CYTOSOL MITOCHONDRION ATP Substrate-level phosphorylation
  • 25.
    Figure 9.6-2 Electrons Electrons carried carried via NADH and via NADH FADH2 Pyruvate Glycolysis Citric oxidation acid Glucose Pyruvate Acetyl CoA cycle CYTOSOL MITOCHONDRION ATP ATP Substrate-level Substrate-level phosphorylation phosphorylation
  • 26.
    Figure 9.6-3 Electrons Electrons carried carried via NADH and via NADH FADH2 Oxidative Pyruvate Glycolysis Citric phosphorylation: oxidation acid electron transport Glucose Pyruvate Acetyl CoA cycle and chemiosmosis CYTOSOL MITOCHONDRION ATP ATP ATP Substrate-level Substrate-level Oxidative phosphorylation phosphorylation phosphorylation
  • 27.
    • The processthat generates most of the ATP is called oxidative phosphorylation because it is powered by redox reactions © 2011 Pearson Education, Inc.
  • 28.
    • Oxidative phosphorylationaccounts for almost 90% of the ATP generated by cellular respiration • A smaller amount of ATP is formed in glycolysis and the citric acid cycle by substrate-level phosphorylation • For each molecule of glucose degraded to CO2 and water by respiration, the cell makes up to 32 molecules of ATP © 2011 Pearson Education, Inc.
  • 29.
    Figure 9.7 Enzyme Enzyme ADP P Substrate ATP Product
  • 30.
    Concept 9.2: Glycolysisharvests chemical energy by oxidizing glucose to pyruvate • Glycolysis (“splitting of sugar”) breaks down glucose into two molecules of pyruvate • Glycolysis occurs in the cytoplasm and has two major phases – Energy investment phase – Energy payoff phase • Glycolysis occurs whether or not O2 is present © 2011 Pearson Education, Inc.
  • 31.
    Figure 9.8 Energy Investment Phase Glucose 2 ADP + 2 P 2 ATP used Energy Payoff Phase 4 ADP + 4 P 4 ATP formed 2 NAD+ + 4 e− + 4 H+ 2 NADH + 2 H+ 2 Pyruvate + 2 H2O Net Glucose 2 Pyruvate + 2 H2O 4 ATP formed − 2 ATP used 2 ATP 2 NAD+ + 4 e− + 4 H+ 2 NADH + 2 H+
  • 32.
    Figure 9.9-1 Glycolysis: Energy Investment Phase ATP Glucose Glucose 6-phosphate ADP Hexokinase 1
  • 33.
    Figure 9.9-2 Glycolysis: Energy Investment Phase ATP Glucose Glucose 6-phosphate Fructose 6-phosphate ADP Hexokinase Phosphogluco- isomerase 1 2
  • 34.
    Figure 9.9-3 Glycolysis: Energy Investment Phase ATP ATP Glucose Glucose 6-phosphate Fructose 6-phosphate Fructose 1,6-bisphosphate ADP ADP Hexokinase Phosphogluco- Phospho- isomerase fructokinase 1 2 3
  • 35.
    Figure 9.9-4 Glycolysis: Energy Investment Phase ATP ATP Glucose Glucose 6-phosphate Fructose 6-phosphate Fructose 1,6-bisphosphate ADP ADP Hexokinase Phosphogluco- Phospho- isomerase fructokinase 1 2 3 Aldolase 4 Dihydroxyacetone Glyceraldehyde phosphate 3-phosphate To Isomerase 5 step 6
  • 36.
    Figure 9.9-5 Glycolysis: Energy Payoff Phase 2 NADH 2 NAD+ + 2 H+ Triose phosphate 2Pi dehydrogenase 1,3-Bisphospho- 6 glycerate
  • 37.
    Figure 9.9-6 Glycolysis: Energy Payoff Phase 2 ATP 2 NADH 2 NAD+ + 2 H+ 2 ADP 2 Triose Phospho- phosphate 2Pi glycerokinase dehydrogenase 1,3-Bisphospho- 7 3-Phospho- 6 glycerate glycerate
  • 38.
    Figure 9.9-7 Glycolysis: Energy Payoff Phase 2 ATP 2 NADH 2 NAD+ + 2 H+ 2 ADP 2 2 Triose Phospho- Phospho- phosphate glyceromutase 2Pi glycerokinase dehydrogenase 1,3-Bisphospho- 7 3-Phospho- 8 2-Phospho- 6 glycerate glycerate glycerate
  • 39.
    Figure 9.9-8 Glycolysis: Energy Payoff Phase 2 ATP 2 NADH 2 H2O 2 NAD+ + 2 H+ 2 ADP 2 2 2 Triose Phospho- Phospho- Enolase phosphate glyceromutase 2Pi glycerokinase dehydrogenase 9 1,3-Bisphospho- 7 3-Phospho- 8 2-Phospho- Phosphoenol- 6 glycerate glycerate glycerate pyruvate (PEP)
  • 40.
    Figure 9.9-9 Glycolysis: Energy Payoff Phase 2 ATP 2 ATP 2 NADH 2 H2O 2 ADP 2 NAD+ + 2 H+ 2 ADP 2 2 2 Triose Phospho- Phospho- Enolase Pyruvate phosphate glyceromutase kinase 2Pi glycerokinase dehydrogenase 9 1,3-Bisphospho- 7 3-Phospho- 8 2-Phospho- Phosphoenol- 10 Pyruvate 6 glycerate glycerate glycerate pyruvate (PEP)
  • 41.
    Figure 9.9a Glycolysis: Energy Investment Phase ATP Glucose Glucose 6-phosphate Fructose 6-phosphate ADP Hexokinase Phosphogluco- isomerase 1 2
  • 42.
    Figure 9.9b Glycolysis: Energy Investment Phase ATP Fructose 6-phosphate Fructose 1,6-bisphosphate ADP Phospho- fructokinase Aldolase 4 3 Dihydroxyacetone Glyceraldehyde phosphate 3-phosphate To Isomerase 5 step 6
  • 43.
    Figure 9.9c Glycolysis: Energy Payoff Phase 2 ATP 2 NADH 2 NAD+ + 2 H+ 2 ADP 2 2 Triose Phospho- phosphate 2Pi glycerokinase dehydrogenase 1,3-Bisphospho- 7 3-Phospho- 6 glycerate glycerate
  • 44.
    Figure 9.9d Glycolysis: Energy Payoff Phase 2 ATP 2 H2O 2 ADP 2 2 2 2 Phospho- Enolase Pyruvate glyceromutase kinase 9 3-Phospho- 8 2-Phospho- Phosphoenol- 10 Pyruvate glycerate glycerate pyruvate (PEP)
  • 45.
    Concept 9.3: Afterpyruvate is oxidized, the citric acid cycle completes the energy- yielding oxidation of organic molecules • In the presence of O2, pyruvate enters the mitochondrion (in eukaryotic cells) where the oxidation of glucose is completed © 2011 Pearson Education, Inc.
  • 46.
    Oxidation of Pyruvateto Acetyl CoA • Before the citric acid cycle can begin, pyruvate must be converted to acetyl Coenzyme A (acetyl CoA), which links glycolysis to the citric acid cycle • This step is carried out by a multienzyme complex that catalyses three reactions © 2011 Pearson Education, Inc.
  • 47.
    Figure 9.10 MITOCHONDRION CYTOSOL CO2 Coenzyme A 1 3 2 NAD+ NADH + H+ Acetyl CoA Pyruvate Transport protein
  • 48.
    The Citric AcidCycle • The citric acid cycle, also called the Krebs cycle, completes the break down of pyrvate to CO2 • The cycle oxidizes organic fuel derived from pyruvate, generating 1 ATP, 3 NADH, and 1 FADH2 per turn © 2011 Pearson Education, Inc.
  • 49.
    Figure 9.11 Pyruvate CO2 NAD + CoA NADH + H+ Acetyl CoA CoA CoA Citric acid cycle 2 CO2 FADH2 3 NAD+ FAD 3 NADH + 3 H+ ADP + P i ATP
  • 50.
    • The citricacid cycle has eight steps, each catalyzed by a specific enzyme • The acetyl group of acetyl CoA joins the cycle by combining with oxaloacetate, forming citrate • The next seven steps decompose the citrate back to oxaloacetate, making the process a cycle • The NADH and FADH2 produced by the cycle relay electrons extracted from food to the electron transport chain © 2011 Pearson Education, Inc.
  • 51.
    Figure 9.12-1 Acetyl CoA CoA-SH 1 Oxaloacetate Citrate Citric acid cycle
  • 52.
    Figure 9.12-2 Acetyl CoA CoA-SH 1 H2O Oxaloacetate 2 Citrate Isocitrate Citric acid cycle
  • 53.
    Figure 9.12-3 Acetyl CoA CoA-SH 1 H2O Oxaloacetate 2 Citrate Isocitrate NAD+ Citric 3 NADH acid + H+ cycle CO2 α-Ketoglutarate
  • 54.
    Figure 9.12-4 Acetyl CoA CoA-SH 1 H2O Oxaloacetate 2 Citrate Isocitrate NAD+ Citric 3 NADH acid + H+ cycle CO2 CoA-SH α-Ketoglutarate 4 CO2 NAD+ NADH Succinyl + H+ CoA
  • 55.
    Figure 9.12-5 Acetyl CoA CoA-SH 1 H2O Oxaloacetate 2 Citrate Isocitrate NAD+ Citric 3 NADH acid + H+ cycle CO2 CoA-SH α-Ketoglutarate 4 CoA-SH 5 CO2 NAD+ Succinate Pi NADH GTP GDP Succinyl + H+ CoA ADP ATP
  • 56.
    Figure 9.12-6 Acetyl CoA CoA-SH 1 H2O Oxaloacetate 2 Citrate Isocitrate NAD+ Citric 3 NADH acid + H+ cycle CO2 Fumarate CoA-SH α-Ketoglutarate 6 4 CoA-SH FADH2 5 CO2 NAD+ FAD Succinate Pi NADH GTP GDP Succinyl + H+ CoA ADP ATP
  • 57.
    Figure 9.12-7 Acetyl CoA CoA-SH 1 H2O Oxaloacetate 2 Malate Citrate Isocitrate NAD+ Citric 3 NADH 7 acid + H+ H2 O cycle CO2 Fumarate CoA-SH α-Ketoglutarate 6 4 CoA-SH FADH2 5 CO2 NAD+ FAD Succinate Pi NADH GTP GDP Succinyl + H+ CoA ADP ATP
  • 58.
    Figure 9.12-8 Acetyl CoA CoA-SH NADH + H+ 1 H2O NAD+ 8 Oxaloacetate 2 Malate Citrate Isocitrate NAD+ Citric 3 NADH 7 acid + H+ H2 O cycle CO2 Fumarate CoA-SH α-Ketoglutarate 6 4 CoA-SH FADH2 5 CO2 NAD+ FAD Succinate Pi NADH GTP GDP Succinyl + H+ CoA ADP ATP
  • 59.
    Figure 9.12a Acetyl CoA CoA-SH 1 H2O Oxaloacetate 2 Citrate Isocitrate
  • 60.
    Figure 9.12b Isocitrate NAD+ NADH 3 + H+ CO2 CoA-SH α-Ketoglutarate 4 CO2 NAD+ NADH Succinyl + H+ CoA
  • 61.
    Figure 9.12c Fumarate 6 CoA-SH FADH2 5 FAD Succinate Pi GTP GDP Succinyl CoA ADP ATP
  • 62.
    Figure 9.12d NADH + H+ NAD+ 8 Oxaloacetate Malate 7 H2O Fumarate
  • 63.
    Concept 9.4: Duringoxidative phosphorylation, chemiosmosis couples electron transport to ATP synthesis • Following glycolysis and the citric acid cycle, NADH and FADH2 account for most of the energy extracted from food • These two electron carriers donate electrons to the electron transport chain, which powers ATP synthesis via oxidative phosphorylation © 2011 Pearson Education, Inc.
  • 64.
    The Pathway ofElectron Transport • The electron transport chain is in the inner membrane (cristae) of the mitochondrion • Most of the chain’s components are proteins, which exist in multiprotein complexes • The carriers alternate reduced and oxidized states as they accept and donate electrons • Electrons drop in free energy as they go down the chain and are finally passed to O2, forming H2O © 2011 Pearson Education, Inc.
  • 65.
    Figure 9.13 NADH 50 2 e− NAD+ FADH2 2 e− FAD Multiprotein Free energy (G) relative to O2 (kcal/mol) 40 FMN I complexes Fe• S II Fe• S Q III Cyt b Fe• S 30 Cyt c1 IV Cyt c Cyt a Cyt a3 20 2 e− 10 (originally from NADH or FADH2) 0 2 H+ + 1/2 O2 H2O
  • 66.
    • Electrons aretransferred from NADH or FADH2 to the electron transport chain • Electrons are passed through a number of proteins including cytochromes (each with an iron atom) to O2 • The electron transport chain generates no ATP directly • It breaks the large free-energy drop from food to O2 into smaller steps that release energy in manageable amounts © 2011 Pearson Education, Inc.
  • 67.
    Chemiosmosis: The Energy-Coupling Mechanism • Electron transfer in the electron transport chain causes proteins to pump H+ from the mitochondrial matrix to the intermembrane space • H+ then moves back across the membrane, passing through the proton, ATP synthase • ATP synthase uses the exergonic flow of H+ to drive phosphorylation of ATP • This is an example of chemiosmosis, the use of energy in a H+ gradient to drive cellular work © 2011 Pearson Education, Inc.
  • 68.
    Figure 9.14 INTERMEMBRANE SPACE H+ Stator Rotor Internal rod Catalytic knob ADP + Pi ATP MITOCHONDRIAL MATRIX
  • 69.
    Figure 9.15 H+ H + Protein H + complex H+ Cyt c of electron carriers IV Q III I ATP II synth- 2 H+ + 1/2O2 H2O ase FADH2 FAD NADH NAD+ ADP + P i ATP (carrying electrons from food) H+ 1 Electron transport chain 2 Chemiosmosis Oxidative phosphorylation
  • 70.
    • The energystored in a H+ gradient across a membrane couples the redox reactions of the electron transport chain to ATP synthesis • The H+ gradient is referred to as a proton- motive force, emphasizing its capacity to do work © 2011 Pearson Education, Inc.
  • 71.
    An Accounting ofATP Production by Cellular Respiration • During cellular respiration, most energy flows in this sequence: glucose → NADH → electron transport chain → proton-motive force → ATP • About 34% of the energy in a glucose molecule is transferred to ATP during cellular respiration, making about 32 ATP • There are several reasons why the number of ATP is not known exactly © 2011 Pearson Education, Inc.
  • 72.
    Figure 9.16 Electron shuttles MITOCHONDRION span membrane 2 NADH or 2 FADH2 2 NADH 2 NADH 6 NADH 2 FADH2 Glycolysis Pyruvate oxidation Oxidative Citric phosphorylation: Glucose 2 Pyruvate 2 Acetyl CoA acid electron transport cycle and chemiosmosis + 2 ATP + 2 ATP + about 26 or 28 ATP About Maximum per glucose: 30 or 32 ATP CYTOSOL
  • 73.
    Concept 9.5: Fermentationand anaerobic respiration enable cells to produce ATP without the use of oxygen • Most cellular respiration requires O2 to produce ATP • Without O2, the electron transport chain will cease to operate • In that case, glycolysis couples with fermentation or anaerobic respiration to produce ATP © 2011 Pearson Education, Inc.
  • 74.
    • Anaerobic respirationuses an electron transport chain with a final electron acceptor other than O2, for example sulfate • Fermentation uses substrate-level phosphorylation instead of an electron transport chain to generate ATP © 2011 Pearson Education, Inc.
  • 75.
    Types of Fermentation • Fermentation consists of glycolysis plus reactions that regenerate NAD+, which can be reused by glycolysis • Two common types are alcohol fermentation and lactic acid fermentation © 2011 Pearson Education, Inc.
  • 76.
    • In alcoholfermentation, pyruvate is converted to ethanol in two steps, with the first releasing CO2 • Alcohol fermentation by yeast is used in brewing, winemaking, and baking © 2011 Pearson Education, Inc.
  • 77.
    Figure 9.17 2 ADP + 2 P 2 ATP 2 ADP + 2 P 2 ATP i i Glucose Glycolysis Glucose Glycolysis 2 Pyruvate 2 NAD + 2 NADH 2 CO2 2 NAD + 2 NADH + 2 H+ + 2 H+ 2 Pyruvate 2 Ethanol 2 Acetaldehyde 2 Lactate (a) Alcohol fermentation (b) Lactic acid fermentation
  • 78.
    Figure 9.17a 2 ADP + 2 P i 2 ATP Glucose Glycolysis 2 Pyruvate 2 NAD + 2 NADH 2 CO2 + 2 H+ 2 Ethanol 2 Acetaldehyde (a) Alcohol fermentation
  • 79.
    • In lacticacid fermentation, pyruvate is reduced to NADH, forming lactate as an end product, with no release of CO2 • Lactic acid fermentation by some fungi and bacteria is used to make cheese and yogurt • Human muscle cells use lactic acid fermentation to generate ATP when O2 is scarce © 2011 Pearson Education, Inc.
  • 80.
    Figure 9.17b 2 ADP + 2 P i 2 ATP Glucose Glycolysis 2 NAD + 2 NADH + 2 H+ 2 Pyruvate 2 Lactate (b) Lactic acid fermentation
  • 81.
    Comparing Fermentation withAnaerobic and Aerobic Respiration • All use glycolysis (net ATP =2) to oxidize glucose and harvest chemical energy of food • In all three, NAD+ is the oxidizing agent that accepts electrons during glycolysis • The processes have different final electron acceptors: an organic molecule (such as pyruvate or acetaldehyde) in fermentation and O2 in cellular respiration • Cellular respiration produces 32 ATP per glucose molecule; fermentation produces 2 ATP per glucose molecule © 2011 Pearson Education, Inc.
  • 82.
    • Obligate anaerobescarry out fermentation or anaerobic respiration and cannot survive in the presence of O2 • Yeast and many bacteria are facultative anaerobes, meaning that they can survive using either fermentation or cellular respiration • In a facultative anaerobe, pyruvate is a fork in the metabolic road that leads to two alternative catabolic routes © 2011 Pearson Education, Inc.

Editor's Notes

  • #3 For the Discovery Video Space Plants, go to Animation and Video Files.
  • #4 Figure 9.1 How do these leaves power the work of life for this chimpanzee?
  • #6 Figure 9.2 Energy flow and chemical recycling in ecosystems.
  • #12 Figure 9.UN01 In-text figure, p. 164
  • #13 Figure 9.UN02 In-text figure, p. 164
  • #15 Figure 9.3 Methane combustion as an energy-yielding redox reaction.
  • #17 Figure 9.UN03 In-text figure, p. 165
  • #19 Figure 9.4 NAD  as an electron shuttle.
  • #20 Figure 9.UN04 In-text figure, p. 166
  • #22 Figure 9.5 An introduction to electron transport chains.
  • #24 Figure 9.UN05 In-text figure, p. 167
  • #25 Figure 9.6 An overview of cellular respiration.
  • #26 Figure 9.6 An overview of cellular respiration.
  • #27 Figure 9.6 An overview of cellular respiration.
  • #30 Figure 9.7 Substrate-level phosphorylation.
  • #32 Figure 9.8 The energy input and output of glycolysis.
  • #33 Figure 9.9 A closer look at glycolysis.
  • #34 Figure 9.9 A closer look at glycolysis.
  • #35 Figure 9.9 A closer look at glycolysis.
  • #36 Figure 9.9 A closer look at glycolysis.
  • #37 Figure 9.9 A closer look at glycolysis.
  • #38 Figure 9.9 A closer look at glycolysis.
  • #39 Figure 9.9 A closer look at glycolysis.
  • #40 Figure 9.9 A closer look at glycolysis.
  • #41 Figure 9.9 A closer look at glycolysis.
  • #42 Figure 9.9 A closer look at glycolysis. Figure 9.9 A closer look at glycolysis.
  • #43 Figure 9.9 A closer look at glycolysis.
  • #44 Figure 9.9 A closer look at glycolysis.
  • #45 Figure 9.9 A closer look at glycolysis.
  • #48 Figure 9.10 Oxidation of pyruvate to acetyl CoA, the step before the citric acid cycle.
  • #50 Figure 9.11 An overview of pyruvate oxidation and the citric acid cycle.
  • #52 Figure 9.12 A closer look at the citric acid cycle.
  • #53 Figure 9.12 A closer look at the citric acid cycle.
  • #54 Figure 9.12 A closer look at the citric acid cycle.
  • #55 Figure 9.12 A closer look at the citric acid cycle.
  • #56 Figure 9.12 A closer look at the citric acid cycle.
  • #57 Figure 9.12 A closer look at the citric acid cycle.
  • #58 Figure 9.12 A closer look at the citric acid cycle.
  • #59 Figure 9.12 A closer look at the citric acid cycle.
  • #60 Figure 9.12 A closer look at the citric acid cycle.
  • #61 Figure 9.12 A closer look at the citric acid cycle.
  • #62 Figure 9.12 A closer look at the citric acid cycle.
  • #63 Figure 9.12 A closer look at the citric acid cycle.
  • #64 For the Cell Biology Video ATP Synthase 3D Structure — Side View, go to Animation and Video Files. For the Cell Biology Video ATP Synthase 3D Structure — Top View, go to Animation and Video Files.
  • #66 Figure 9.13 Free-energy change during electron transport.
  • #69 Figure 9.14 ATP synthase, a molecular mill.
  • #70 Figure 9.15 Chemiosmosis couples the electron transport chain to ATP synthesis.
  • #73 Figure 9.16 ATP yield per molecule of glucose at each stage of cellular respiration.
  • #78 Figure 9.17 Fermentation.
  • #79 Figure 9.17 Fermentation.
  • #81 Figure 9.17 Fermentation.