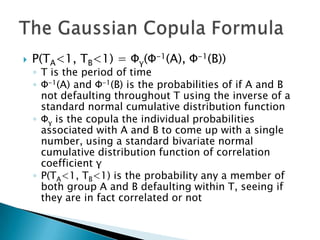
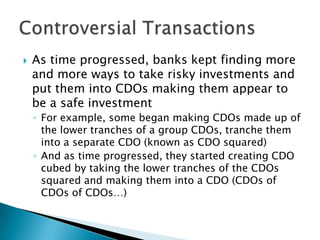
Shane Kaiser
   2007/2008 – End of Housing Bubble
    ◦ Marked the start of the major recession, and left
      most people with feelings of wanting to find some
      one to blame
    ◦ Most ended up initally blaming the big financial
      institutions (Bear Sterns, Goldman Sachs, AIG, etc.)
    ◦ Many people then pointed the finger at the
      formulas the big corporations were using to rate
      the risk their investments
    ◦ The main formula being the Gaussian Copula
      formula, created by the mathematician and actuary
      Dr. David X. Li
   Inventor of this Gaussian Copula formula
   Born and grew up in China in the 1960s and
    became a well known a quantitative analyst and
    actuary
   In 2000, he published a paper titled “On Default
    Correlation: A Copula Function Approach” which
    was the first instance were he used his formula
    on to rate Collateralized Debt Obligations (CDOs)
   The Financial Times called him the world’s most
    influential actuary after publishing this paper
   CDOs are a type of structured asset-backed
    security (ABS) whose value and payments are
    derived from a portfolio of fixed-
    income underlying assets, such as such as
    bonds, loans, credit default swaps, and
    mortgage-backed securities
   The first one was issued in 1987, and grew in
    popularity throughout the late 1990s and
    early to mid 2000s, similarly to how CDSs
    grew
   When purchasing a CDO, there are different
    levels of security, known as tranches
   The “senior” tranche gets paid first and is the
    most secure but most expensive
   The lowest tranche or subordinate/equity
    tranche are the riskiest but cheapest
   Investors in the tranches have the ultimate
    credit risk exposure to the underlying
    entities, so banks used them as a way to
    transfer risk from themselves to investors
   On each tranche the investor has an
    “attachment percentage” and a “detachment
    percentage”
   When the total percentage loss of the entities
    in the CDO reach the attachment
    percentage, investors in that tranche start to
    lose money (not get paid fully) and when the
    total percentage the detachment
    percentage, the investors in that tranche
    won’t get paid at all
   Example:
    ◦   Tranche   1   =   0% - 5%
    ◦   Tranche   2   =   5% - 15%
    ◦   Tranche   3   =   15% - 30%
    ◦   Tranche   4   =   30% - 70%
   If CDO has a 3% loss, the members in Tranche 1
    (the equity tranche) will absorb that loss, but the
    rest of the investors will be unaffected.
   If the CDO has a 35% loss, the members of
    Tranche 1 and 2 will receive no payment, Tranche
    3 will lose most of its payment, and Tranche 4
    (the senior tranche) will be unaffected
   When the paper was first published, it caught the
    attention of many people, as he allegedly found a
    way to came up with a way using “relatively”
    simple mathematics to model the correlation
    between two entities defaulting without looking
    at any historical default data
   Instead of using historical default data, he used
    historical prices from the CDS market
    ◦ The CDS market was less than a decade old at this point
   The main flaw in his assumptions was that he
    trusted that the financial markets, and CDS
    markets in particular, were pricing CDS’s default
    risk correctly on each individual underlying
   Every underlying is give a certain amount of
    “basis points” (each representing .01%)
   These basis points are dependent upon the
    stability/riskiness of the underlying credit
   The riskier the underlying, the higher the
    basis points will be.
    ◦ Reflect markets perception of the risk of default
      over the risk free rate, almost like a percentage
      chance of how likely the underlying will default
      before maturity
   A copula is used in statistics to couple the
    behavior of two or more variables and
    determine if the variables are correlated
   With CDOs and portfolio/index CDSs having
    so many different underlying entities at
    times, a copula seemed perfect for this
    situation
   There are many different kinds of copula
    formulas, but Dr. Li’s Gaussian Formula was
    the only one the was used to measure risk of
    default
   P(TA<1, TB<1) = Φγ(Φ-1(A), Φ-1(B))
    ◦ T is the period of time
    ◦ Φ-1(A) and Φ-1(B) is the probabilities of if A and B
      not defaulting throughout T using the inverse of a
      standard normal cumulative distribution function
    ◦ Φγ is the copula the individual probabilities
      associated with A and B to come up with a single
      number, using a standard bivariate normal
      cumulative distribution function of correlation
      coefficient γ
    ◦ P(TA<1, TB<1) is the probability any a member of
      both group A and B defaulting within T, seeing if
      they are in fact correlated or not
   The industry loved it, and began selling off
    more AAA rated securities than ever before
   This was because the rating agencies no
    longer needed to examine the underlying
    thoroughly, they just needed this one
    correlation number
   If the underlying entities were considered to
    not be correlated, it was considered nearly
    very low risk CDO, especially for investors
    looking to be a part of the senior tranche
   Banks began throwing all kinds of risky
    underlying together in a CDO, and as long as
    they didn’t have a high correlation of
    defaulting, the CDO was able to get a high
    rating
   As time went on the market for CDSs and
    CDOs exploded
    ◦ The CDS market grew from $920 billion at the end
      of 2001 in credit default swaps outstanding to $62
      trillion by the end of 2007
    ◦ The CDO market grew from at $275 billion in 2000
      to $4.7 trillion by 2006
   Before the formula:
    ◦ it was considered good practice to have diversify
      the underlying entities in a CDO
   With the formula:
    ◦ if you were to found a group of home loans that
      were found not to be highly correlated to
      default, banks would advertise the CDO as a safe
      investment with a high rating, because you know
      you will never lose everything
   As time progressed, banks kept finding more
    and more ways to take risky investments and
    put them into CDOs making them appear to
    be a safe investment
    ◦ For example, some began making CDOs made up of
      the lower tranches of a group CDOs, tranche them
      into a separate CDO (known as CDO squared)
    ◦ And as time progressed, they started creating CDO
      cubed by taking the lower tranches of the CDOs
      squared and making them into a CDO (CDOs of
      CDOs of CDOs…)
   Banks began finding ways to sell off riskier and
    riskier CDOs, especially ones with home loans, by
    using this new rating system
   Banks also began giving out more home loans
    and mortgages to riskier prospective
    homeowners, knowing in the long run they can
    sell off all the risk through a CDO
    ◦ Additionally the government was pushing banks and
      incentivizing them to issue more home loans
    ◦ Originally banks were resistant to the governments
      demands, but began to comply when they knew they
      could just get rid of all the risk and receive the
      government benefits
   Li’s formula was used to price hundreds of
    billions of dollars' worth of CDOs filled with
    mortgages, and a lot of them being sub-prime
    ◦ CDSs were less than a decade old at this point, and it
      was during a period when house prices soared, which
      made rates of default and default correlations very
      low, giving the CDOs a high rating
    ◦ But when the mortgage boom ended with the bubble
      popping, values of homes fall across the country
    ◦ People began defaulting on homes, and default
      correlations started showing up, but it was too late
    ◦ Home loan CDOs that once had a AAA rating, became
      worthless
   “Very few people understand the essence of the
    model” – Dr. Li
   Investment banks would regularly call Dr. Li to
    come in to speak about his formula he would
    warn them that it was not suitable for use in risk
    management or valuation.
   It was merely a method to determine if entities
    are likely to default at the same time
   Banks never really listened to Dr. Li’s warnings
    partly because they were making too much
    money to stop what they were doing
    ◦ It was working for a good 6 to 7 years
   Bankers should have noted that very small
    changes in their underlying assumptions
    (such as the correlation parameter) could
    result in very large changes in the correlation
    number, but many of them did not truly
    understand how the formal worked
    ◦ They were able to understand a single correlation
      number, and exploited it by abuseding the rating
      system
   http://www.wired.com/techbiz/it/magazine/17-
    03/wp_quant?currentPage=all
   http://www.ft.com/cms/s/2/912d85e8-2d75-11de-9eba-
    00144feabdc0.html#axzz17RdCGcza
   http://en.wikipedia.org/wiki/David_X._Li
   http://www.forbes.com/2009/05/07/gaussian-copula-david-x-li-
    opinions-columnists-risk-debt.html
   http://en.wikipedia.org/wiki/Copula_(statistics)#Gaussian_copula
   http://en.wikipedia.org/wiki/Subprime_mortgage_crisis#Government_po
    licies
   http://en.wikipedia.org/wiki/Collateralized_Debt_Obligations#Investors
   http://www.google.com/url?sa=t&source=web&cd=1&ved=0CBYQFjAA&
    url=http%3A%2F%2Fciteseerx.ist.psu.edu%2Fviewdoc%2Fdownload%3Fdoi
    %3D10.1.1.123.5878%26rep%3Drep1%26type%3Dpdf&rct=j&q=pricing%
    20of%20CDO&ei=-3_-TI2REIGglAenzs2nCA&usg=AFQjCNG5q-
    X2MPdrBSH5Kf5OM3yNJRXP4Q&cad=rja

CDS/CDOs and the Gaussian Copula Formula

  • 1.
  • 2.
    2007/2008 – End of Housing Bubble ◦ Marked the start of the major recession, and left most people with feelings of wanting to find some one to blame ◦ Most ended up initally blaming the big financial institutions (Bear Sterns, Goldman Sachs, AIG, etc.) ◦ Many people then pointed the finger at the formulas the big corporations were using to rate the risk their investments ◦ The main formula being the Gaussian Copula formula, created by the mathematician and actuary Dr. David X. Li
  • 3.
    Inventor of this Gaussian Copula formula  Born and grew up in China in the 1960s and became a well known a quantitative analyst and actuary  In 2000, he published a paper titled “On Default Correlation: A Copula Function Approach” which was the first instance were he used his formula on to rate Collateralized Debt Obligations (CDOs)  The Financial Times called him the world’s most influential actuary after publishing this paper
  • 4.
    CDOs are a type of structured asset-backed security (ABS) whose value and payments are derived from a portfolio of fixed- income underlying assets, such as such as bonds, loans, credit default swaps, and mortgage-backed securities  The first one was issued in 1987, and grew in popularity throughout the late 1990s and early to mid 2000s, similarly to how CDSs grew
  • 5.
    When purchasing a CDO, there are different levels of security, known as tranches  The “senior” tranche gets paid first and is the most secure but most expensive  The lowest tranche or subordinate/equity tranche are the riskiest but cheapest  Investors in the tranches have the ultimate credit risk exposure to the underlying entities, so banks used them as a way to transfer risk from themselves to investors
  • 6.
    On each tranche the investor has an “attachment percentage” and a “detachment percentage”  When the total percentage loss of the entities in the CDO reach the attachment percentage, investors in that tranche start to lose money (not get paid fully) and when the total percentage the detachment percentage, the investors in that tranche won’t get paid at all
  • 7.
    Example: ◦ Tranche 1 = 0% - 5% ◦ Tranche 2 = 5% - 15% ◦ Tranche 3 = 15% - 30% ◦ Tranche 4 = 30% - 70%  If CDO has a 3% loss, the members in Tranche 1 (the equity tranche) will absorb that loss, but the rest of the investors will be unaffected.  If the CDO has a 35% loss, the members of Tranche 1 and 2 will receive no payment, Tranche 3 will lose most of its payment, and Tranche 4 (the senior tranche) will be unaffected
  • 8.
    When the paper was first published, it caught the attention of many people, as he allegedly found a way to came up with a way using “relatively” simple mathematics to model the correlation between two entities defaulting without looking at any historical default data  Instead of using historical default data, he used historical prices from the CDS market ◦ The CDS market was less than a decade old at this point  The main flaw in his assumptions was that he trusted that the financial markets, and CDS markets in particular, were pricing CDS’s default risk correctly on each individual underlying
  • 9.
    Every underlying is give a certain amount of “basis points” (each representing .01%)  These basis points are dependent upon the stability/riskiness of the underlying credit  The riskier the underlying, the higher the basis points will be. ◦ Reflect markets perception of the risk of default over the risk free rate, almost like a percentage chance of how likely the underlying will default before maturity
  • 10.
    A copula is used in statistics to couple the behavior of two or more variables and determine if the variables are correlated  With CDOs and portfolio/index CDSs having so many different underlying entities at times, a copula seemed perfect for this situation  There are many different kinds of copula formulas, but Dr. Li’s Gaussian Formula was the only one the was used to measure risk of default
  • 11.
    P(TA<1, TB<1) = Φγ(Φ-1(A), Φ-1(B)) ◦ T is the period of time ◦ Φ-1(A) and Φ-1(B) is the probabilities of if A and B not defaulting throughout T using the inverse of a standard normal cumulative distribution function ◦ Φγ is the copula the individual probabilities associated with A and B to come up with a single number, using a standard bivariate normal cumulative distribution function of correlation coefficient γ ◦ P(TA<1, TB<1) is the probability any a member of both group A and B defaulting within T, seeing if they are in fact correlated or not
  • 12.
    The industry loved it, and began selling off more AAA rated securities than ever before  This was because the rating agencies no longer needed to examine the underlying thoroughly, they just needed this one correlation number  If the underlying entities were considered to not be correlated, it was considered nearly very low risk CDO, especially for investors looking to be a part of the senior tranche
  • 13.
    Banks began throwing all kinds of risky underlying together in a CDO, and as long as they didn’t have a high correlation of defaulting, the CDO was able to get a high rating  As time went on the market for CDSs and CDOs exploded ◦ The CDS market grew from $920 billion at the end of 2001 in credit default swaps outstanding to $62 trillion by the end of 2007 ◦ The CDO market grew from at $275 billion in 2000 to $4.7 trillion by 2006
  • 14.
    Before the formula: ◦ it was considered good practice to have diversify the underlying entities in a CDO  With the formula: ◦ if you were to found a group of home loans that were found not to be highly correlated to default, banks would advertise the CDO as a safe investment with a high rating, because you know you will never lose everything
  • 15.
    As time progressed, banks kept finding more and more ways to take risky investments and put them into CDOs making them appear to be a safe investment ◦ For example, some began making CDOs made up of the lower tranches of a group CDOs, tranche them into a separate CDO (known as CDO squared) ◦ And as time progressed, they started creating CDO cubed by taking the lower tranches of the CDOs squared and making them into a CDO (CDOs of CDOs of CDOs…)
  • 16.
    Banks began finding ways to sell off riskier and riskier CDOs, especially ones with home loans, by using this new rating system  Banks also began giving out more home loans and mortgages to riskier prospective homeowners, knowing in the long run they can sell off all the risk through a CDO ◦ Additionally the government was pushing banks and incentivizing them to issue more home loans ◦ Originally banks were resistant to the governments demands, but began to comply when they knew they could just get rid of all the risk and receive the government benefits
  • 17.
    Li’s formula was used to price hundreds of billions of dollars' worth of CDOs filled with mortgages, and a lot of them being sub-prime ◦ CDSs were less than a decade old at this point, and it was during a period when house prices soared, which made rates of default and default correlations very low, giving the CDOs a high rating ◦ But when the mortgage boom ended with the bubble popping, values of homes fall across the country ◦ People began defaulting on homes, and default correlations started showing up, but it was too late ◦ Home loan CDOs that once had a AAA rating, became worthless
  • 18.
    “Very few people understand the essence of the model” – Dr. Li  Investment banks would regularly call Dr. Li to come in to speak about his formula he would warn them that it was not suitable for use in risk management or valuation.  It was merely a method to determine if entities are likely to default at the same time  Banks never really listened to Dr. Li’s warnings partly because they were making too much money to stop what they were doing ◦ It was working for a good 6 to 7 years
  • 19.
    Bankers should have noted that very small changes in their underlying assumptions (such as the correlation parameter) could result in very large changes in the correlation number, but many of them did not truly understand how the formal worked ◦ They were able to understand a single correlation number, and exploited it by abuseding the rating system
  • 20.
    http://www.wired.com/techbiz/it/magazine/17- 03/wp_quant?currentPage=all  http://www.ft.com/cms/s/2/912d85e8-2d75-11de-9eba- 00144feabdc0.html#axzz17RdCGcza  http://en.wikipedia.org/wiki/David_X._Li  http://www.forbes.com/2009/05/07/gaussian-copula-david-x-li- opinions-columnists-risk-debt.html  http://en.wikipedia.org/wiki/Copula_(statistics)#Gaussian_copula  http://en.wikipedia.org/wiki/Subprime_mortgage_crisis#Government_po licies  http://en.wikipedia.org/wiki/Collateralized_Debt_Obligations#Investors  http://www.google.com/url?sa=t&source=web&cd=1&ved=0CBYQFjAA& url=http%3A%2F%2Fciteseerx.ist.psu.edu%2Fviewdoc%2Fdownload%3Fdoi %3D10.1.1.123.5878%26rep%3Drep1%26type%3Dpdf&rct=j&q=pricing% 20of%20CDO&ei=-3_-TI2REIGglAenzs2nCA&usg=AFQjCNG5q- X2MPdrBSH5Kf5OM3yNJRXP4Q&cad=rja

Editor's Notes

  • #4 Working for JP Morgan Chase at the time of paper
  • #6 There’s also mezzanine
  • #8 Higher is dectachment, Lower in attachement
  • #9 Rember CDS market was all over the counter, and has no kind of regulation
  • #11 Many different kinds of copula’s, but the Gaussian is used in the financial sector
  • #12 Errors here massively increase the risk of the whole equation blowing up.is the density function for the standard bivariate Gaussian with Pearson&apos;s product moment correlation coefficient ρ and is the standard normal density.
  • #17 Alternative Mortgage Transactions Parity Act (AMTPA), which allowed non-federally chartered housing creditors to write adjustable-rate mortgages80% of subprime mortgages are adjustable-rate mortgages
  • #18 drawing their correlation data from a period when real estate only went up