This document is a country background report for Kazakhstan prepared by JSC "Information-Analytic Center" for the OECD Review of Policies to Improve the Effectiveness of Resource Use in Schools. The report provides information on Kazakhstan's education system, including the organization of schools, distribution of responsibilities, performance, challenges, and resource governance, distribution, utilization, and management. It contains data in over 60 tables and figures on topics such as education spending, teacher needs, facilities, student enrollment and performance, and more. The report was prepared according to OECD guidelines to inform their review of improving resource use in schools.

![35
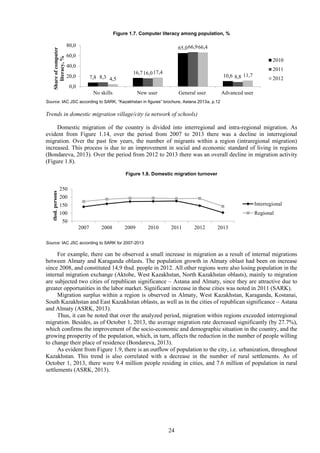
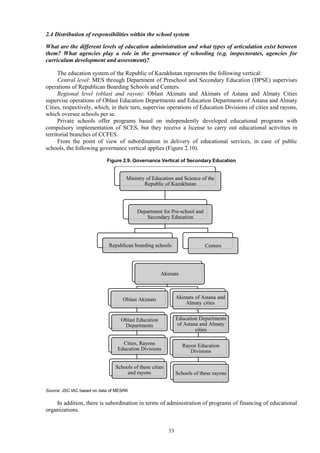
2.1 Organisation of the school system
Outline the main structural features of the school system – levels of education;
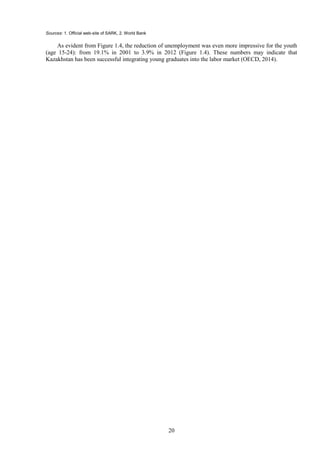
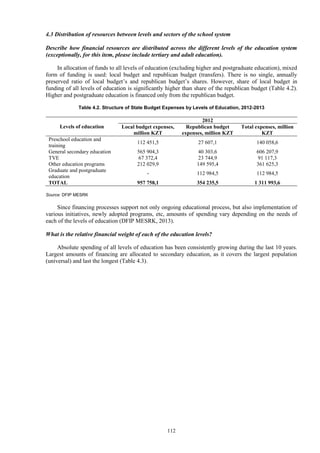
According to the Law “On Education”4
secondary education is education guaranteed by the
Constitution of the Republic of Kazakhstan (1995) and obtained by citizens as a result of completion of
general education programs of primary, lower secondaryand general secondary education in accordance
with state mandatory standards of education.
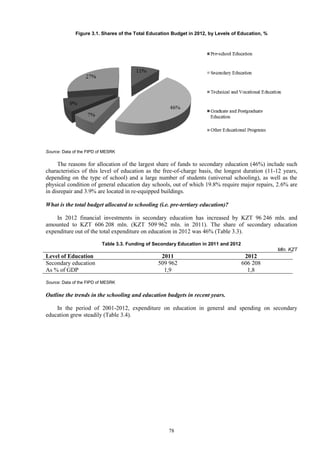
Secondary education is a fundamental level of education system. General secondary education is
obtained through consecutive completion of three levels of educational programs: primary (1st-4th
grades), basic (5th-9th grades) and senior (10th-11th or 12th grades). These levels of education could be
all delivered by a single general education institution, or separately by primary or lower secondaryschool.
According to the Constitution (1995) and Law “On Education”, “the state ensures provision of free-of-
charge […] primary, lower secondaryand general secondary education to citizens of Kazakhstan”.
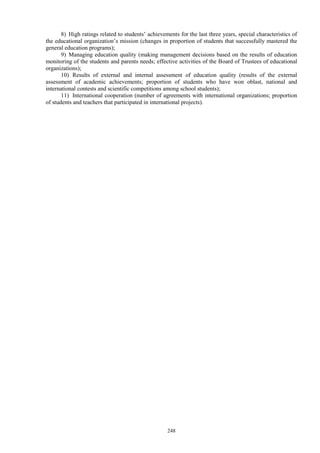
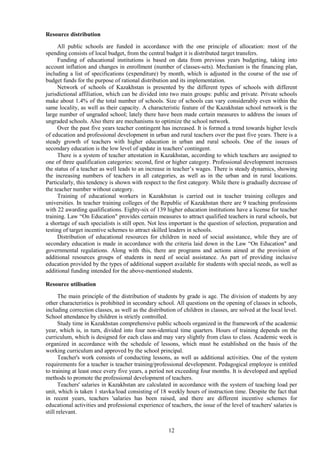
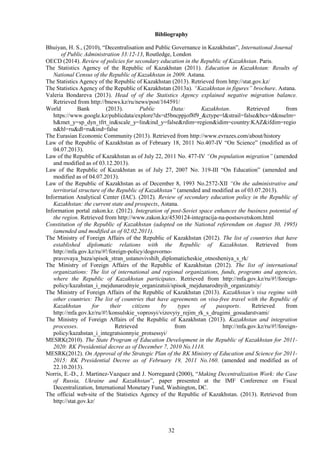
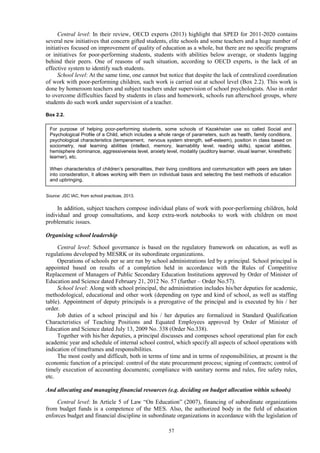
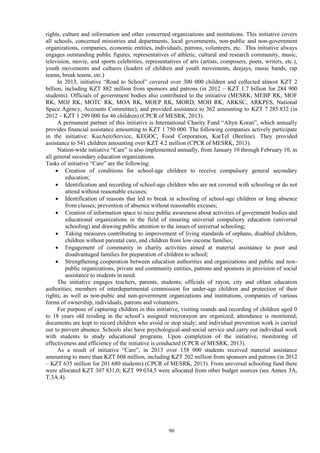
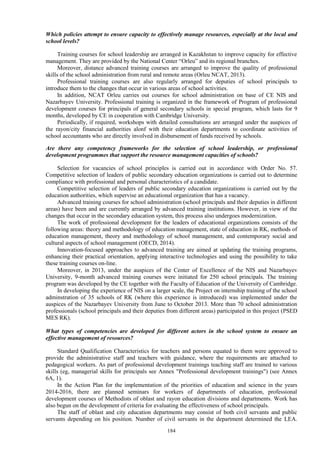
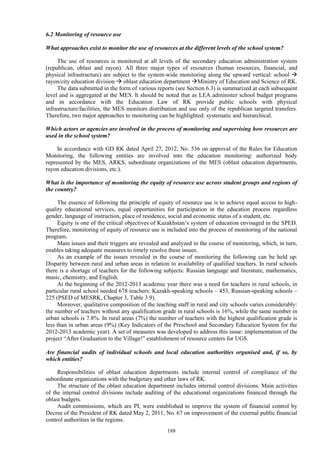
Types and numbers of schools
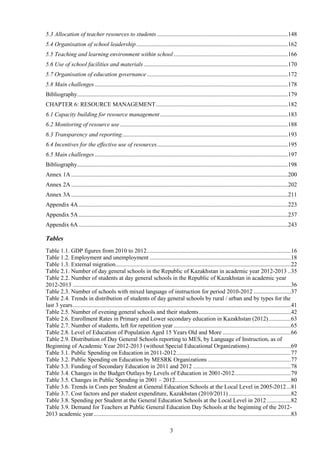
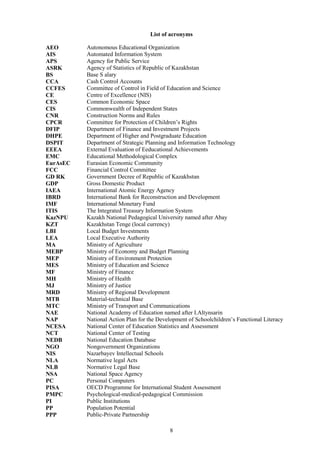
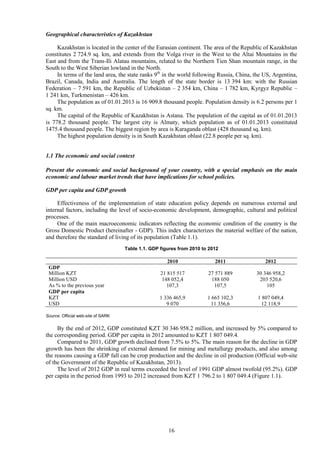
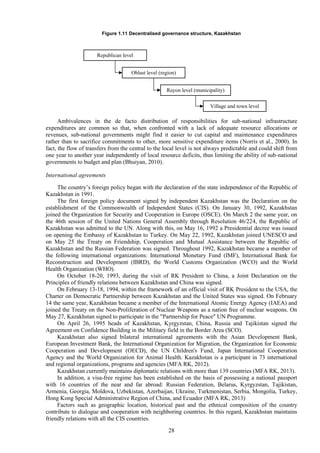
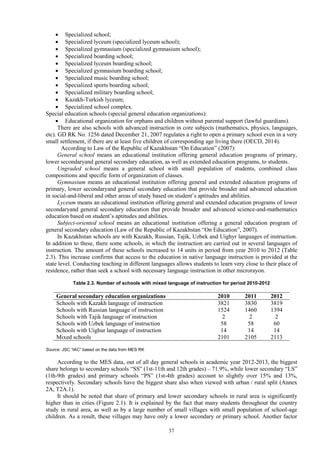
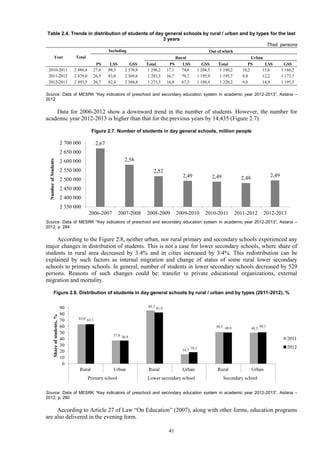
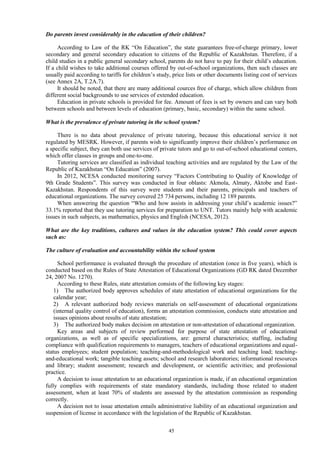
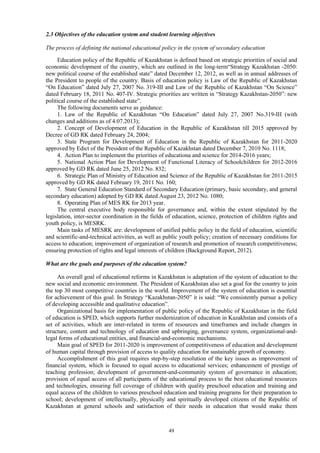
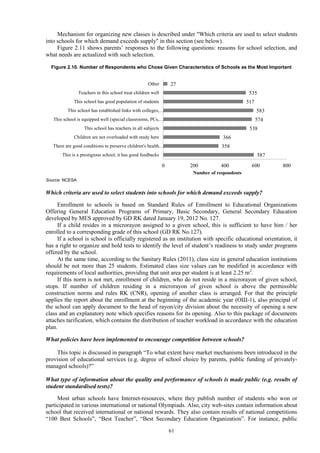
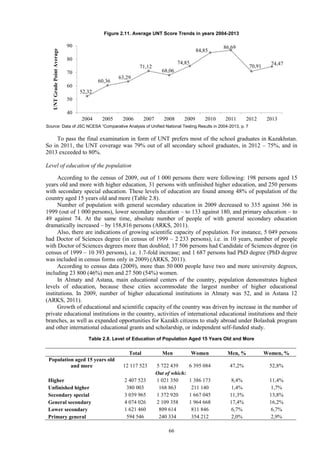
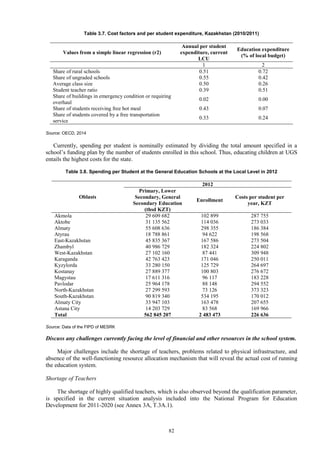
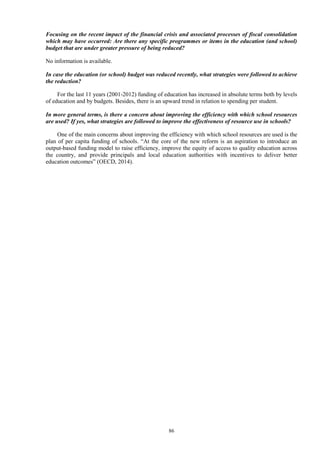
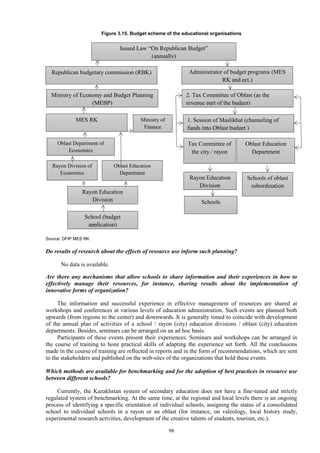
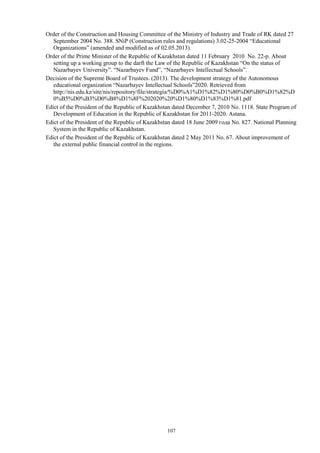
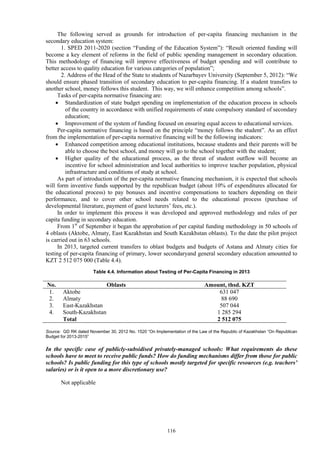
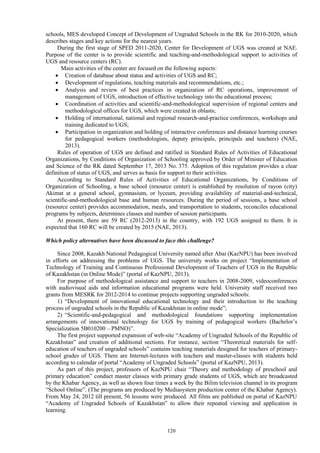
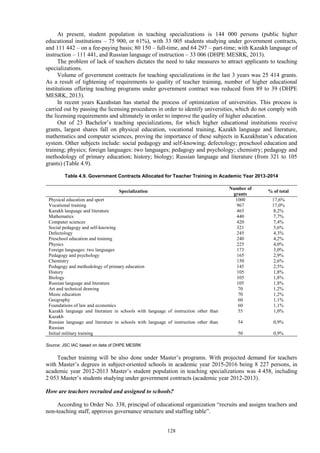
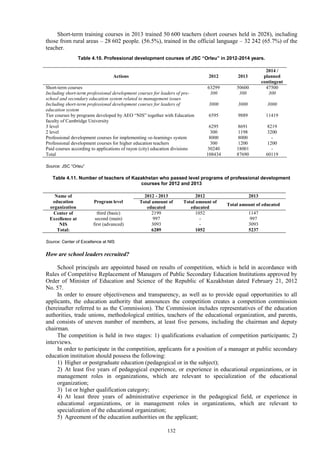
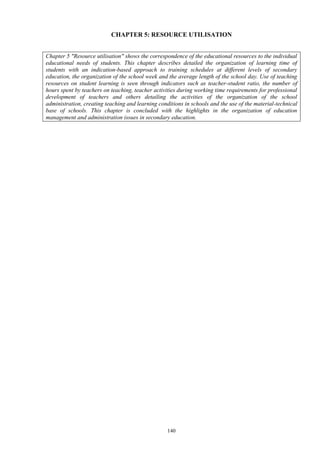
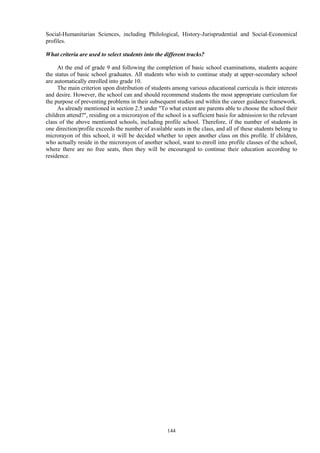
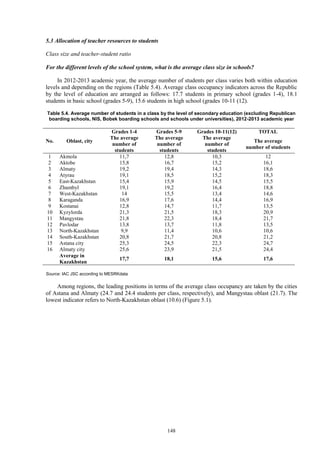
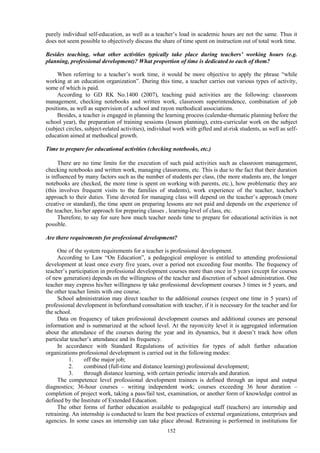
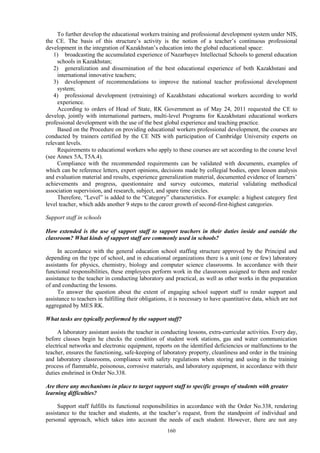
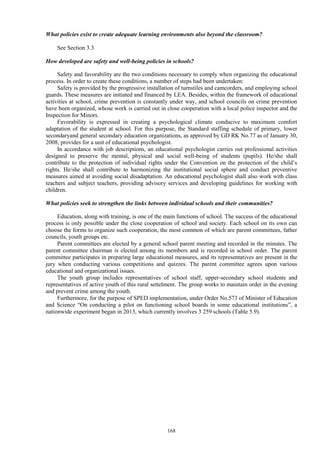
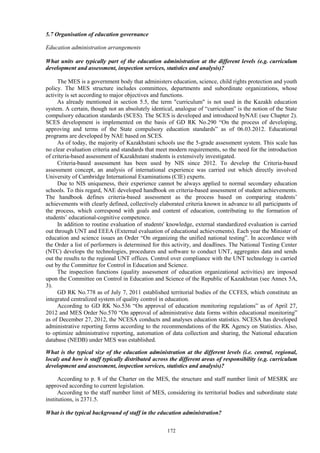
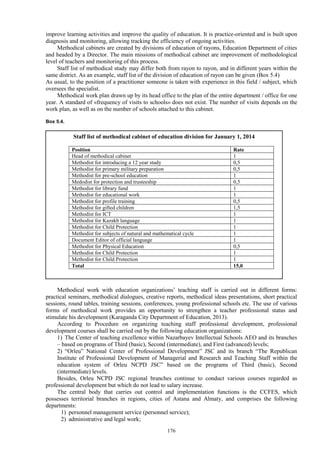
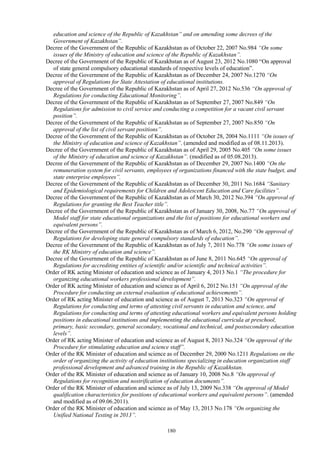
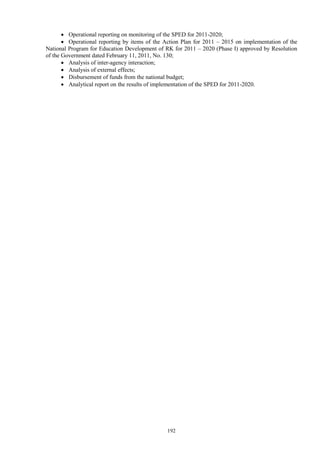
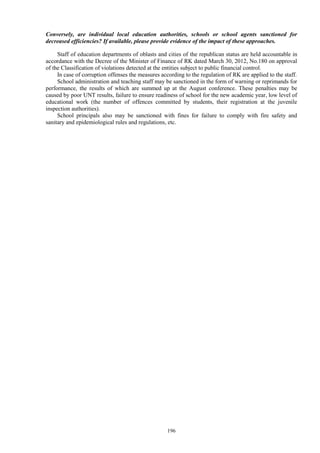
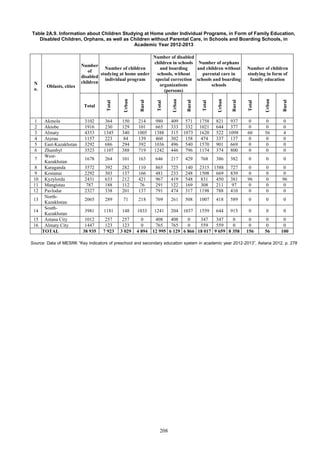
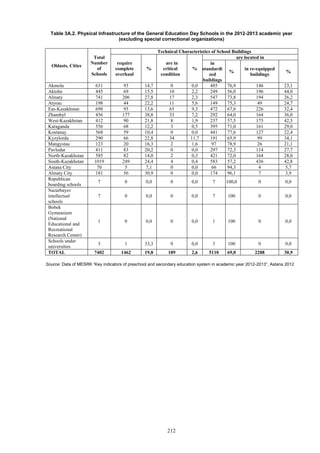
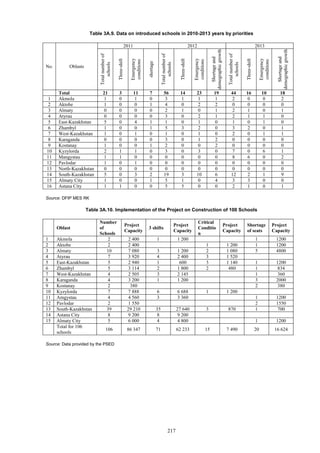
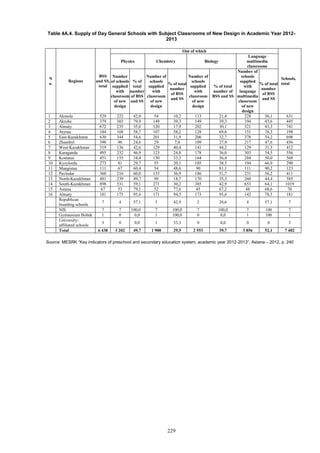
The system of secondary education in the Republic of Kazakhstan is represented by a network of
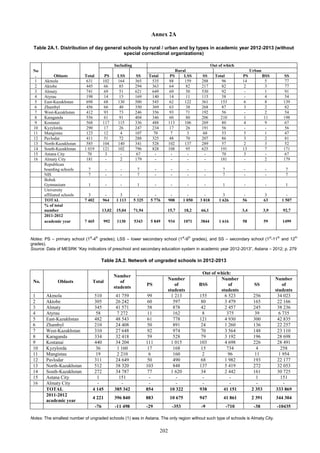
various types of schools (Table 2.1). In academic year 2012-2013, there were 7,698 operating schools,
with 7,589 of them being public and 109 – private. Out of 7,589 public schools, 7,516 were under the
jurisdiction of MES RK and LEA, and 73 were under the jurisdiction of other ministries. Out of 7,516
schools under the jurisdiction of MESRK and local governments, 7,402 were general secondary schools,
and 114 were organizations delivering education programs to children with special needs (special
educational organizations) (MESRK, 2012).
Table 2.1. Number of day general schools in the Republic of Kazakhstan in academic year 2012-2013
No.
Oblasts, cities,
educational
organizations
Total
schools
With breakdown by jurisdiction:
MESRK
ASPE
RK
MIA
RK
MOD
RK
MOH
RK
MLSP
RK
MESR
K
total
Out of which:
General
schools
Special
correction
schools
Schools
for
children
with
deviant
behavior
Private
schools
1 Akmola 646 638 631 5 0 2 1 6 1
2 Aktobe 458 455 445 5 0 5 2 1
3 Almaty 761 755 741 7 0 7 1 3 2
4 Atyrau 205 203 198 3 0 2 2
5 East-Kazakhstan 738 723 698 16 2 7 2 10 2 1
6 Zhambyl 465 462 456 4 1 1 3
7 West-Kazakhstan 419 417 412 3 0 2 1 1
8 Karaganda 583 574 556 10 0 8 1 8
9 Kostanai 584 579 568 7 0 4 5
10 Kyzylorda 297 296 290 3 1 2 1
11 Mangistau 133 132 123 5 1 3 1
12 Pavlodar 426 422 411 8 1 2 1 3
13 North-Kazakhstan 601 596 585 8 0 3 1 4
14 South-Kazakhstan 1 042 1039 1019 12 1 7 3
15 Astana City 86 83 70 1 0 12 1 1 1
16 Almaty City 236 233 181 9 1 42 2 1
Republican
boarding schools 7 7 7
NIS 7 7 7
Bobek
Gymnasium 1 1 1
University
affiliated schools 3 3 3
TOTAL 7 698 7 625 7 402 106 8 109 11 54 1 6 1
Notes:
4
Paragraph 49, Article 1](https://image.slidesharecdn.com/cbrkazakhstanenglishfinal-150416080802-conversion-gate02/85/Country-Background-Report-for-Kazakhstan-OECD-review-36-320.jpg)


![200
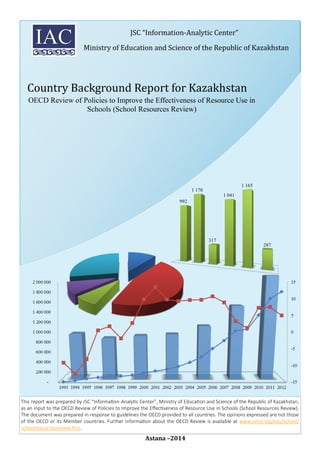
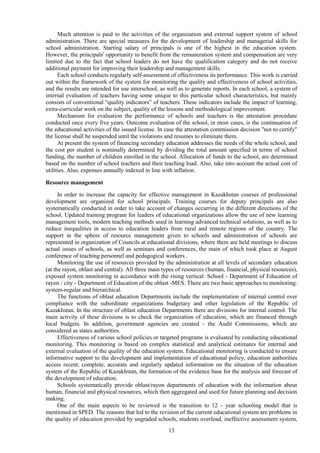
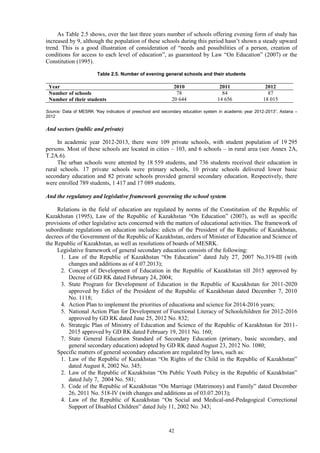
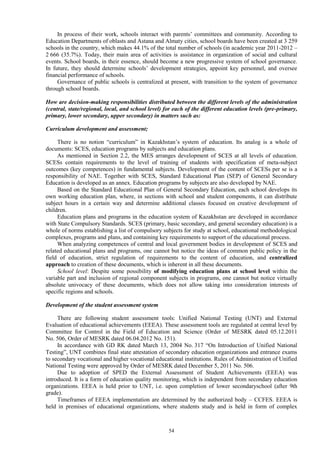
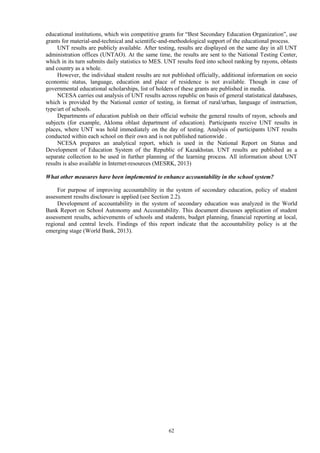
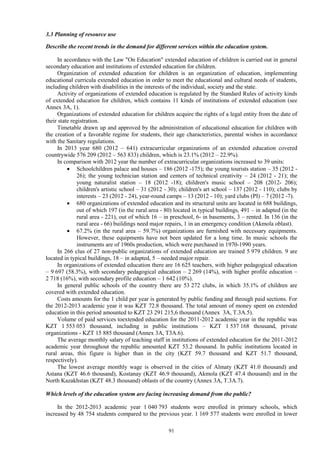
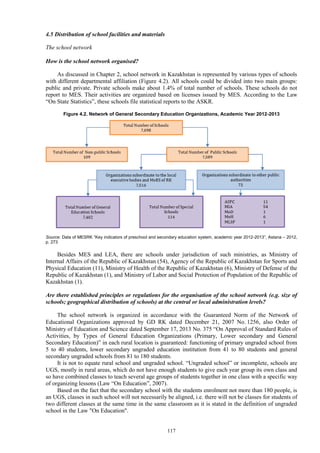
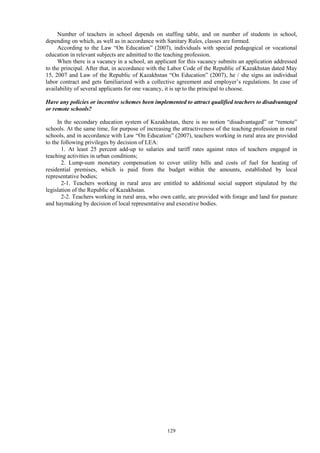
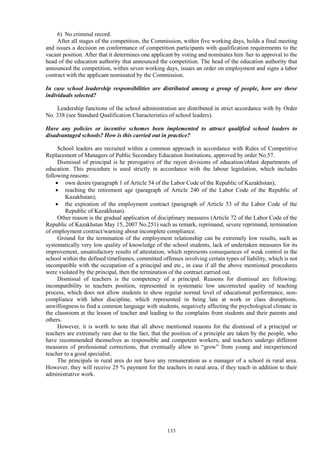
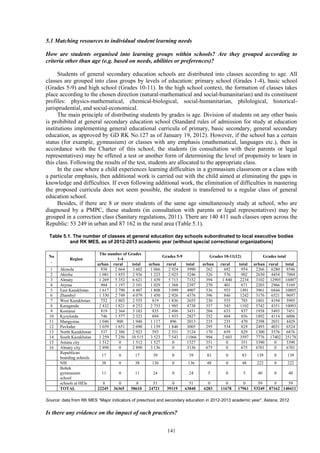
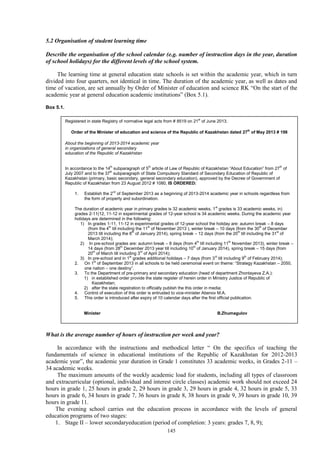
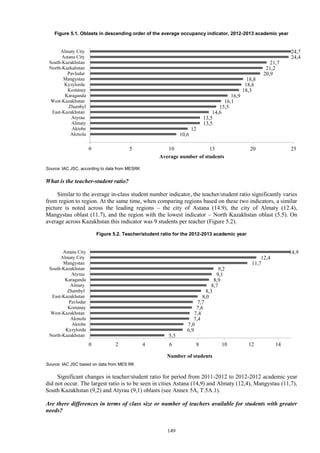
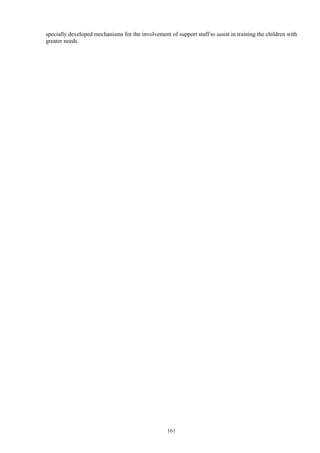
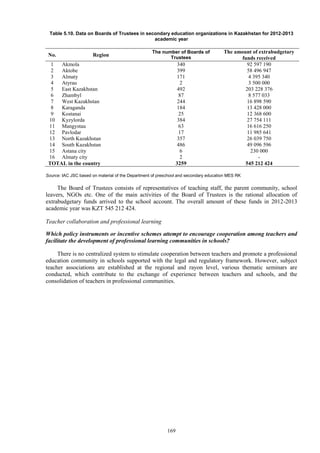
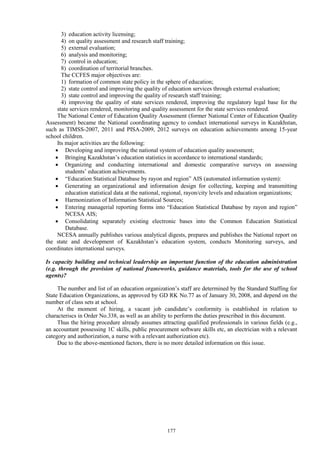
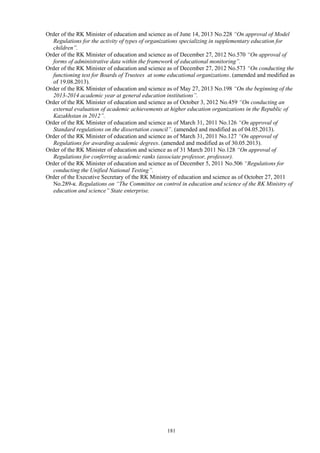
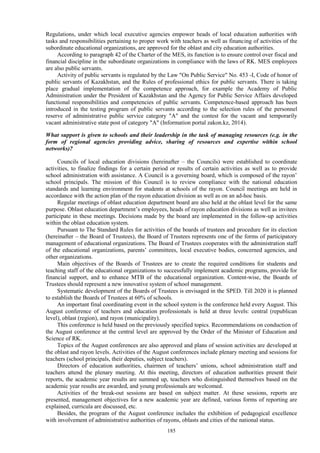
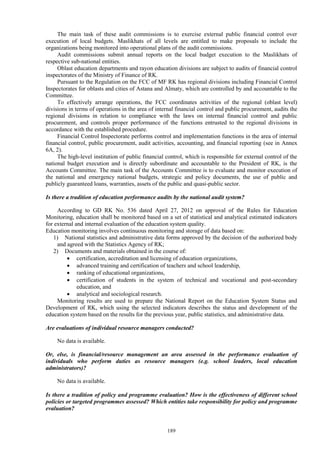
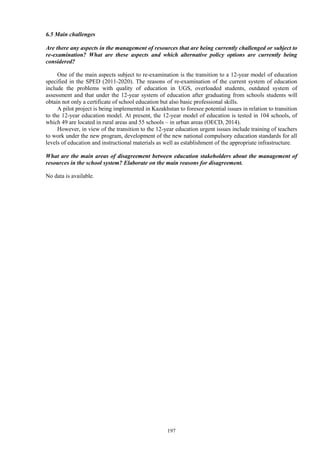
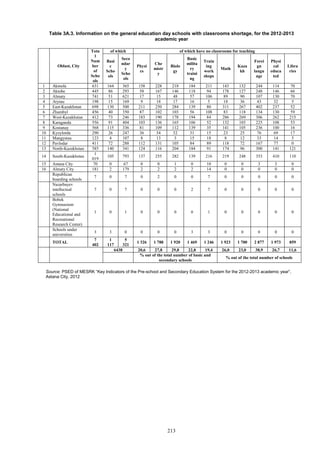
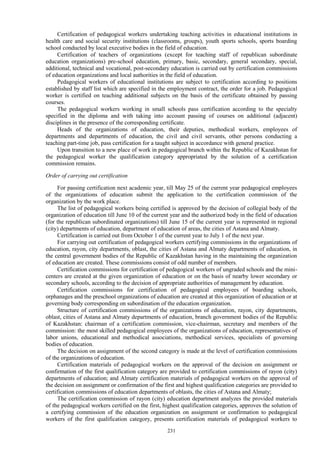
Annex 1A
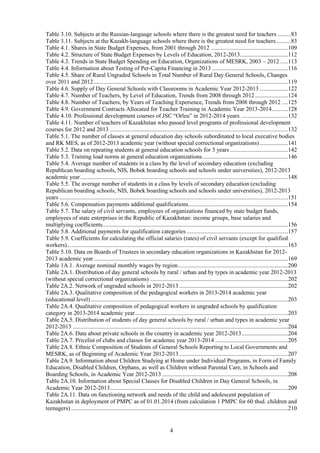
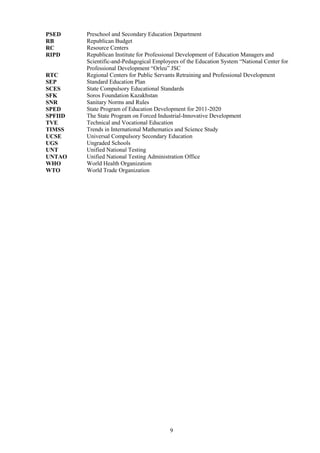
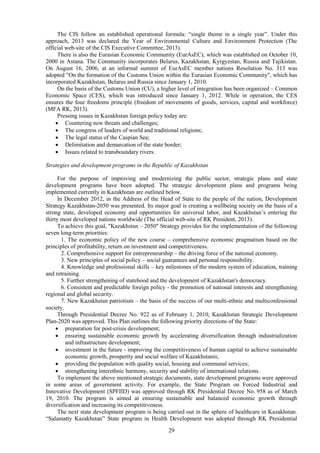
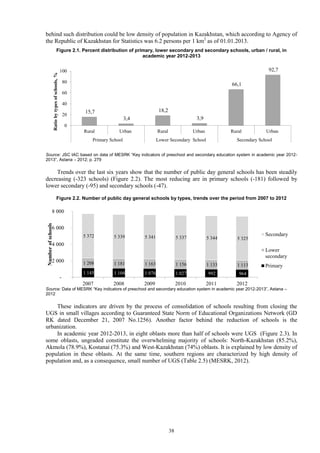
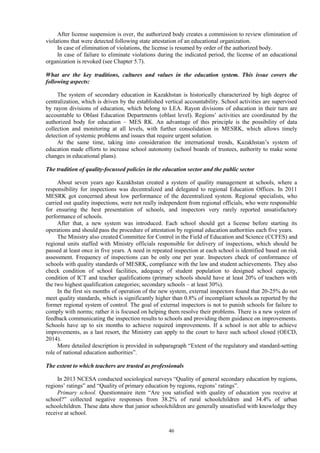
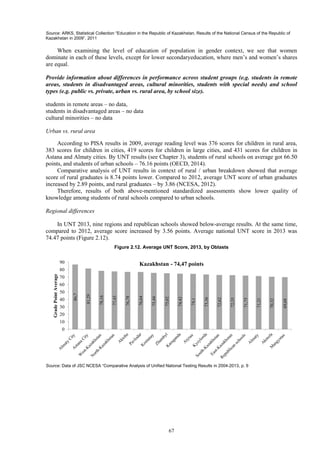
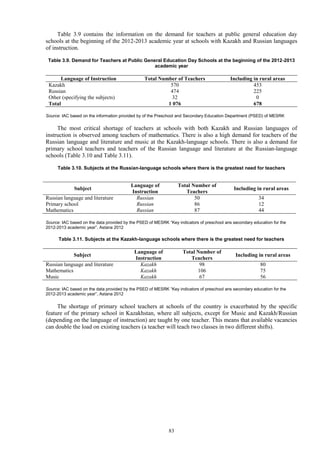
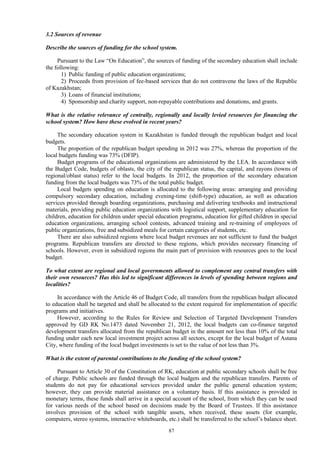
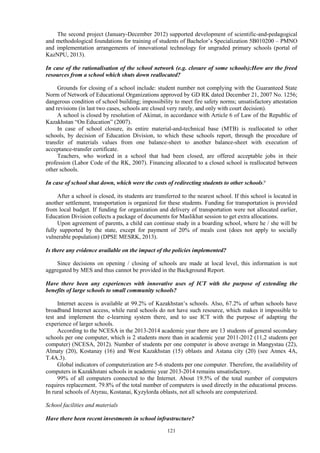
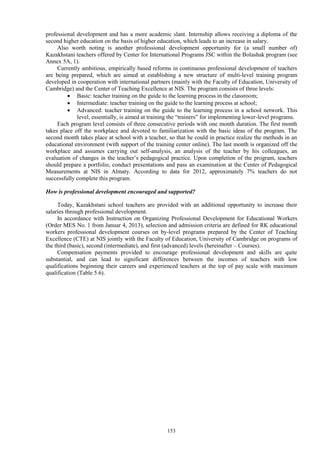
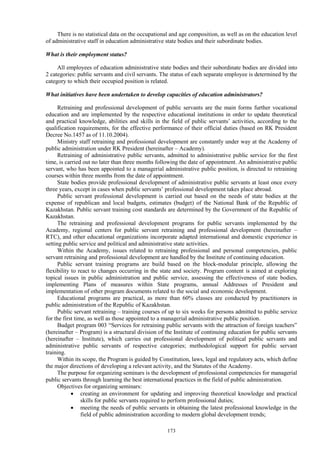
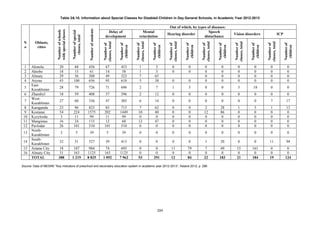
Table 1A.1. Average nominal monthly wages by region
2008 2009 2010 2011 2012
The Republic of Kazakhstan 60 805 67333 77611 90028 101 263
Akmola 41 944 47794 54557 64495 74 685
Aktobe 56 090 60375 69726 79878 90 241
Almaty 44 327 49715 58430 67638 77 320
Atyrau 111 023 129009 148310 165975 180 406
West Kazakhstan 59 362 69455 80101 87503 90 728
Zhambyl 37 546 43951 51340 61825 72 296
Karaganda 53 472 57611 66539 77940 92 382
Kostanai 43 903 49130 57268 67252 76 647
Kyzylorda 53 333 60227 69753 81518 93 361
Mangistau 98 743 112907 133148 151041 157 358
South Kazakhstan 41 679 48610 57545 67721 75 467
Pavlodar 52 227 56113 64955 75338 85 844
North Kazakhstan 39 790 45755 51689 61712 68 921
East Kazakhstan 48 293 53496 61388 73677 84 872
Astana city 89 631 98864 110838 132612 148 287
Almaty city 90 239 95139 106597 121674 134 378
Source: The official web-site of SARK
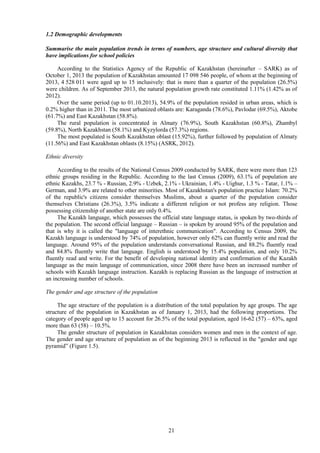
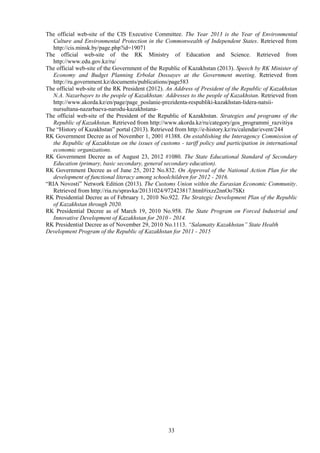
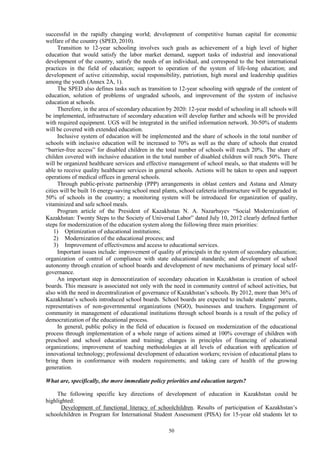
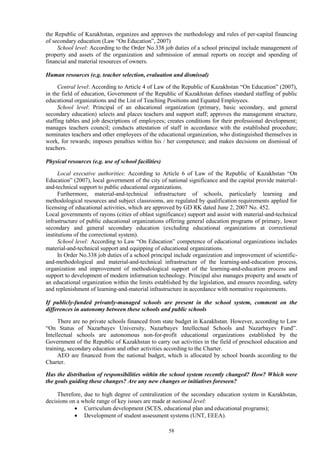
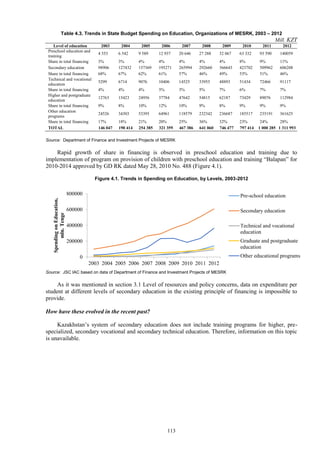
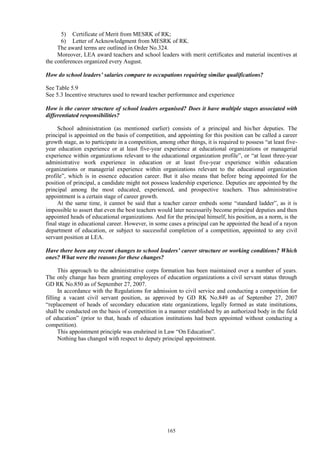
[1] The basis of the educational policy is formed by Law of the Republic of Kazakhstan "On Education" as of
July 27, 2007 No.319-III and Law of the Republic of Kazakhstan "On Science" as of February 18, 2011
No. 407-IV.
The guidelines are:
1. The State Programme for Education development of the Republic of Kazakhstan for 2011-2020,
approved by Presidential Decree as of December 07, 2010 No.1118;
2. The Strategic plan of the Ministry of Education and Science of the Republic of Kazakhstan for 2011
- 2015. Annex to GD RK as of February 19, 2011 No.160;
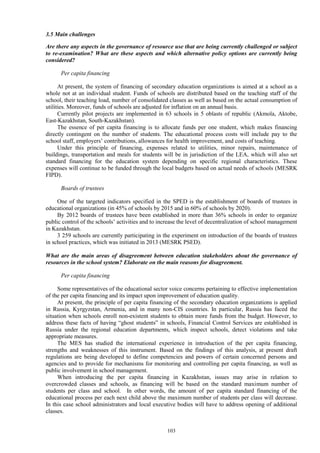
3. The State General Compulsory Standard in Education of the Republic of Kazakhstan.
4. The National Action Plan for the development of schoolchildren’s functional literacy for 2012 -
2016, as approved by GD RK as of June 25, 2012 No.832;
5. The Education Development Concept of the Republic of Kazakhstan until 2015.
[2] As a result of implementing the State Programme on Health Development, Kazakhstan should reach the
following key indicators:
increase in life expectancy of the population to 69.5 years by 2013, and 70 years – by 2015;
reducing maternal mortality to 28.1 by 2013, and to 24.5 per 100 thousand live births by 2015;
reducing infant mortality to 14.1 by 2013, and to 12.3 per 1,000 live births by 2015;
reducing overall mortality to 8.14 by 2013, and to 7.62 per 1,000 population by 2015;
reducing tuberculosis incidence to 98.1 by 2013, and to 94.7 per 100 thousand population by 2015;
retaining HIV prevalence in the 15-49 age group within the range of 0.2-0.6%.
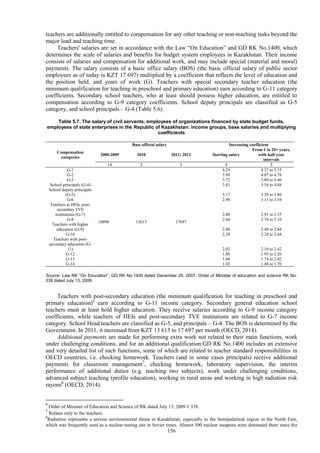
[3] As a result of implementing the State Program of Education Development for 2011-2020, Kazakhstan
should achieve the following key indicators (The official web-site of RK President, 2013):
the per capita financing mechanism should be implemented throughout all educational organizations,
except ungraded schools;
the share of highly qualified educational workers with the highest and first categories, out of the total
number of teachers, will constitute 52%;
90% secondary education institutions will use an E-learning system;
100% children aged 3-6 will be provided with preschool training and care;
full transition to the 12-year education system will be complete;
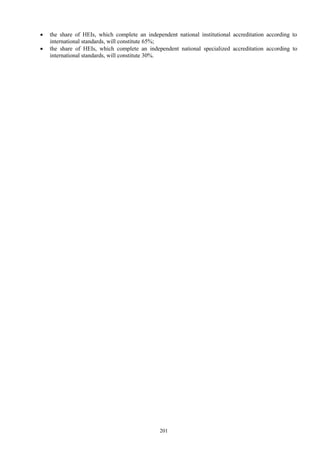
80% HEI graduates, who complete their studies under the State Order, will be employed according to
their specialty within the first year following HEI graduation;
the best worldwide university rankings will include at least 2 HEIs from Kazakhstan;](https://image.slidesharecdn.com/cbrkazakhstanenglishfinal-150416080802-conversion-gate02/85/Country-Background-Report-for-Kazakhstan-OECD-review-201-320.jpg)
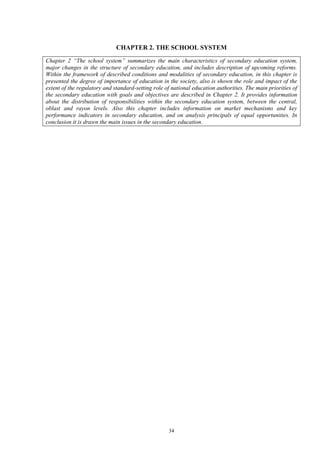
![205
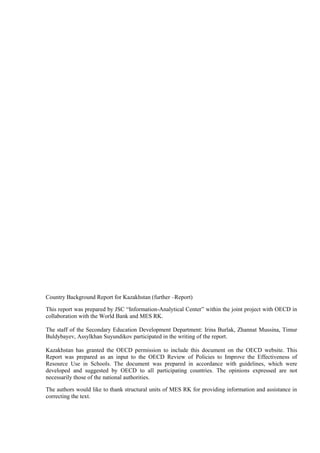
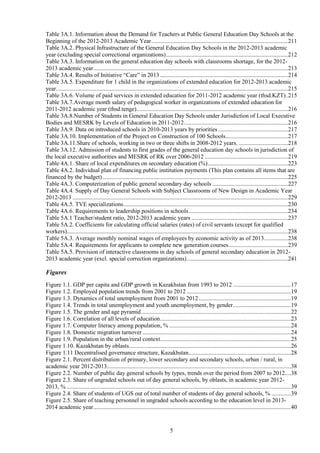
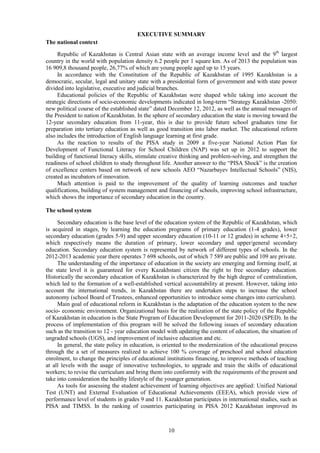
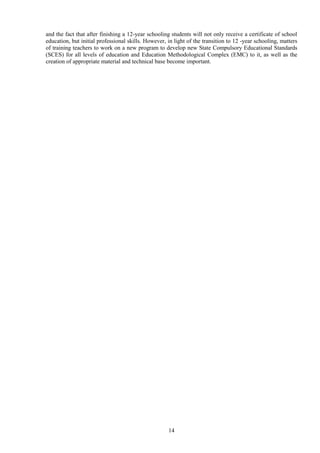
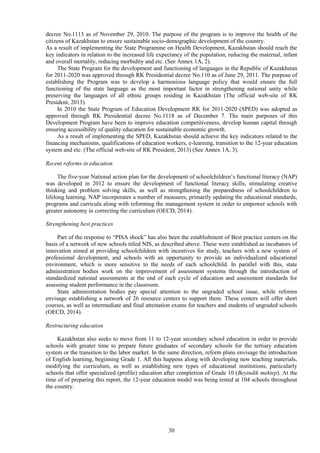
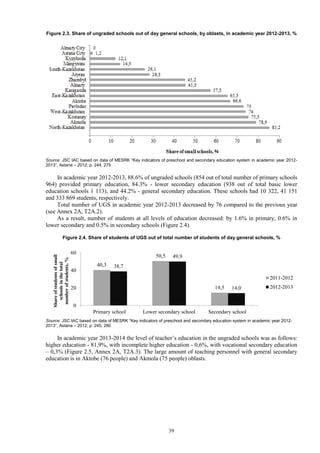
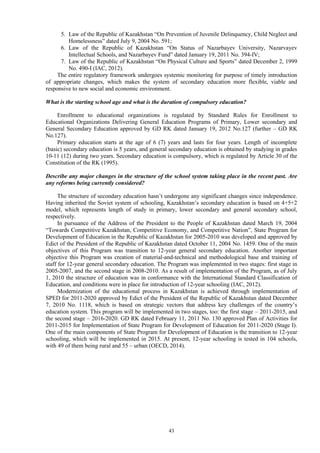
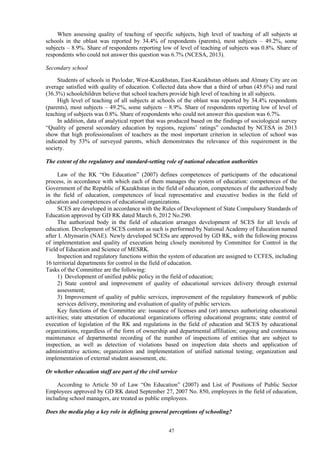
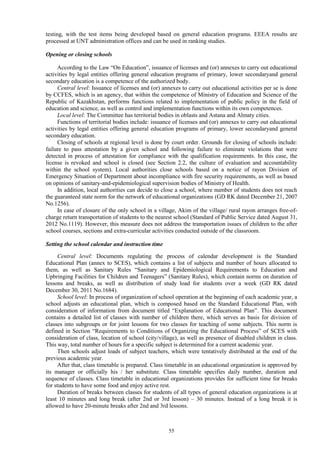
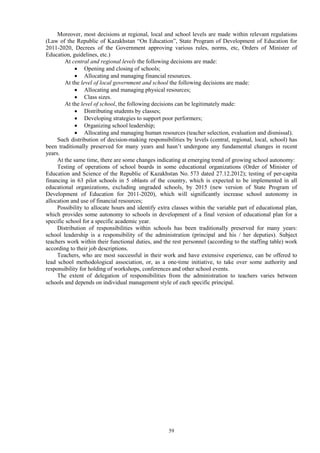
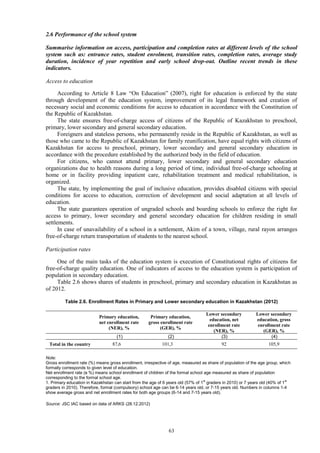
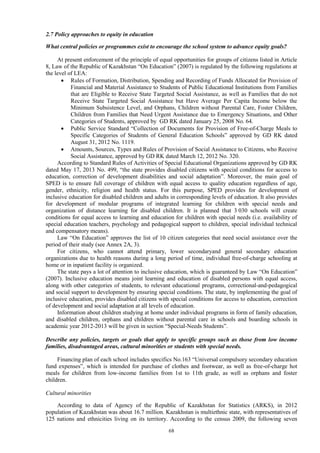
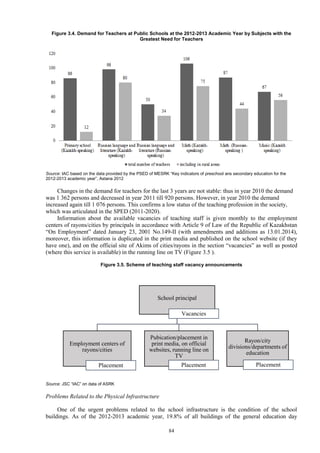
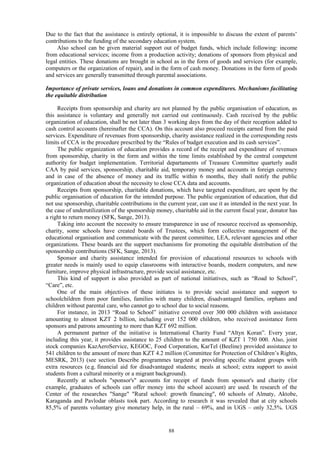
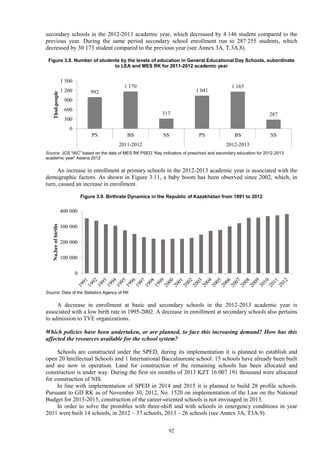
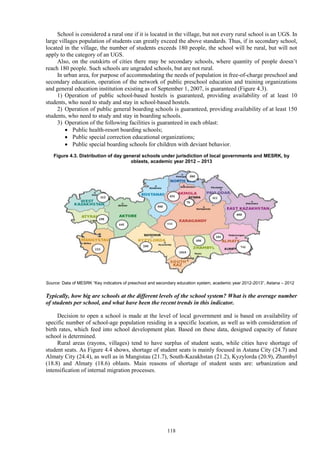
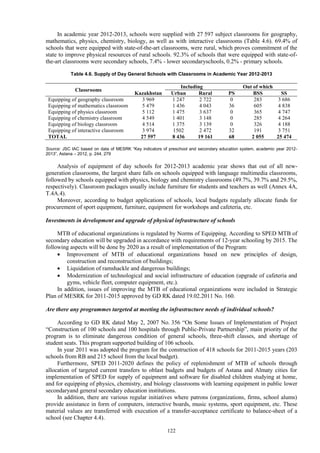
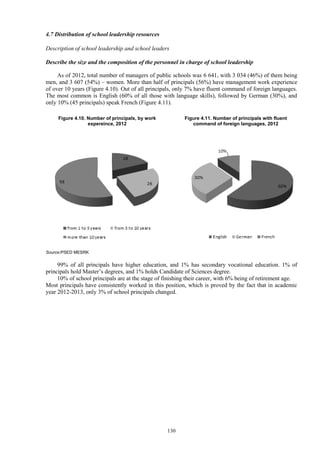
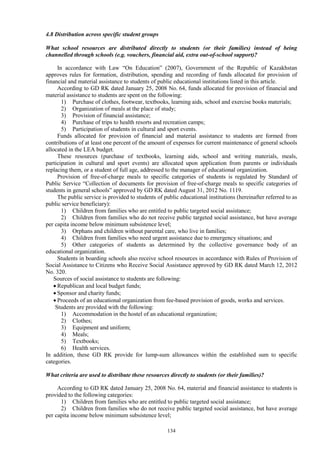
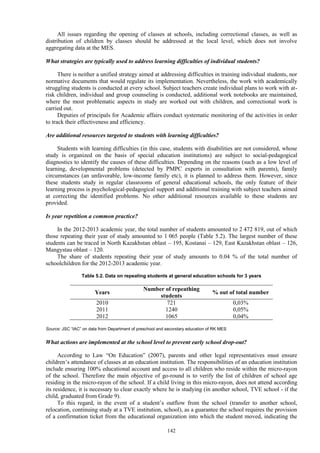
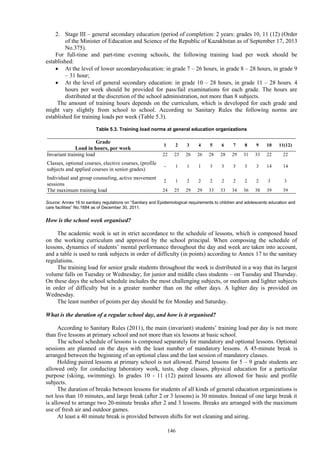
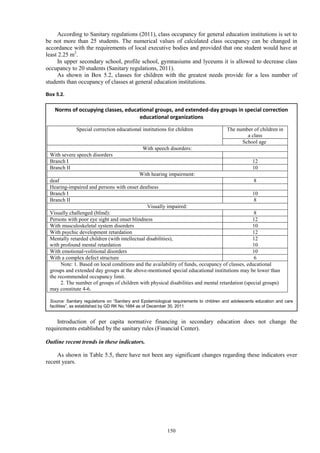
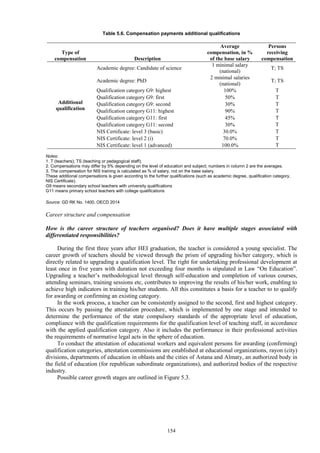
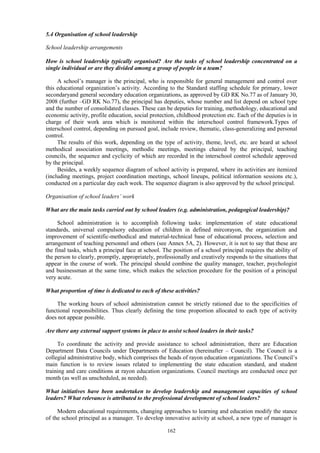
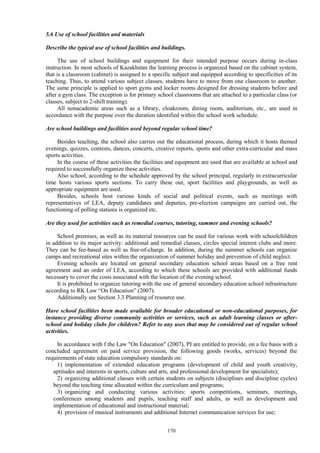
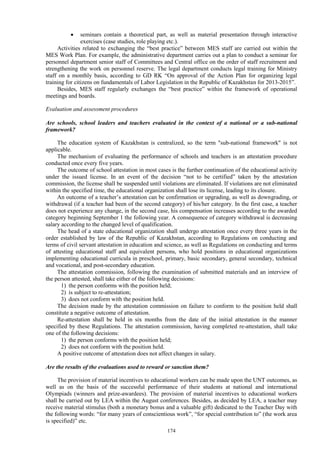
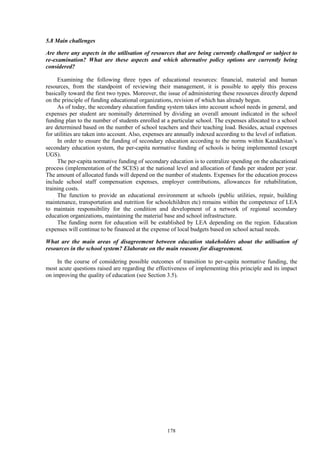
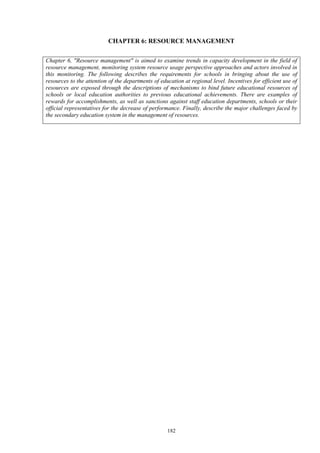
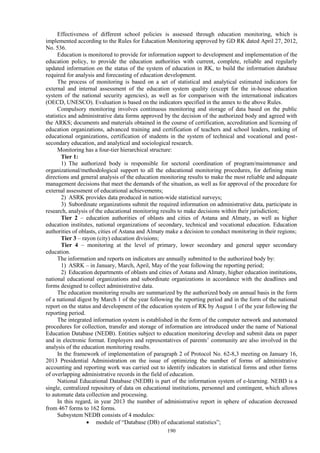
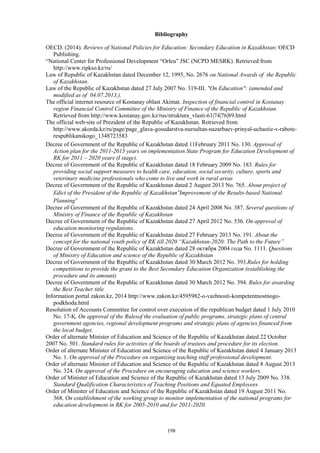
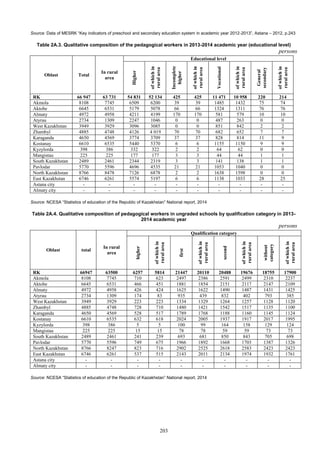
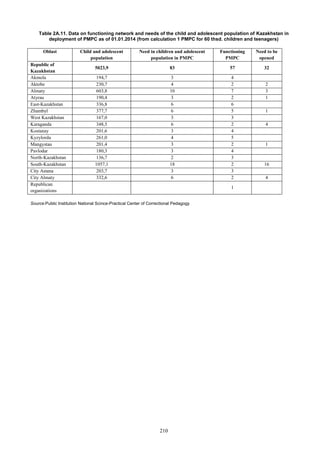
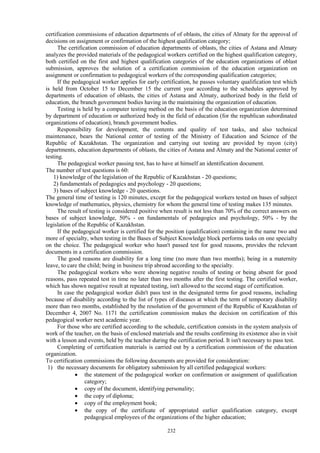
Table 2A.7. Pricelist of clubs and classes for academic year 2013-2014
Services Age Price / month,
Tenge
Services Age Price / month, Tenge
Natural Sciences IT
Mathematics 1-11 grades 5000
“Young Florist” 6-15 years
old
Free of charge Computer Graphics 7-17 years old 5000
“Young Naturalist” 6-17 years
old
Free of charge Internet courses 11-17 years old 5000
Research Chemist 8-11 grades Free of charge Programming Languages 12-17 years old 5000
Biotechnology Nextbio 5-11 grades Free of charge Artifical Intelligence 12-17 years old 5000
Technical Creativity Linguistics
Ship Modeling 5-7 grades Free of charge Kazakh 1-11 grades Free of charge
School of Young Astronauts 1-4 grades Free of charge French 1-11 grades 5000
Nanotechnology 7-11 grades Free of charge Turkish 1-11 grades 5000
Physics 8-11 grades 5000 Chinese 1-11 grades 5000
Radio Electronics 7-11 grades Free of charge Russian 1-11 grades 5000
Robotics 7-11 grades Free of charge English 1-11 grades 5000
Model Car Construction 4-6 grades Free of charge Young Poets School 6-17 years old Free of charge
Arts Media Center
Arts 5-17 years
old
5000 Journalism 11-17 years old 5000
Applied and Decorative Arts 6-11 years
old
5000 Photo Editing 10-17 years old 5000
Modern Design 6-17 years
old
5000 Video Editing 10-17 years old 5000
Graphic Design 10-17 years
old
5000 TV Presenter 10-17 years old 5000
Architecture Design 11-17 years
old
5000 Animated Film 6-17 years old 5000
Theater Arts Choreography
Oratory Skills Studio 7-17 years
old
5000 Ballroom and Sport Dances 6-17 years old 7000
Theater Arts 6-17 years
old
5000 Modern Dances (hip hop) 6-16 years old 7000
Art Fashion, Design Musical Instruments
Crafts 8-16 years
old
5000 Flute 6-17 years old 5000
Fundamentals of Modeling 6-16 years
old
5000 Dombra 7-17 years old 5000
Hair Styling 14-17 years
old
5000 Saxophone 12-17 years old 5000
Makeup 12-17 years
old
5000 Singing 6-17 years old 5000
Sports
Boxing 8-17 years old 5000
Hockey 6-17 years old 7000
Basketball 8-17 years old 3000
Judo 6-17 years old 5000
Togyz-kumalak 6-17 years old Free of charge
Chess 6-17 years old 5000
Track-and-field 8-17 years old Free of charge
Field Hockey 8-14 years old 3000
Preschool training (English,
Choreography, Arts)
5-6 years old 25000
Source: City Children’s Palace, Astana, 2013
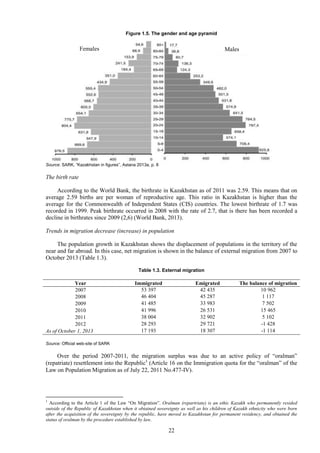
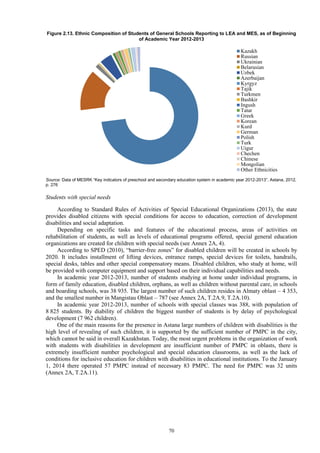
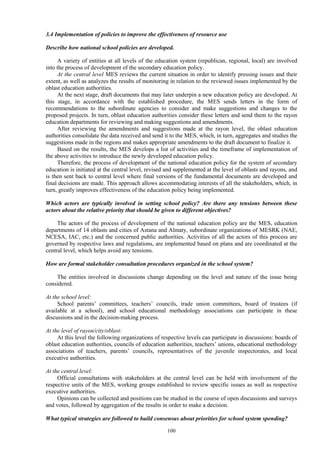
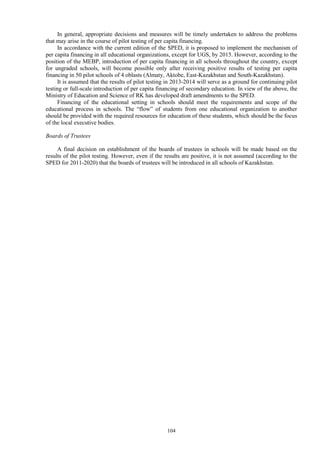
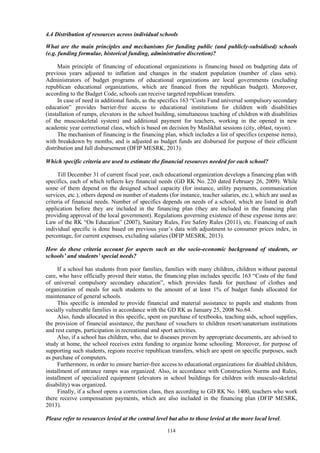
[1] The goals and indicators of the SPED for 2011-2020.
SPED for 2011-2020 provides for planned growth, over the period from 2010 to 2020, of such target
indicators as implementation of per-capita financing, increase in the share of highly qualified teachers, creation
of school boards at educational organizations, professional development and retraining in the field of
management for managers of educational organizations, application of e-learning system at educational
organizations, coverage of children aged 3 to 6 years old with preschool education and training, full transition to
12-year model of schooling, achievement of a specific number of Nazarbayev Intellectual Schools in all regions
of Kazakhstan, increase in the share of students who successfully completed educational programs on
mathematical and natural sciences, improvement of results in Programme for International Student Assessment
(PISA), Trends in International Mathematics and Science Study (TIMSS), Progress in International Reading
Literacy Study (PIRLS), and increase in the share of schools that created conditions for inclusive education
(State Program of Development of Education, 2010).
The following tasks were identified as necessary for achievement of the established goals:
Development of new mechanisms for financing of education with focus on improvement of quality and
access to education;
Supply of the education system with highly qualified staff;
Strengthening of state support and encouragement of teachers’ performance;](https://image.slidesharecdn.com/cbrkazakhstanenglishfinal-150416080802-conversion-gate02/85/Country-Background-Report-for-Kazakhstan-OECD-review-206-320.jpg)
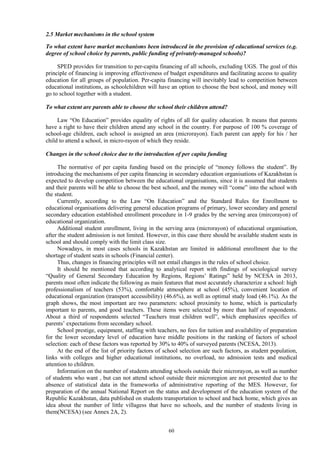
![206
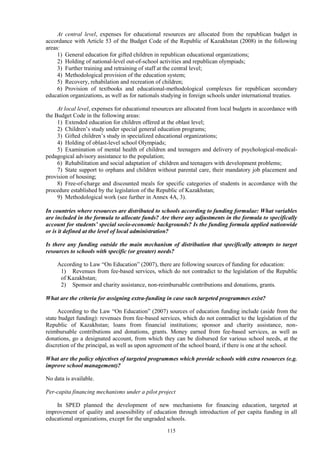
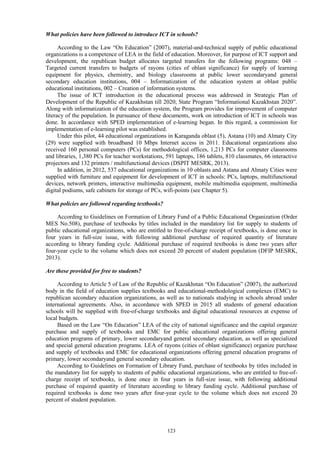
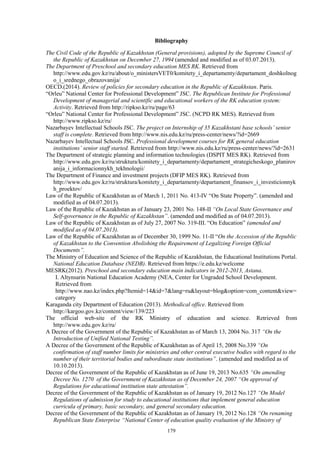
Improvement of management in education, including implementation of principles of corporate
governance, and development of public-private partnership in education;
Improvement of the system of monitoring of development of education, including creation of national
educational statistics based on international requirements;
Creation of conditions for computerization of the learning process;
Expansion of the network of preschool education;
Upgrade of the content of preschool education and training;
Supply of staff to preschool education and training organizations;
Transition to 12-year schooling with upgrade of the content of education;
Addressing the problem of ungraded schools;
Improvement of the system of inclusive education at schools; training of highly qualified scientific and
scientific-and-teaching staff;
Creation of conditions for life-long learning and education for all; and
Implementation of a set of actions on patriotic education and development of active citizenship, social
responsibility and mechanisms for unlocking the youth’s potential.
For purpose of accomplishment of these tasks, improvement of a whole range of indicators is planned.
The Program defines key areas, ways of achievement of the established program goals and corresponding
actions.
Development of education will focus on the following areas: financing of the system of education;
teachers’ status; management in education; e-learning; preschool education and training; secondary education;
educational work and youth policy.
SPED contains a goal related to secondary education: development of intellectually, physically and
spiritually developed citizens of the Republic of Kazakhstan at general schools and satisfaction of their needs in
education that would make them successful in the rapidly changing world; development of competitive human
capital for economic welfare of the country; and transition to 12-year schooling.
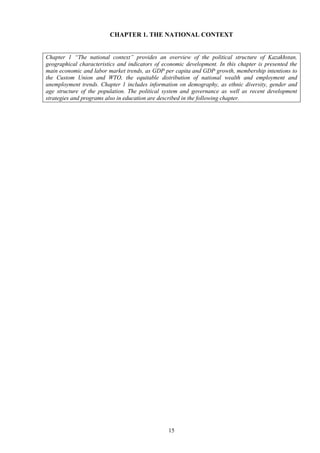
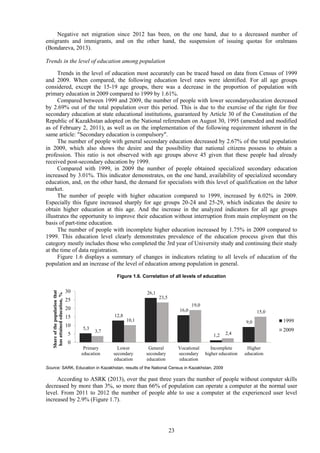
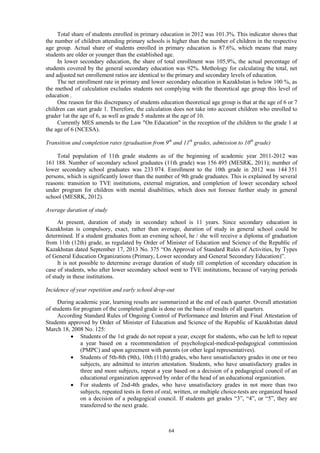
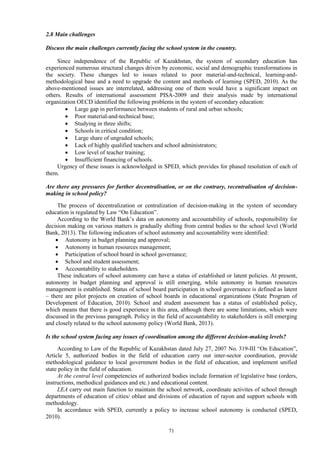
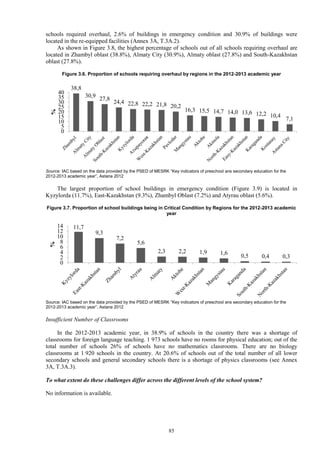
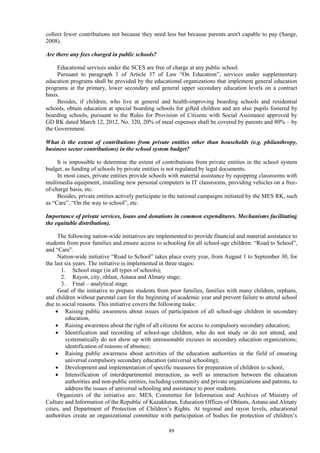
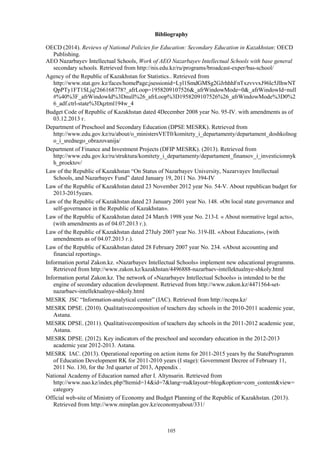
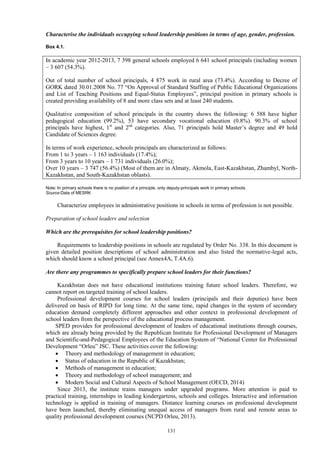
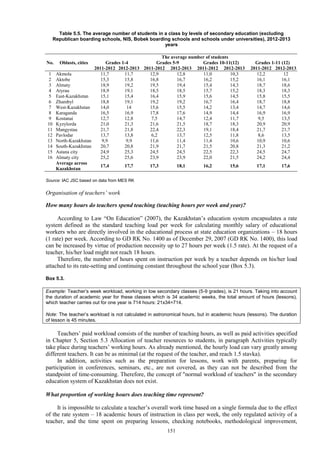
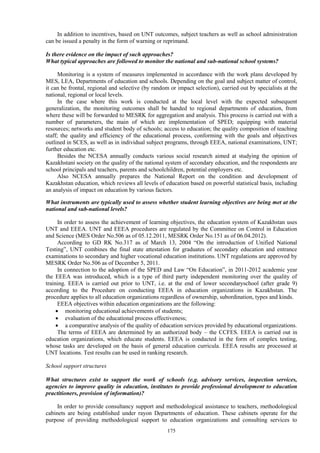
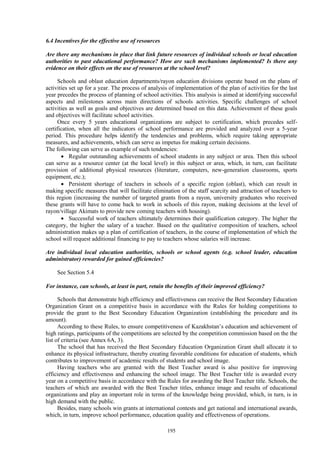
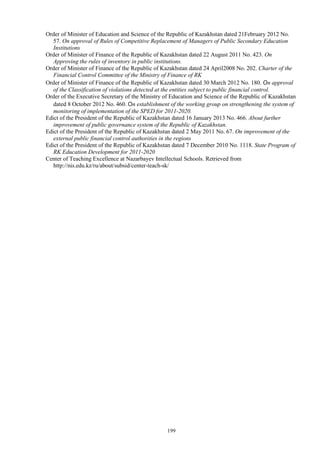
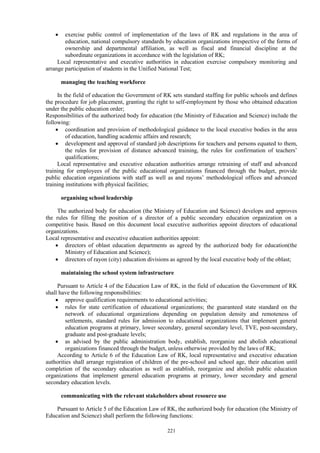
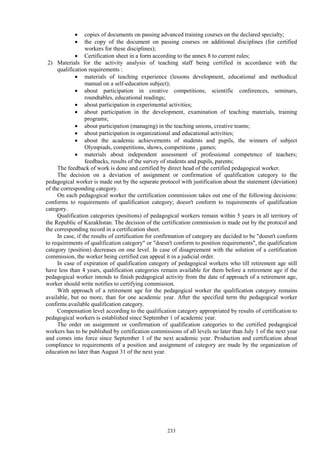
[2] “In 2012, the number of little villages/settlements that have no schools amounted 1 590. The number of
school- aged children living in these settlements were 38 817 children. From this total amount 2 969 students
were arranged in boarding schools, 26 738 students were supplied with transportation, 1 159 students lived with
their relatives, 192 students lived in apartments, 3 749 students go to the school by themselves (in Almaty oblast
– 2 869, East Kazakhstan – 495, Kostanay – 168, Zhambyl - 138, Kyzylorda -14, North Kazakhstan - 65) and 10
students cannot be trained due to the health problems” (National report, NCESA, data for 2012-2013 academic
year).
[3] According to the Article 8 of Law of the Republic of Kazakhstan “On Education” (2007) the list of 10
citizen categories approved that need social assistance over the period of their study:
1) Orphans, children without parental care;
2) Disabled children, disabled persons, lifelong disabled;
3) Children from large families;
4) Children placed in centers of temporary isolation, adaptation and rehabilitation of under-age children;
5) Children residing in general and health-resort boarding schools, school-affiliated boarding schools;
6) Children who are brought up and study in specialized boarding schools for gifted children;
7) Students of boarding schools;
8) Children from families that are eligible to receive state targeted social assistance, as well as families that
do not receive state targeted social assistance but have average per capita income below the minimum
subsistence level;
9) Children, who due to their health status, for long time study under primary, basic secondary, general
secondary education programs at home or in organizations delivering inpatient care, as well as rehabilitation
treatment and medical rehabilitation;
10) Other categories of citizens as determined by law of the Republic of Kazakhstan.](https://image.slidesharecdn.com/cbrkazakhstanenglishfinal-150416080802-conversion-gate02/85/Country-Background-Report-for-Kazakhstan-OECD-review-207-320.jpg)
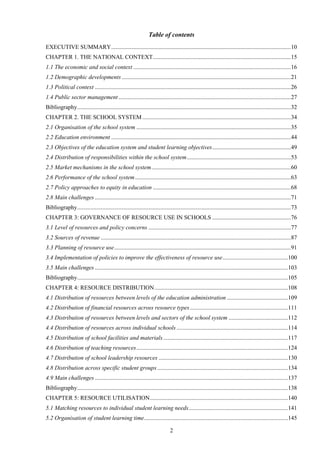
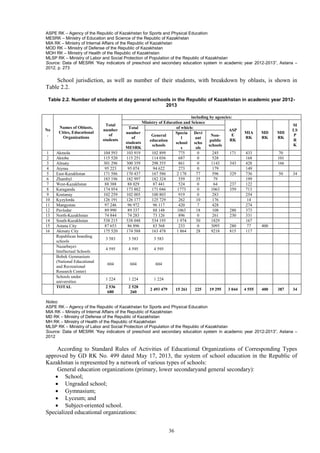
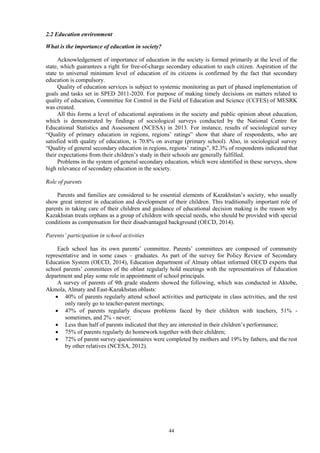
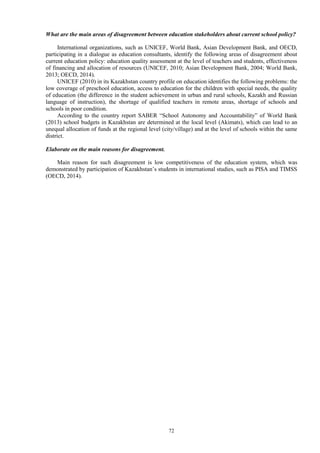
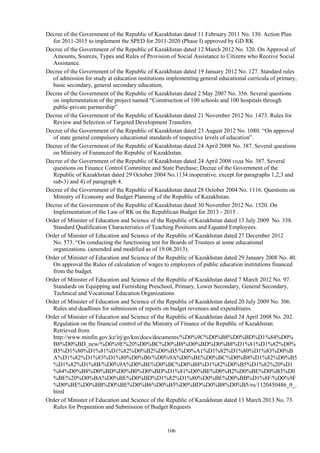
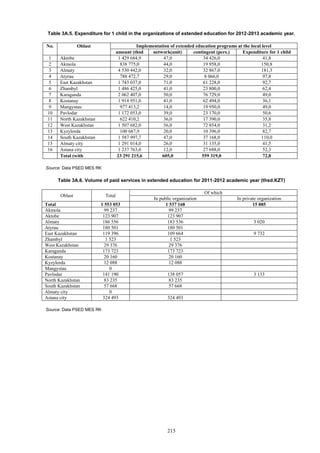
![207
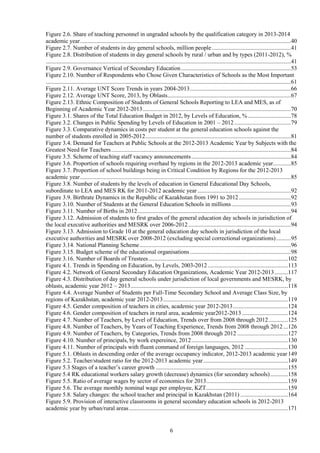
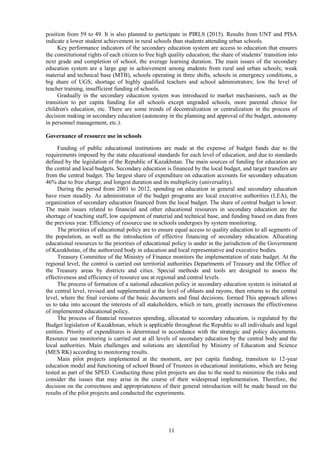
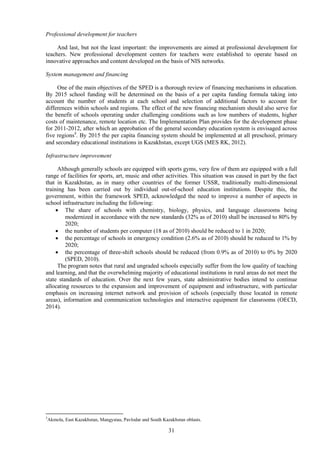
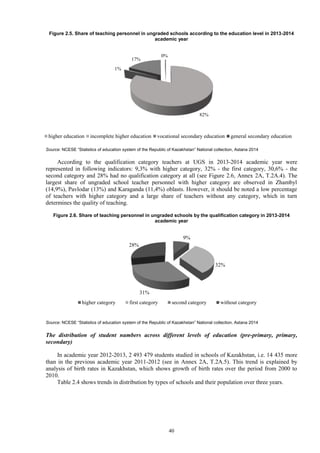
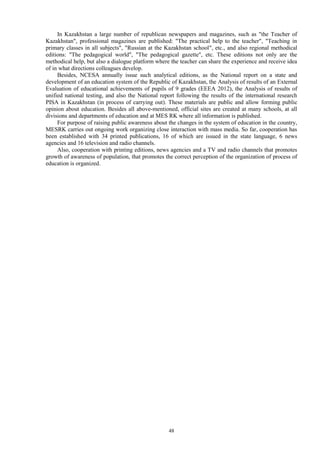
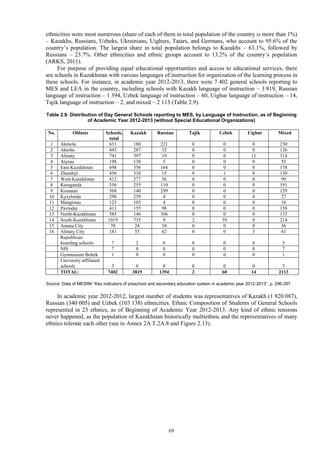
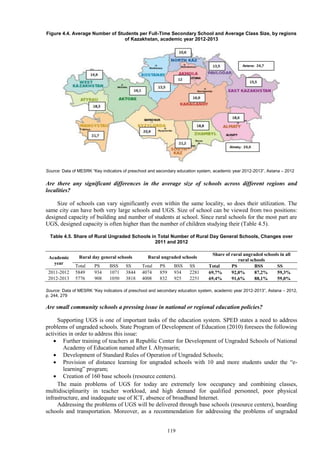
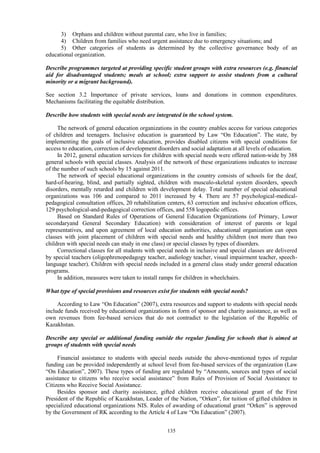
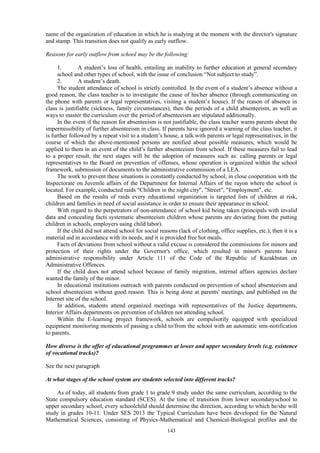
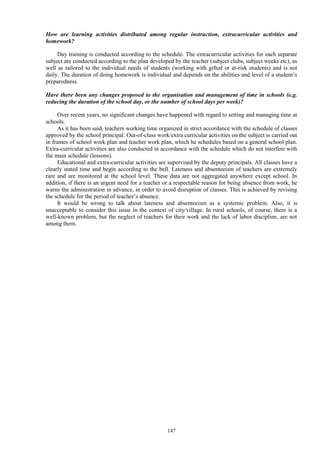
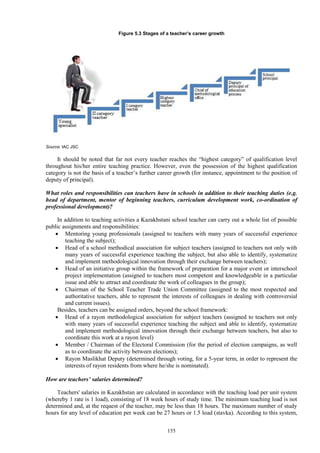
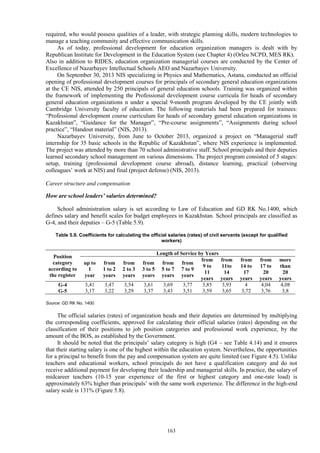
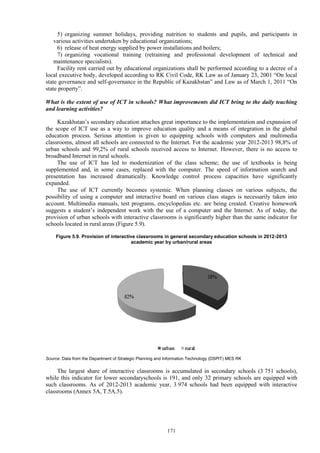
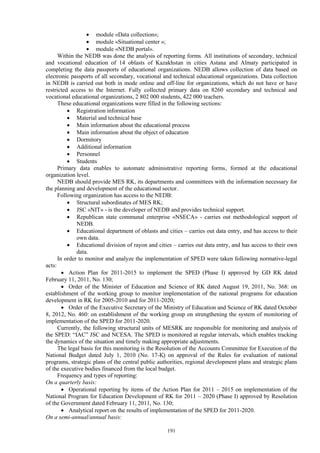
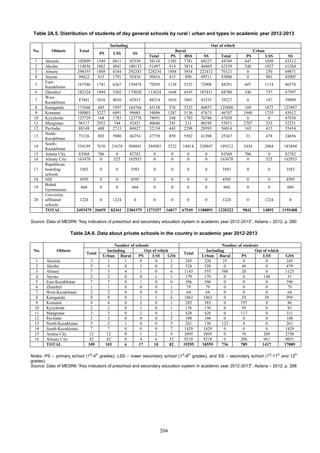
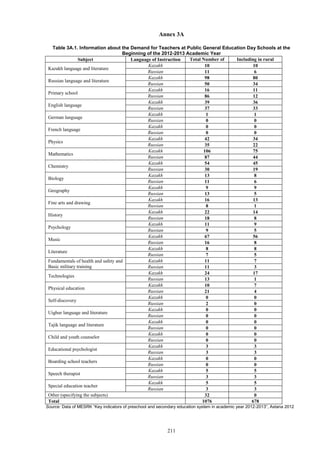
Table 2A.8. Ethnic Composition of Students of General Schools Reporting to Local Governments and MESRK,
as of Beginning of Academic Year 2012-2013
No. Ethnicity Number of students
1 Kazakhs 1 820 087
2 Russians 340 005
3 Ukrainians 32 186
4 Belarusians 6 434
5 Uzbeks 103 138
6 Azerbaijanis 19 574
7 Kyrgyz 4 202
8 Tadjiks 8 721
9 Turkmens 268
10 Bashkirs 1 623
11 Ingush 2 443
12 Tatars 21 381
13 Greek 1 145
14 Koreans 13 756
15 Kurds 7 402
16 Germans 24 883
17 Polish 3 796
18 Turkish 13 456
19 Uighurs 37 742
20 Chechens 5 286
21 Chinese 494
22 Mongols 12
23 Other 25 445
Total 2 493 479
Source: Data of MESRK “Key indicators of preschool and secondary education system in academic year 2012-2013”, Astana, 2012, p. 276
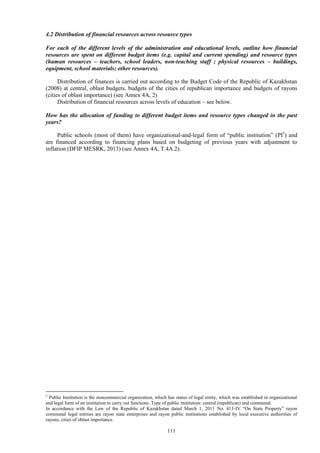
[4] Category of children with special needs:
Hearing disorders (deaf, hard of hearing, late-onset deaf);
Vision disorders (blind, visually impaired, late-onset blind);
Musculo-skeletal patients;
Speech disturbance;
Mental retardation;
Development delay;
Emotional-volitional and behavior disorders;
Complex disorders, including deaf-blindness.](https://image.slidesharecdn.com/cbrkazakhstanenglishfinal-150416080802-conversion-gate02/85/Country-Background-Report-for-Kazakhstan-OECD-review-208-320.jpg)
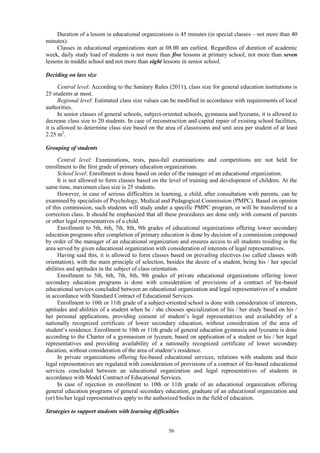
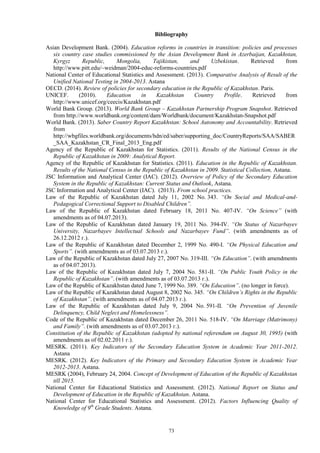
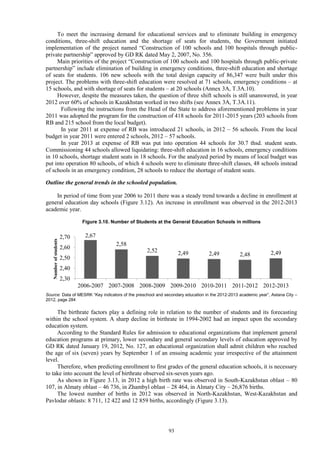
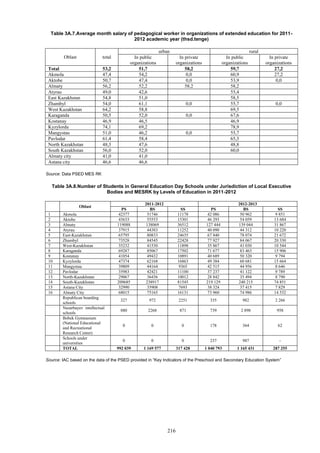
![214
Table 3A.4. Results of Initiative “Care” in 2013
N
o.
Oblasts and
cities
Number
of
children
who
received
material
assistance
Of out of which (persons)
Total
amount of
assistance
(thsd
KZT)
Of out of which (thsd KZT)
From budget funds
Out-of-budget
funds
From budget funds
Out-of-budget
funds
Universal
Schooling
Fund
Other budget
sources
Universal
Schooling
Fund
Other
budget
sources
1 Akmola 7 513 1 527 76 5 910 18 529,8 5 466,0 343,5 12720,2
2 Aktobe 7 791 1 446 0 6 345 29 934,0 8 163,2 0,0 21770,8
3 Almaty 10 541 765 0 9 776 18 887,7 2 380,1 0,0 16507,6
4 Atyrau 5 311 431 352 4 528 9 225,1 1 226,1 61,1 7937,9
5 East-Kazakhstan 19 079 8 531 196 10 352 107 884,0 83 489,8 1356,7 23037,4
6 Zhambyl 14 698 8 032 42 6 624 23 932,5 12 354,0 630,0 10948,5
7 West-Kazakhstan 9 227 4 692 0 4 535 48 764,7 41 283,6 0,0 7481,1
8 Karaganda 15 590 5 307 157 10 126 107 971,2 7 386,4 85440,0 15144,8
9 Kostanai 4 979 276 0 4 703 13 598,2 1 012,7 0,0 12585,5
10 Kyzylorda 6 849 0 0 6 849 20 888,0 ,0 0,0 20888,0
11 Pavlodar 11 263 5 740 895 4 628 26 608,0 18 096,1 2597,7 5914,2
12 Mangistau 2 834 1 282 32 1 520 19 741,0 13 028,6 1013,0 5699,4
13
North-
Kazakhstan
6 059 1 838 0 4 221 10 446,0 4 556,1 0,0 5889,9
14
South-
Kazakhstan
29 332 5 156 466 23 710 70 431,3 43 578,5 3655,0 23197,8
15 Almaty City 3 978 1 859 0 2 119 49 562,5 40 126,8 0,0 9435,7
16 Astana City 3 508 1 580 893 1 035 32 509,0 25 682,9 3937,4 2888,7
Total 158 552 48 462 3 109 106 981 608 912,9 307 831,0 99 034,5 202 047,4
Source: Committee for Protection of Children’s Rights of MESRK
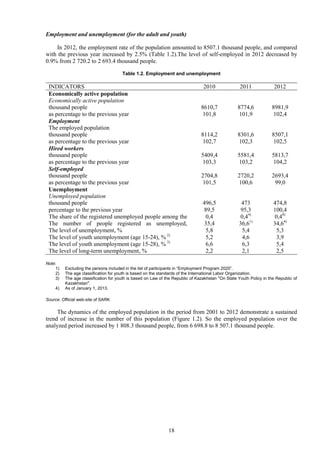
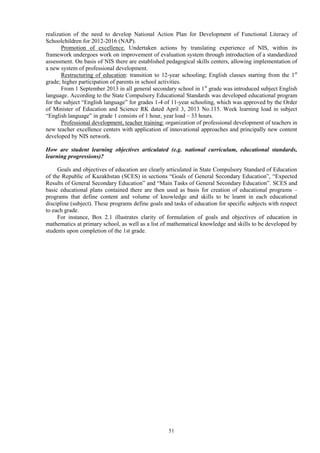
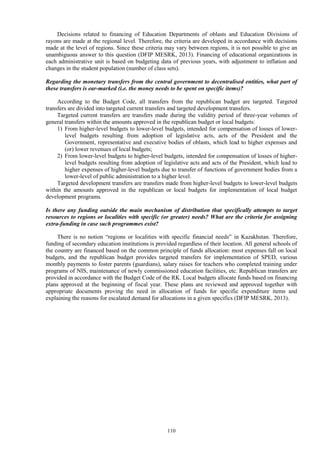
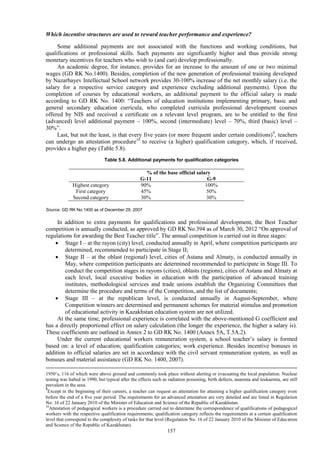
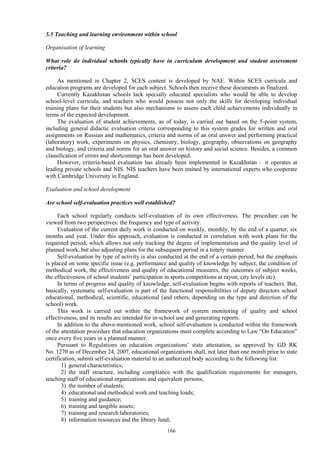
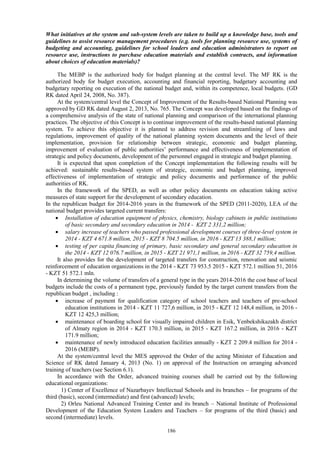
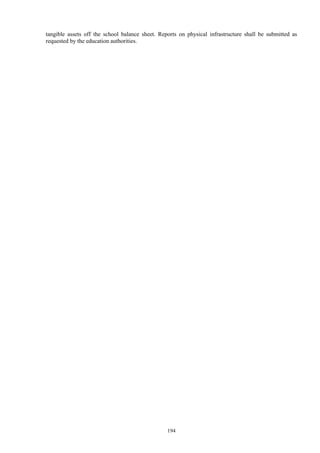
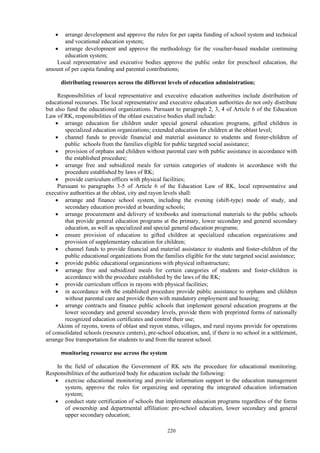
[1] The enabling environment for producing high-quality supplementary education is implemented in
accordance with the Standard regulations of activities related to the types of supplementary education for
children, as approved by Order No.228 of RK Minister of education and science as of June 14, 2013,
according to which, the types of children supplementary education organizations include:
1. An educational center for supplementary education;
2. Schoolchildren Palace (house, center, a complex, youth creativity center);
3. “The Young Naturalist Station” (a children’s environmental center, a biological center, eco- and
bio-center, Children and Youth Centre of Environment and Local History);
4. “The Young Technician Station” (a technical center or school for children and youth);
5. “The Young Tourist Station” (a center for children and youth tourism, Children and Youth Centre
of Environment and Tourism, Children and Youth Centre of Tourism and Local History);
6. Children yard club, children's military and patriotic club (other leisure club organizations);
7. Children arts school (children's music school, children's art school and other artistic and aesthetic
schools);
8. Children recreation camp (a center, complex, country recreational camp, day-stay camp, tent
camp, and yurt camp);
9. Children and youth sports school;
10. Specialized children-youth Olympic reserve school;
11. Other children organizations.](https://image.slidesharecdn.com/cbrkazakhstanenglishfinal-150416080802-conversion-gate02/85/Country-Background-Report-for-Kazakhstan-OECD-review-215-320.jpg)
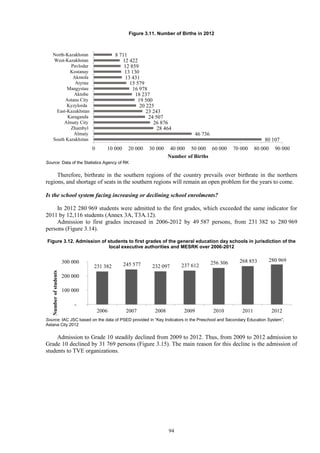
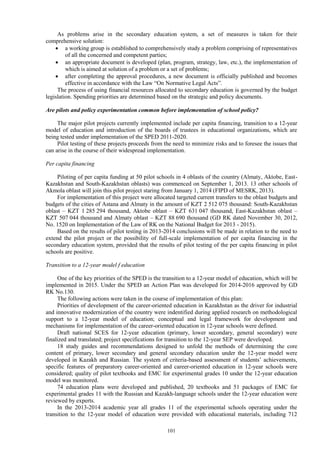
![219
Table 3A.12. Admission of students to first grades of the general education day schools in jurisdiction of the
local executive authorities and MESRK of RK over 2006-2012
Oblast
Years
2006 2007 2008 2009 2010 2011 2012
1 Akmola 10390 11288 10950 10378 11226 10846 10786
2 Aktobe 10891 10627 10152 10162 11190 12099 12804
3 Almaty 26463 30426 27253 27881 30798 32837 35467
4 Atyrau 8770 8952 8820 9134 9820 10149 11067
5 East-Kazakhstan 17606 17936 16218 16301 17263 18068 18492
6 Zhambyl 17159 17698 17199 17493 19231 20082 21602
7 West-Kazakhstan 7735 8903 8508 8706 9324 9160 9236
8 Karaganda 17170 17972 16391 17102 17704 18295 19109
9 Kostanay 10098 11066 10913 10121 11117 10221 10064
10 Kyzylorda 12389 13186 11391 11388 12029 12918 13439
11 Mangystau 7735 8278 8685 9121 9831 11098 11561
12 Pavlodar 8450 8844 8398 8742 9608 9783 9702
13 North-Kazakhstan 7851 8180 7587 7536 7409 7535 7466
14 South-Kazakhstan 48232 50239 48880 49776 53840 56566 58720
15 Astana City 5367 6194 6012 7142 8117 9548 10785
16 Almaty City 14993 15748 14702 16333 17755 19209 20407
Republican boarding
schools
83 40 38 42 44 79 100
Nazarbayev
intellectual schools
0 0 0 254 0 360 37
Bobek Gymnasium
(National Educational
and Recreational
Research Center)
65
Schools under
universities
60
TOTAL 231382 245577 232097 237612 256306 268853 280969
Source: IAC based on the data of the PSED provided in “Key Indicators of the Preschool and Secondary Education System”, Astana
City 2012
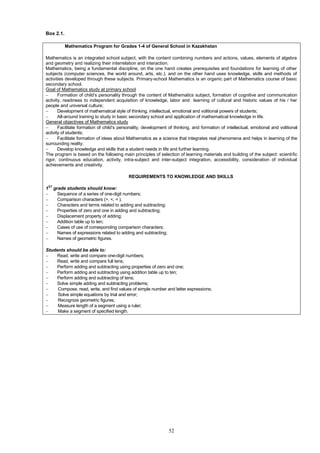
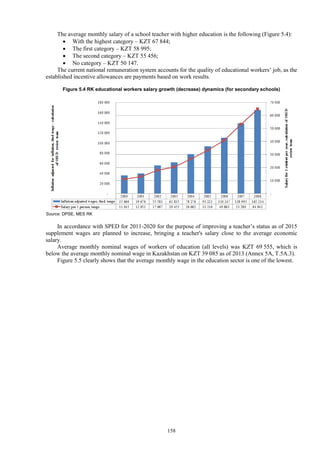
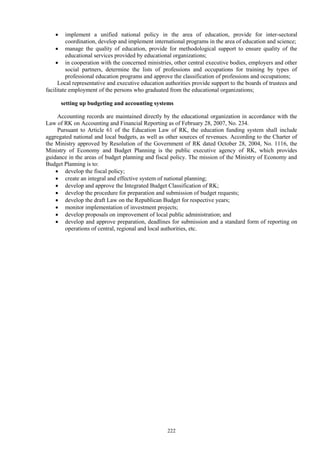
[2] Current priorities of the education policy include provision of all groups of population with equal
access to high-quality education and introduction of effective financing of the school system. It is the
responsibility of the Government of RK, the authorized body for education and local representative and
executive bodies to channel educational resources to the education policy priorities. Pursuant to
paragraphs 22 and 25-1 of Article 4 of the Education Law of RK, in the field of education the
Government of RK shall:
approve the rules for generating, designating, and accounting the funds to provide financial and
material assistance to students of the public educational institutions who are members of the
families eligible to receive targeted social assistance from the government, to orphans, children
without parental care but living in families, children from families requiring urgent assistance due
to emergency situations, and other categories of students defined by the collegial management
body of an educational institution, the financial assistance in this case shall constitute not less
than one percent of the budget allocated to general education schools;
determine the size, sources, types and procedure for providing social assistance to the citizens
who need support.
Pursuant to Article 5 of the Education Law of RK, the authorized body for education (the
Ministry of Education and Science) shall perform the following functions:
arrange development and approve standards for equipping and furnishing organizations of
preschool education, primary education, lower secondary education, general secondary education,
technical and vocational education;
arrange development and approve the rules for organization and operation of the unified
information system for education;
arrange development and approve the methodology for standard per capita funding of school
system and technical and vocational education system;](https://image.slidesharecdn.com/cbrkazakhstanenglishfinal-150416080802-conversion-gate02/85/Country-Background-Report-for-Kazakhstan-OECD-review-220-320.jpg)
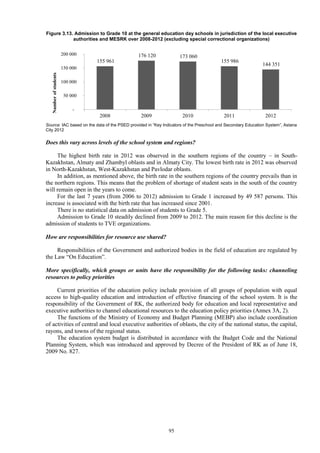
![223
Appendix 4A
Table 4A.1. Share of local expenditures on secondary education (%)
Oblast 2012 2013
Akmola 69,4 81,2
Aktobe 92,7 76,3
Almaty 89,4 88,3
Atyrau 80,6 83,2
West Kazakhstan 79,8 79,8
Zhambyl 79,5 82,5
Karaganda 78,6 68,7
Kostanay 74,4 60,2
Kyzylorda 87,1 70,5
Mangystau 50,3 49,4
South Kazakhstan 85,9 87,4
Pavlodar 73,9 66,9
North Kazakhstan 85,6 86,3
East Kazakhstan 84,6 66,9
Almaty city 67,5 69,6
Astana city 75,1 69,0
Source: NCESA “Statistics of education of the Republic of Kazakhstan” National report, 2014
[1] Oblast budgets, budgets of the city of national significance and the capital, budgets of rayons (cities of
the oblast significance) are referred to as local budgets.
According to Article 54 of the Budget Code of the Republic of Kazakhstan (2008), oblast budget
expenses for education cover the following areas:
1) Extended education for children offered at the oblast level;
2) Children’s study under special general education programs;
3) Gifted children’s study in specialized educational organizations;
4) Holding of oblast-level school Olympiads;
5) Examination of mental health of children and teenagers and delivery of psychological-
medical-pedagogical advisory assistance to the population;
6) Rehabilitation and social adaptation of children and teenagers with development problems;
7) State support to orphans and children without parental care, their mandatory job placement
and provision of housing;
8) Free-of-charge and discounted meals for specific categories of students in accordance with the
procedure established by the legislation of the Republic of Kazakhstan;
9) Methodological work;
10) Operation of centers for adaptation of under-age children.
According to Article 55 of the Budget Code of the Republic of Kazakhstan (2008), budgets of the
city of national significance and the capital cover education expenses in the following areas:
1) Organization and provision of compulsory general secondary education, including evening
(shift) form of study, including boarding schools;
2) Study under special general education programs;
3) Gifted children’s study in specialized educational organizations;
4) Holding of school Olympiads at the level of the city of national significance and the capital;
5) Examination of mental health of children and teenagers and delivery of psychological-medical-
pedagogical advisory assistance to the population;
6) Rehabilitation and social adaptation of children and teenagers with development problems;
7) Extended education for children;
8) Purchase and delivery of textbooks and teaching materials for public educational organizations
offering general education programs of primary, lower secondaryand general secondary education, as
well as special and specialized general education programs;
9) Material-and-technical support to public educational organizations (excluding educational
organizations at correctional facilities of the penal system) and preschool education and training
organizations;](https://image.slidesharecdn.com/cbrkazakhstanenglishfinal-150416080802-conversion-gate02/85/Country-Background-Report-for-Kazakhstan-OECD-review-224-320.jpg)
![224
10) State support to orphans and children without parental care, their mandatory job placement
and provision of housing;
11) Health services to students of educational organizations, excluding preschool education
organizations;
12) Free-of-charge and discounted meals for specific categories of students;
13) Operation of centers for adaptation of under-age children.
According to Article 56 of the Budget Code of the Republic of Kazakhstan (2008), budgets of rayons
(city of oblast significance) cover expenses for education in following areas:
1) Primary, lower secondaryand general secondary education, including evening (shift) form of
study, and general secondary education delivered through boarding-type schools;
2) Holding of school Olympiads at the rayon (city) level;
3) Purchase and delivery of textbooks and teaching materials for educational organizations
offering general education programs of pre-school, primary, lower secondaryand general secondary
education;
4) Extended education for children;
5) Material-and-technical support to public educational organizations offering general education
programs of primary, lower secondaryand general secondary education (excluding educational
organizations at correctional facilities of the penal system);
6) State support to orphans and children without parental care, their mandatory job placement and
provision of housing;
7) Health services to students of educational organizations, excluding pre-school education
organizations;
8) Free-of-charge and discounted meals for specific categories of students.
[2] According to Article 53 of the Budget Code of the Republic of Kazakhstan (2008), republican budget
expenses for education cover the following areas:
1) General education for gifted children in republican educational organizations;
2) Holding of national-level out-of-school activities;
3) Further training and retraining of staff at the national level;
4) Provision of textbooks and teaching materials for republican secondary education organizations,
as well as for nationals studying in foreign schools under international treaties.
According to Article 54 of the Budget Code of the Republic of Kazakhstan (2008), oblast budget
expenses for education cover the following areas:
1) Extended education for children offered at the oblast level;
2) Children’s study under special general education programs;
3) Gifted children’s study in specialized educational organizations;
4) Holding of oblast-level school Olympiads;
5) Examination of mental health of children and teenagers and delivery of psychological-
medical-pedagogical advisory assistance to the population;
6) Rehabilitation and social adaptation of children and teenagers with development problems;
7) State support to orphans and children without parental care, their mandatory job placement
and provision of housing;
8) Free-of-charge and discounted meals for specific categories of students in accordance with the
procedure established by the legislation of the Republic of Kazakhstan;
9) Methodological work;
10) Operation of centers for adaptation of under-age children.
According to Article 55 of the Budget Code of the Republic of Kazakhstan (2008), budgets of the
city of national significance and the capital cover education expenses in the following areas:
1) Organization and provision of compulsory general secondary education, including evening
(shift) form of study, including boarding schools;
2) Study under special general education programs;
3) Gifted children’s study in specialized educational organizations;
4) Holding of school Olympiads at the level of the city of national significance and the capital;
5) Examination of mental health of children and teenagers and delivery of psychological-medical-
pedagogical advisory assistance to the population;
6) Rehabilitation and social adaptation of children and teenagers with development problems;
7) Extended education for children;](https://image.slidesharecdn.com/cbrkazakhstanenglishfinal-150416080802-conversion-gate02/85/Country-Background-Report-for-Kazakhstan-OECD-review-225-320.jpg)
![227
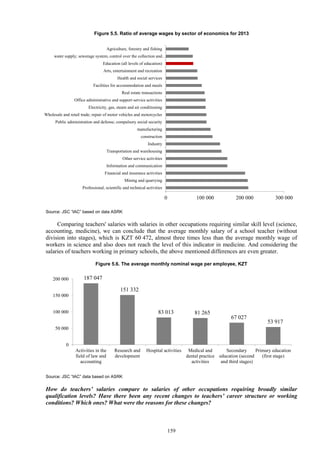
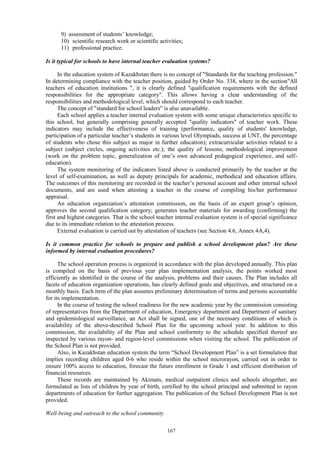
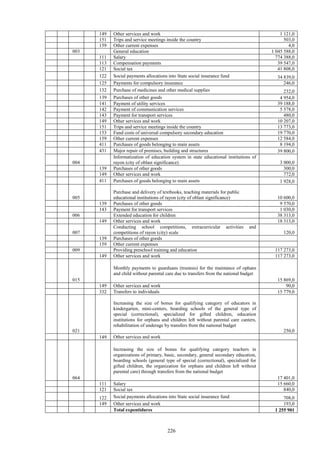
[3] At local level, expenses for educational resources are allocated from local budgets in accordance with
Articles 54, 55, and 56 of the Budget Code of the Republic of Kazakhstan (2008) in the following areas:
1) Extended education for children offered at the oblast level;
2) Children’s study under special general education programs;
3) Gifted children’s study in specialized educational organizations;
4) Holding of oblast-level school Olympiads;
5) Examination of mental health of children and teenagers and delivery of psychological-medical-
pedagogical advisory assistance to the population;
6) Rehabilitation and social adaptation of children and teenagers with development problems;
7) State support to orphans and children without parental care, their mandatory job placement and
provision of housing;
8) Free-of-charge and discounted meals for specific categories of students in accordance with the
procedure established by the legislation of the Republic of Kazakhstan;
9) Methodological work;
10) Organization and provision of compulsory general secondary education, including evening (shift)
form of study, including boarding schools;
11) Holding of school Olympiads at the level of the city of national significance and the capital;
12) Extended education for children;
13) Purchase and delivery of textbooks and teaching materials for public educational organizations
offering general education programs of primary, lower secondaryand general secondary
education, as well as special and specialized general education programs;
14) Material-and-technical support to public educational organizations (excluding educational
organizations at correctional facilities of the penal system) and preschool education and training
organizations;
15) State support to orphans and children without parental care, their mandatory job placement and
provision of housing;
16) Health services to students of educational organizations, excluding preschool education
organizations;
17) Free-of-charge and discounted meals for specific categories of students;
18) Operation of centers for adaptation of under-age children.
19) Primary, lower secondaryand general secondary education, including evening (shift) form of
study, and general secondary education delivered through boarding-type schools;
20) Holding of school Olympiads at the rayon (city) level;
21) State support to orphans and children without parental care, their mandatory job placement and
provision of housing.
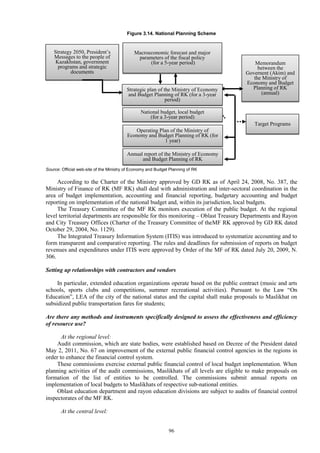
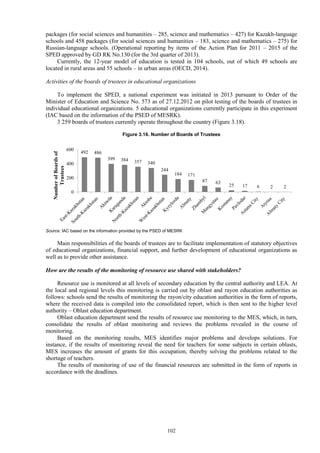
Table 4A.3. Computerization of public general secondary day schools
Oblast
Total
Ofwhichinrural
area
computerized
Ofwhichinrural
area
Connectedtothe
Internet
Amountof
computers
Ofwhichusedin
educationalprocess
Amountofstudents
Amountofstudents
peronecomputer
Amountof
computersneededto
bereplaced
RK 7 307 5702 7 307 5682 7 266 246114 196583 2 525 047 13 47988
Akmola 621 526 621 526 618 9 204 8 640 103 463 12 2574
Aktobe 435 350 435 350 435 11597 10 174 115 424 12 5367
Almaty 743 652 743 652 743 18 958 15 033 307 900 20 4898
Atyrau 195 138 195 121 195 9 471 7 621 96 043 13 2 694
West Kazakhstan 407 350 407 350 407 11 926 5 902 87 013 15 6024
Zhambyl 453 366 453 366 441 17 907 16 056 185 191 11 1 696
Karaganda 539 331 539 331 539 30 692 29 366 171 708 6 2536
Kostanay 555 475 555 473 555 6 437 6 237 99 740 16 3510
Kyzylorda 291 235 291 234 285 12 167 12 167 125 803 10 3645
Mangystau 126 81 126 81 122 4597 4 545 100 104 22 1217
South
Kazakhstan
1 022 832 1 022 832 1 017 47 565 35 514 543 520 11 978](https://image.slidesharecdn.com/cbrkazakhstanenglishfinal-150416080802-conversion-gate02/85/Country-Background-Report-for-Kazakhstan-OECD-review-228-320.jpg)
![230
Table 4A.5. TVE specializations
№ Education specialization, specialty name Qualification
1 Preschool education and training Preschool educator
Foster carer
2 Organization of educational work (by levels)
Extended education teacher
Facilitator
Educator of educational organization
Counselor of educational organization
3 Physical education and sports
Swimming, physical education instructor
Physical education and sport teacher
Sport coach-instructor
4
Vocational training (by sectors)
Agricultural production
Vehicle maintenance and repair
Garment production
Foodstuffs production
Construction
Mechanization of agricultural production
Information and communication technology
Computer software
Welding (electrical technician)
Vocational training instructor, technician (all areas)
Technology of processing industries
Operation of oil and gas fields
Vocational training instructor, technician (all areas)
5 Primary education
Primary school teacher
Computer sciences teacher in primary education
Foreign languages teacher in primary education
Kazakh language teacher in primary education
Russian language teacher in primary education
Self-knowing teacher in primary education
Учитель математики начального образования
6 Art and technical drawing Art and technical drawing teacher in lower
secondaryeducation7 Technology Technology teacher in lower secondaryeducation
8 Music education Music teacher in preschool and lower secondaryeducation
organizations9 Safety and valeology Safety and valeology teacher in lower secondaryeducation
Source: Classification of professions and specializations of technical and vocational and post-secondary education, GK RK 05-2008
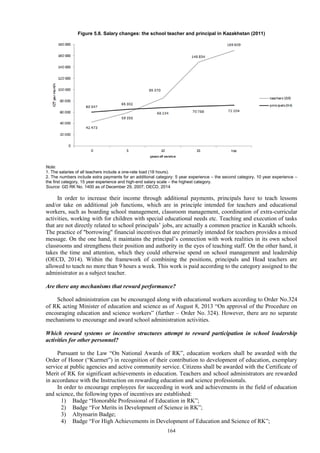
[4] In accordance with the Certification rules of teachers, approved by Order of the acting as Minister of
Education and Science of Kazakhstan from 07.08.2013 No. 323, certification of teachers - a procedure
performed to determine whether the level of qualifications of teaching staff meet qualification
requirements for the passage of which the employee is assigned / confirmed or not assigned / not
confirmed qualification category - the level of the qualification requirements of employee, reflecting the
complexity of the work.
One of the stages of a certification is voluntary qualification testing (hereinafter - the optional test) -
one of the types of qualification procedures for teaching staff, which is conducted to determine the level
of professional competence for early promotion and increasing qualification category.
The main stage of certification is analytical generalization outcomes, including assessment of
professional competence of teaching staff on the basis of a systematic, consistent and objective study of
his professional activity.
Certification has two main objectives:
1) identification of whether the level of competence of teaching staff meet qualification requirements
to establish and confirm the relevant category;
2) expanding the scope of the teaching staff motivation to design personal achievements.
When certification takes place, the principles of transparency and collegiality which provide
objective attitude to the certified pedagogical workers, consistency and integrity of internal and external
assessments.
Certification is conducted not more than once every five years.
Certification of teachers of republican subordinate education organizations is carried out by the
authorized body in the field of education.
Certification of teachers of educational institutions of specialized government agencies carried out by
certification commissions of educational organizations and relevant government agencies.](https://image.slidesharecdn.com/cbrkazakhstanenglishfinal-150416080802-conversion-gate02/85/Country-Background-Report-for-Kazakhstan-OECD-review-231-320.jpg)
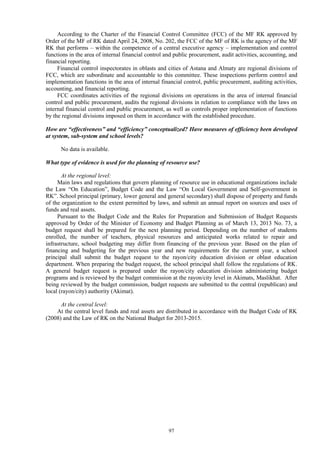
![237
Appendix 5A
Table 5A.1 Teacher/student ratio, 2012-2013 academic years
No. Oblasts, cities Teacher/student
ratio
2012-2013
1 Akmola 7,4
2 Aktobe 7,0
3 Almaty 8,7
4 Atyrau 9,1
5 East Kazakhstan 8,0
6 Zhambyl 8,3
7 West Kazakhstan 7,4
8 Karaganda 8,9
9 Kostanai 7,6
10 Kyzylorda 6,9
11 Mangystau 11,7
12 Pavlodar 7,7
13 North Kazakhstan 5,5
14 South Kazakhstan 9,2
15 Astana city 14,9
16 Almaty city 12,4
Source: IAC JSC based on data from MES RK
[1] Also worth noting is another professional development opportunity for (a small number of)
Kazakhstani teachers offered by Center for International Programs JSC within the Bolashak program.
Beginning 2008, the program offers stipends for professional training and internships in the field of
research and teaching with the duration of up to 12 months, but not less than 3 months.
In 2012, two more specializations were added to the list – medicine and engineering. Teachers who
possess at least three-year work experience are entitled to participating in the program, and the average
enrollment ratio is 50%. This program works with partner higher education institutions that help develop
the courses included in the training program.
Training begins with an English course (for those teachers who need language preparation), followed
by teacher training (for instance, innovative training methods, module training and English learning).
Teachers are expected to return to Kazakhstan and teach for at least three years following completion of
the program (a teacher who had taught in a rural area is expected to return in order to teach in the same
rural area).
According to information provided by the Center for International Programs, by 2013 the number of
stipends issued for professional training in research and teaching amounted to 697 people, out of which
only in 2013, 78 stipends were assigned to teachers. Unfortunately, the issue regarding the long-term
existence of this program is not clear, and there is no long-term planning after 2016.](https://image.slidesharecdn.com/cbrkazakhstanenglishfinal-150416080802-conversion-gate02/85/Country-Background-Report-for-Kazakhstan-OECD-review-238-320.jpg)
![239
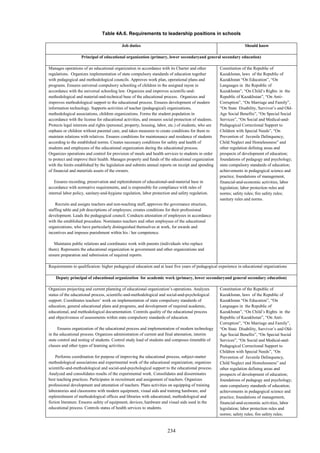
Table 5A.4. Requirements for applicants to complete new generation courses
Third (base) level
No.
Requirements
1 Higher teaching education, with at least 3-year teaching experience, vocational and technical
(secondary vocational) education with at least 5-year teaching experience
2 Results of participation in professional competitions at a school, rayon (city) level
3 Results of winners, prize-winners of subject Olympiads, creative contests, scientific and sports
competitions at a school, rayon (city) level (among the number of its participants)
4 Knowledge and application of innovative methods in the educational process
5 Dissemination of experience (publication, collections, recommendations, manuals, displayed
material) in the course of preparing and conducting rayon (city) conferences, seminars and
forums.
6 Possession of basic knowledge on information-communication technologies (hereinafter – ICT),
MS Windows, MS Office, Internet, particularly E-mail.
Second (intermediate) level
No. Requirements
1 Higher teaching education, with at least 5-year teaching experience, vocational and technical
(secondary vocational) education with at least 7-year teaching experience
2 Results of participation in professional competitions at a school, rayon (city) and oblast level
3 Results of winners, prize-winners of subject Olympiads, creative contests, scientific and sports
competitions at a school, rayon (city) and oblast level (among the number of its participants)
4 Knowledge and application of innovative methods in the educational process
5 Development, or taking part in the development of training manuals and education programs
6 Dissemination of experience (publication, collections, recommendations, manuals, displayed
material) in the course of preparing and conducting oblast (national) conferences, seminars and
forums.
7 Possession of knowledge on ICT, MS Windows, MS Office, E-mail, Internet services.
First (advanced) level
No. Requirements
1 Higher teaching education, with at least 7-year teaching experience, vocational and technical
(secondary vocational) education with at least 9-year teaching experience
2 Results of participation in professional competitions at a school, rayon (city), oblast, national
(international) level
3 Persons who educated winners, prize-winners of subject Olympiads, creative contests, scientific
and sports competitions at a rayon (city), oblast, national (international) level
4 Use of innovative methods and teaching technologies in the educational process
5 Development, or taking part in the development of training manuals and education programs
6 Publications in teaching journals, periodicals
7 Dissemination of experience (publication, collections, recommendations, manuals, displayed
material) in the course of preparing and conducting national (international) conferences, seminars
and forums.
8 Conducting training seminars and training programs at a rayon, oblast (city), international level,
and is a mentor for young educational workers
9 Possession of knowledge on ICT, MS Office, E-mail, Internet services at an advanced-user level.
Possession of a sufficiently high level of functional literacy in ICT, reasonable use of ICT in
education activities to address professional, social and personal objectives
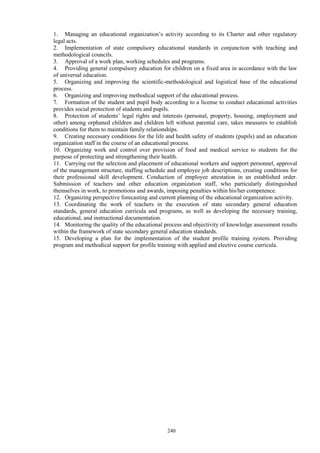
[2] According to Order No.338 of RK Minister of education and science as of July 13, 2009 “On approval
of Standard qualification characteristics of the positions held by educational workers and equivalent
persons”, the main tasks of an educational organization’s administration are as follow:](https://image.slidesharecdn.com/cbrkazakhstanenglishfinal-150416080802-conversion-gate02/85/Country-Background-Report-for-Kazakhstan-OECD-review-240-320.jpg)
![241
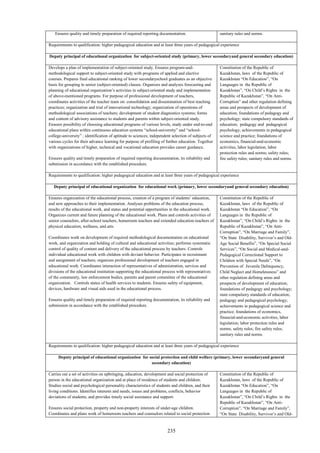
Table 5A.5. Provision of interactive classrooms in day schools of general secondary education in 2012-2013
academic year (excl. special correction organizations)
No.
Oblasts (regions),
cities
Total schools with
interactive
classrooms
including out of which
urban rural PS BS SS
1 Akmola 269 82 187 0 14 255
2 Aktobe 182 75 107 0 4 178
3 Almaty 327 91 236 1 2 324
4 Atyrau 64 38 26 0 0 64
5 East Kazakhstan 456 141 315 1 18 437
6 Zhambyl 154 83 71 1 4 149
7 West Kazakhstan 141 56 85 0 2 139
8 Karaganda 331 203 128 2 11 318
9 Kostanai 307 80 227 5 17 285
10 Kyzylorda 253 56 197 0 23 230
11 Mangystau 114 52 62 9 4 101
12 Pavlodar 369 83 286 10 71 288
13 North Kazakhstan 257 52 205 0 6 251
14 South Kazakhstan 484 144 340 0 13 471
15 Astana city 70 70 0 3 0 67
16 Almaty city 180 180 0 0 2 178
Republican boarding
schools
7 7 0 0 0 7
NIS 7 7 0 0 0 7
Bobek gymnasium
school
1 1 0 0 0 1
schools at HEIs 1 1 0 0 0 1
TOTAL 3974 1502 2472 32 191 3751
Source: MESRK“Key indicators of preschool and secondary education for 2012-2013 academic year”, Astana 2012
[3] The inspection functions (quality assessment of education organizational activities) are imposed upon
the Committee on Control in Education and Science of the Republic of Kazakhstan according to the
Regulations on “The Committee on Control in Education and Science of MES RK” State Enterprise
(Order No.289-к of MESRK Executive Secretary as of October 27, 2011):
Implementation of unified state policy in the field of education. The Committee issues licenses for
the provision of educational services, carries out state attestation of educational organizations,
supervises the execution of RK legislation and regulations in the field of education, imposes
administrative penalties for violations, develops and approves the Audit plan for educational
organizations, keeps records of inspected entities, coordinates and supervises the activities of
territorial bodies, renders methodical support to territorial bodies, apostles education bodies’ official
documents, recognizes and nostrifies documents on education (RK GD No.1270 as of 24.12.2007
Regulations on state attestation of educational organizations, RK GD No.645 as of 08.06.2011
Regulations on attestation of entities carrying out research and/or research and technical activities,
RK GD No.635 as of June 19, 2013 “On approval of Regulations on state attestation of educational
organizations”, MESRK Order No.8 as of 10.01.2008 Regulations on recognition and nostrification
of documents on education, RK Law as of 30.12.1999 No.11- II “On the accession of Kazakhstan to
the Convention abolishing the requirement to legalize foreign official documents").
State control and improving the quality of education service provision through external evaluation.
This activity carried out by the Committee is to organize and conduct the unified national testing,
external evaluation of educational achievements and conduct educational monitoring through the
external evaluation of education quality (MESRK Order No.506 as of 05.12.2011 Regulations on
conducting the unified national testing, MESRK Order No.459 as of 03.10.2012 On conducting the
external evaluation of educational achievements at RK higher education organizations in 2012 (in
2013), MESRK Order No.151 as of 06.04.2012 The Procedure on conducting EEEA at RK
educational organizations).
State control and improving the quality of research staff training. For this purpose, the Standard
regulation was developed on the dissertation council (the standard regulation on the dissertation](https://image.slidesharecdn.com/cbrkazakhstanenglishfinal-150416080802-conversion-gate02/85/Country-Background-Report-for-Kazakhstan-OECD-review-242-320.jpg)
![243
Appendix 6A
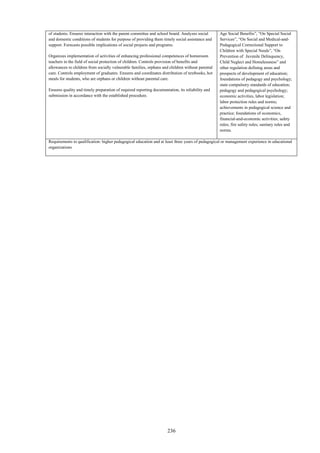
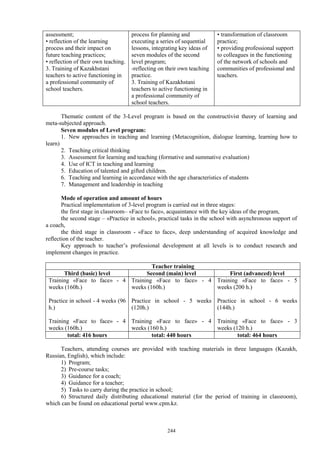
[1] The actual content of the training courses for teachers and leaders of educational organizations of the
Republic of Kazakhstan
Professional development level courses for pedagogical workers of the Republic of Kazakhstan
In accordance with the agreement between Autonomous Education Organization (AEO)
“Nazarbayev Intellectual Schools” and Cambridge International Examinations Council, the Center of
excellence of AEO" Nazarbayev intellectual schools "(hereinafter referred to as the Centre), together
with the Faculty of education, University of Cambridge designed and implemented level programs for
advanced training of teachers in the Republic of Kazakhstan (hereinafter referred to as the Level
programs).
Aims of the 3- level programs are defined as:
1. Providing teachers the knowledge and practical commitment in the process of learning, which
support development of students' independent learning skills, self-control, becoming active citizens and
experts competent in the field of information technology, able to engage in a constructive dialogue with
various audiences, and succeed in the modern world.
2. Meet the educational needs of pedagogical workers in gaining additional knowledge and skills;
promote readiness of teachers to the continuous professional development in a rapidly changing world.
3. Training of teachers, with a fairly high level of theoretical and practical skills to teaching and
mentoring their colleagues to improve their practice.
4. Training of teachers to the organization, management and operation in the professional
community of teachers, in order to facilitate their professional development.
5. Implementation of support in innovative processes in education, which ensures effectiveness of
methodical work.
Program consists of 3 levels.
Levels of the program:
1. Third (basic) level
2. Second (main) level
3. First (advanced) level
Tasks of level program
Third (basic) level Second (main) level First (advanced) level
1. Development of conceptual
understanding of theoretical
foundations of Program in the
context of seven modules.
2. Ensuring successful practical
implementation of conceptual
foundations of Program in
Kazakhstani educational
conditions and demonstration of
formed skills by teachers:
• reflexive thinking in accordance
with the key ideas of the
program;
• planning of teaching process;
• planning and practical
implementation of series of
sequential lessons that integrate
themes of seven modules;
• engaging students in the
learning process;
• effective system of student
1. Development of conceptual
understanding of second level
program in the context of its
seven modules.
2. Ensuring successful practical
implementation of key ideas of
the second level by its integrating
them into the tasks of
Kazakhstan education system
and also well-formedness of
teachers skills:
- reflexive thinking about
principal basics of the second
level program;
- planning and implementing
Аction research;
- implementation process of
coaching and mentoring in order
to govern the learning of teachers
team;
- implementation of monitoring
1. Development of conceptual
understanding of theoretical
foundations of first level
Program in the context of seven
modules.
2. Ensuring successful practical
implementation of key ideas of
the first level program in
conditions of Kazakhstan and
confirmation of formation of
his/her skills:
• reflective thinking in the
context of key ideas of the first
level of Progra;
• planning and implementation of
the approach Action research,
Lesson study in a scale of school;
• implementing of the coaching
process in the school;
• assist school coach in terms of a
process mentoring;](https://image.slidesharecdn.com/cbrkazakhstanenglishfinal-150416080802-conversion-gate02/85/Country-Background-Report-for-Kazakhstan-OECD-review-244-320.jpg)
![247
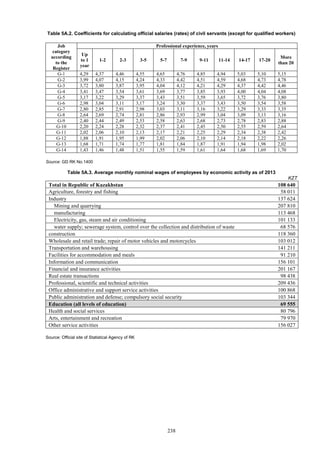
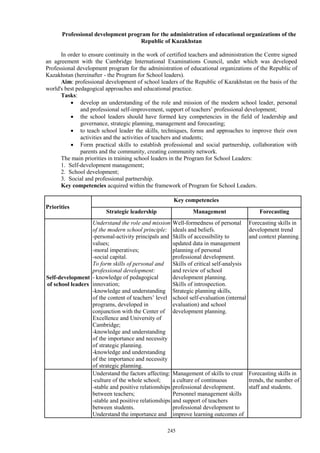
All training materials are available on the educational portal www.cpm.kz.
Center on a systematic basis after the course supports leaders who have been trained under the
Program for School Leaders.
[2] Financial Control Inspectorate performs control and implementation functions in the area of internal
financial control, public procurement, audit activities, accounting, and financial reporting.
Main functions of the Inspectorate include the following:
1) Control compliance of the use of funds from the national and local budgets with the laws of RK;
2) Control reliability and accuracy of accounting and reporting maintained by the entities subject to
monitored;
3) Control compliance of the internal control services with the public financial control standards;
4) Submit claims to the court to ensure compensation of the amounts revealed in the course of
monitoring to the budget and on invalidation of the operational public procurement contracts signed
in violation of the public procurement laws of RK;
5) Interact with the public financial control authorities and law enforcement agencies in relation to
compliance with the public procurement and budgetary legislation of RK;
6) Control compliance with the public procurement laws of RK, including audits related to
compliance with the laws on public procurement and Kazakhstan content in public procurement;
7) Compile reports, review cases on administrative offences and impose administrative penalties in
the area of public procurement, accounting and financial reporting, audit activities, budgetary
legislation of RK in accordance with the procedure established by the laws of RK on administrative
offences;
8) Exercise public control in the area of accounting and financial reporting;
9) Exercise public control in the area of audit activities and activities of professional audit
organizations (official internet resource of Kostanay Oblast Akimat).
[3] According to these Rules, to ensure competitiveness of Kazakhstan’s education and achievement of
high ratings, participants of the competitions are selected by the competition commission based on the
following criteria:
1) Introducing ICT in education (effective use of contemporary education technologies; the
number of students per 1 computer; Internet connection; availability of subject classrooms of the new
modification);
2) Providing access to high-quality education (proportion of the graduates who received secondary
education certificate with a gold medal (Altyn Belgi); proportion of the graduates who received secondary
education certificate with distinction; share of children covered by supplementary education);
3) Staffing of the educational process (taking advanced training and retraining courses for teachers
once every 5 years; proportion of teachers who teach mathematical and natural sciences in English;
proportion of teachers who took advanced training courses on use of ICT; changes in proportion of young
professionals who joined the educational organization during the current year; proportion of teachers with
the highest and first qualification grades; proportion of teachers who participated in rayon (city), oblast,
national and international conferences, seminars, forums, exhibitions, shows, teachers’ readings, as well
as in experimental, research and applied activities, scientific projects (programs), expert reviews of
academic publications; having copyright textbooks, programs, scientific research, publications,
introducing best teaching experience);
4) Providing educational organizations with physical infrastructure and equipment (efficient and
effective financing; sound and proportionate distribution of funds);
5) Creating conditions for maintaining students’ health, for occupational safety and health of
participants of the educational process (enrollment of students to sports clubs at educational
organizations; provision of students from low-income families with free high-vitamin hot meals;
dynamics of incidence of diseases among students; compliance of the learning environment with public
health regulations; availability of full-time positions for school inspectors, psychologists and social
counselors);
6) Creating conditions for professional and personal self-actualization of teachers and school
leaders (availability of information and methodological space at educational organizations; provision of
teachers with ICT facilities);
7) Creating conditions for inclusive education (proportion of children with special needs covered
by inclusive education in the total number of students of an educational organization);](https://image.slidesharecdn.com/cbrkazakhstanenglishfinal-150416080802-conversion-gate02/85/Country-Background-Report-for-Kazakhstan-OECD-review-248-320.jpg)