Download to read offline


![24
1
Steven Ruggles, Katie Genadek, Ronald Goeken, Josiah Grover, and Matthew Sobek, Integrated Public Use Microdata Series: Version 7.0 [dataset]
(Minneapolis: University of Minnesota, 2017).
APPENDICES:
I. Methodology
The National Longitudinal Survey of Youth, 1979 cohort (NLSY79) is the main data source for this report. The
NLSY79 is one of the National Longitudinal Surveys that the Bureau of Labor Statistics (BLS) sponsored to
gather information about significant life events of several cohorts of men and women over time. The NLSY79
started with a nationally representative sample of 12,686 adolescents and young adults who were ages 14-22
in 1979 when the first interview took place (with oversamples of black and Hispanics, and those who served
in the military). In 1985, when interviewing of the full military sample ended, the total NLSY79 sample size
dropped to 11,607. These young adults were interviewed annually between 1979 and 1994 and on a biennial
basis afterwards. The most recent wave with available data was completed in 2014 when the respondents were
49 to 58 years old.
The earlier interviews are conducted in person, through a computer-assisted personal interview (CAPI)
instrument. As more respondents move and prefer telephone interviews over time, the telephone interviews
are now the main mode of interviewing.
The overall retention rate for the most recent wave is 71%. As of 2014, 7,071 original young adults are still
in the sample, and 790 respondents had been reported as deceased. Overall, 3,405 men ages 50 to 58 were
surveyed in the most recent wave. Black men who stayed in the latest wave (n=933) are the focus of this report.
The findings were weighted to reflect the characteristics of the overall population of this cohort.
Trend analyses comparing the economic status of black men and men of other race/ethnicity are based on
Decennial Census (1960, 1970, 1980,1990, and 2000) and the American Community Surveys (2010, 2016). The
dataset was obtained from the IPUMS-USA database.
The American Community Survey (ACS) is a household survey developed by the U.S. Census Bureau to replace
the long form of the decennial census program. It is collected throughout the year using mailed questionnaires,
telephone interviews, and visits from Census Bureau field representatives to about 3 million household
addresses annually.
Analyses of men’s economic status in the ACS are based on men ages 18 to 64. All estimates were weighted to
reflect the actual population of the subgroup.
Income and poverty
Men’s financial status in their fifties was measured by their total net family income in the most recent wave of
NLSY79. Their family income at ages 14 to 22 was measured in 1979. Both incomes were asked of the previous](https://image.slidesharecdn.com/u19ipxotrw74pdg0ui6q-signature-187fb159e5f5b8777329e442a384a63ec73cf1379d7be6090e420c197a895588-poli-181021184855/85/Black-Men-Making-it-in-America-24-320.jpg)
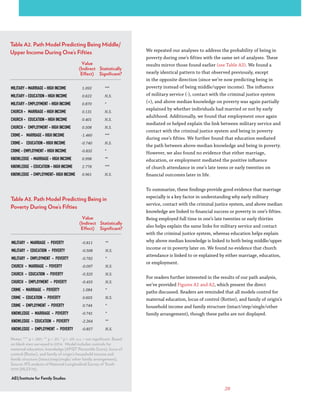
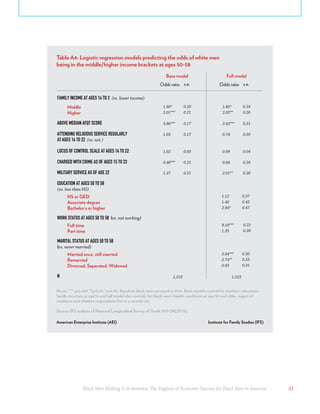

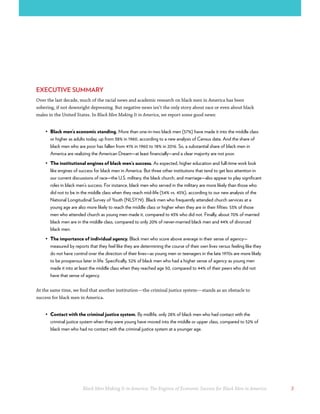
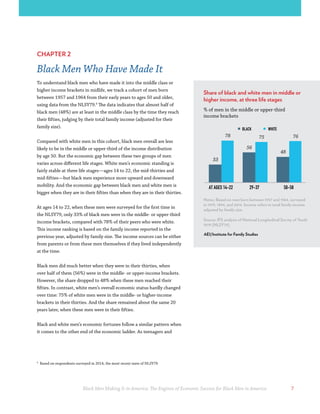
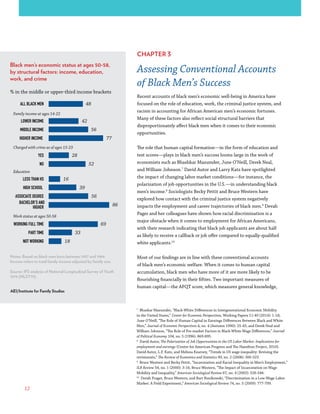
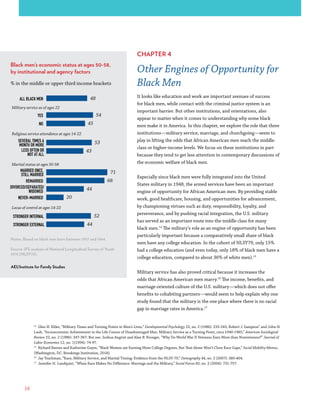
Over half (57%) of black men have reached the middle class or higher by midlife according to a new analysis of census data. The study examines a cohort of black men born between 1957-1964 using data from the National Longitudinal Survey of Youth 1979. It finds that while 48% of black men in this cohort reached the middle class by their 50s, their economic fortunes were more volatile over time compared to white men. Black men who achieved financial success by age 50 were more likely to be college educated, work full time, and be married.


![Discrimination in Black Employment [2013]:](https://cdn.slidesharecdn.com/ss_thumbnails/unemploymentbrief-131026170921-phpapp01-thumbnail.jpg?width=640&height=640&fit=bounds)


