Recommended

Recommended
More Related Content
Similar to Visitor Circulation Patterns at Country Living Fair
Similar to Visitor Circulation Patterns at Country Living Fair (18)
Recently uploaded
Recently uploaded (20)
Visitor Circulation Patterns at Country Living Fair
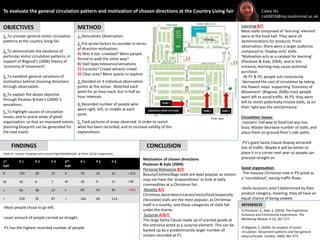
- 1. Casey Ho cah0459@my.londonmet.ac.uk 1) Poulsson, S., Kale, S. (2004). The Experience Economy and Commercial Experiences. The Marketing Review. 4 (1), 267-277. 2) Bitgood, S. (2006). An analysis of visitor circulation: Movement patterns and the general value principle. Curator, 49(4), 463-475. To evaluate the general circulation pattern and motivation of chosen directions at the Country Living fair OBJECTIVES METHOD 1. To uncover general visitor circulation patterns at the country living fair. 1. Naturalistic Observation 2. To demonstrate the existence of particular visitor circulation patterns, in support of Bitgood’s (2006) theory of ‘economy of movement’. 3. To establish general variations of motivation behind choosing directions through observation. 4. To explain the above objective through Poulson & Kale’s (2004) 5 sensations. 5. To highlight causes of circulation issues, and to praise areas of good organisation; so that an improved events planning blueprint can be generated for the next event. 2. Pre wrote factors to consider in terms of direction motivation; A) Was it too crowded? Were people forced to walk the other way? B) Stall type/relevance/sensations C) Curiosity? Crowd attracts crowd D) Clear area? More spaces to explore 3. Decided on 3 individual observation points at the venue. Watched each point for an hour each, but in half an hour intervals. 4. Recorded number of people who went right, left, or middle at each point. 5. Took pictures of areas observed in order to revisit what has been recorded, and to increase validity of the explanations. FINDINGS 1st half P 1 P 2 P 3 R 103 28 23 M 43 6 7 L 93 58 57 = 239 92 87 2nd half P 1 P 2 P 3 R 78 19 21 = 272 M 18 9 11 = 94 L 69 41 82 = 400 = 165 69 114 OBSERVED FROM UPSTAIRS Learning B/C Most stalls comprised of ‘learning’ element were at the food hall. They were all demonstrations for products. From observation, there were a larger audience compared to ‘display-only’ stalls. ‘Motivation acts as a catalyst for learning’ (Poulsson & Kale, 2004), and in this instance, learning may cause potential purchase. -At P1 & P2, people sub consciously ‘decreased the cost of circulation by taking the fewest steps’ supporting ‘Economy of Movement’ (Bitgood, 2006) most people went left to avoid traffic. At P3, they went left to revisit potentially missed stalls, as on their right was the exit/entrance. Circulation issues: -Upstairs’ hall way to food hall was too busy. Maybe decrease number of stalls, and place them on ground floor’s side paths. -P1’s giant Santa Clause display attracted lots of traffic. Maybe it will be better to place it in a corner next year so people can proceed straight on. Good organisation: -The massive Christmas tree in P3 acted as a ‘roundabout’, easing traffic flows. -Stalls locations aren’t determined by their product category, meaning they all have an equal chance of being viewed. -Most people chose to go left. -Least amount of people carried on straight. -P1 has the highest recorded number of people. CONCLUSION Floor plan Motivation of chosen directions Poulsson & Kale (2004) Personal Relevance B/D Beauty/Clothes/Bags stalls are least popular as visitors may not have the ‘preparedness’ to look at daily commodities at a Christmas fair. Novelty B/C Christmas decoration/scarves/socks/food (especially chocolate) stalls are the most popular, as Christmas itself is a novelty; and those categories of stalls fall under the theme. Surprise A/B/C The large Santa Clause made up of scented goods at the entrance acted as a surprise element. This can be backed up by a predominantly larger number of visitors recorded at P1. REFERENCES Table of number of people who turned Right/Middle/Left; at Point 1/2/3/ respectively