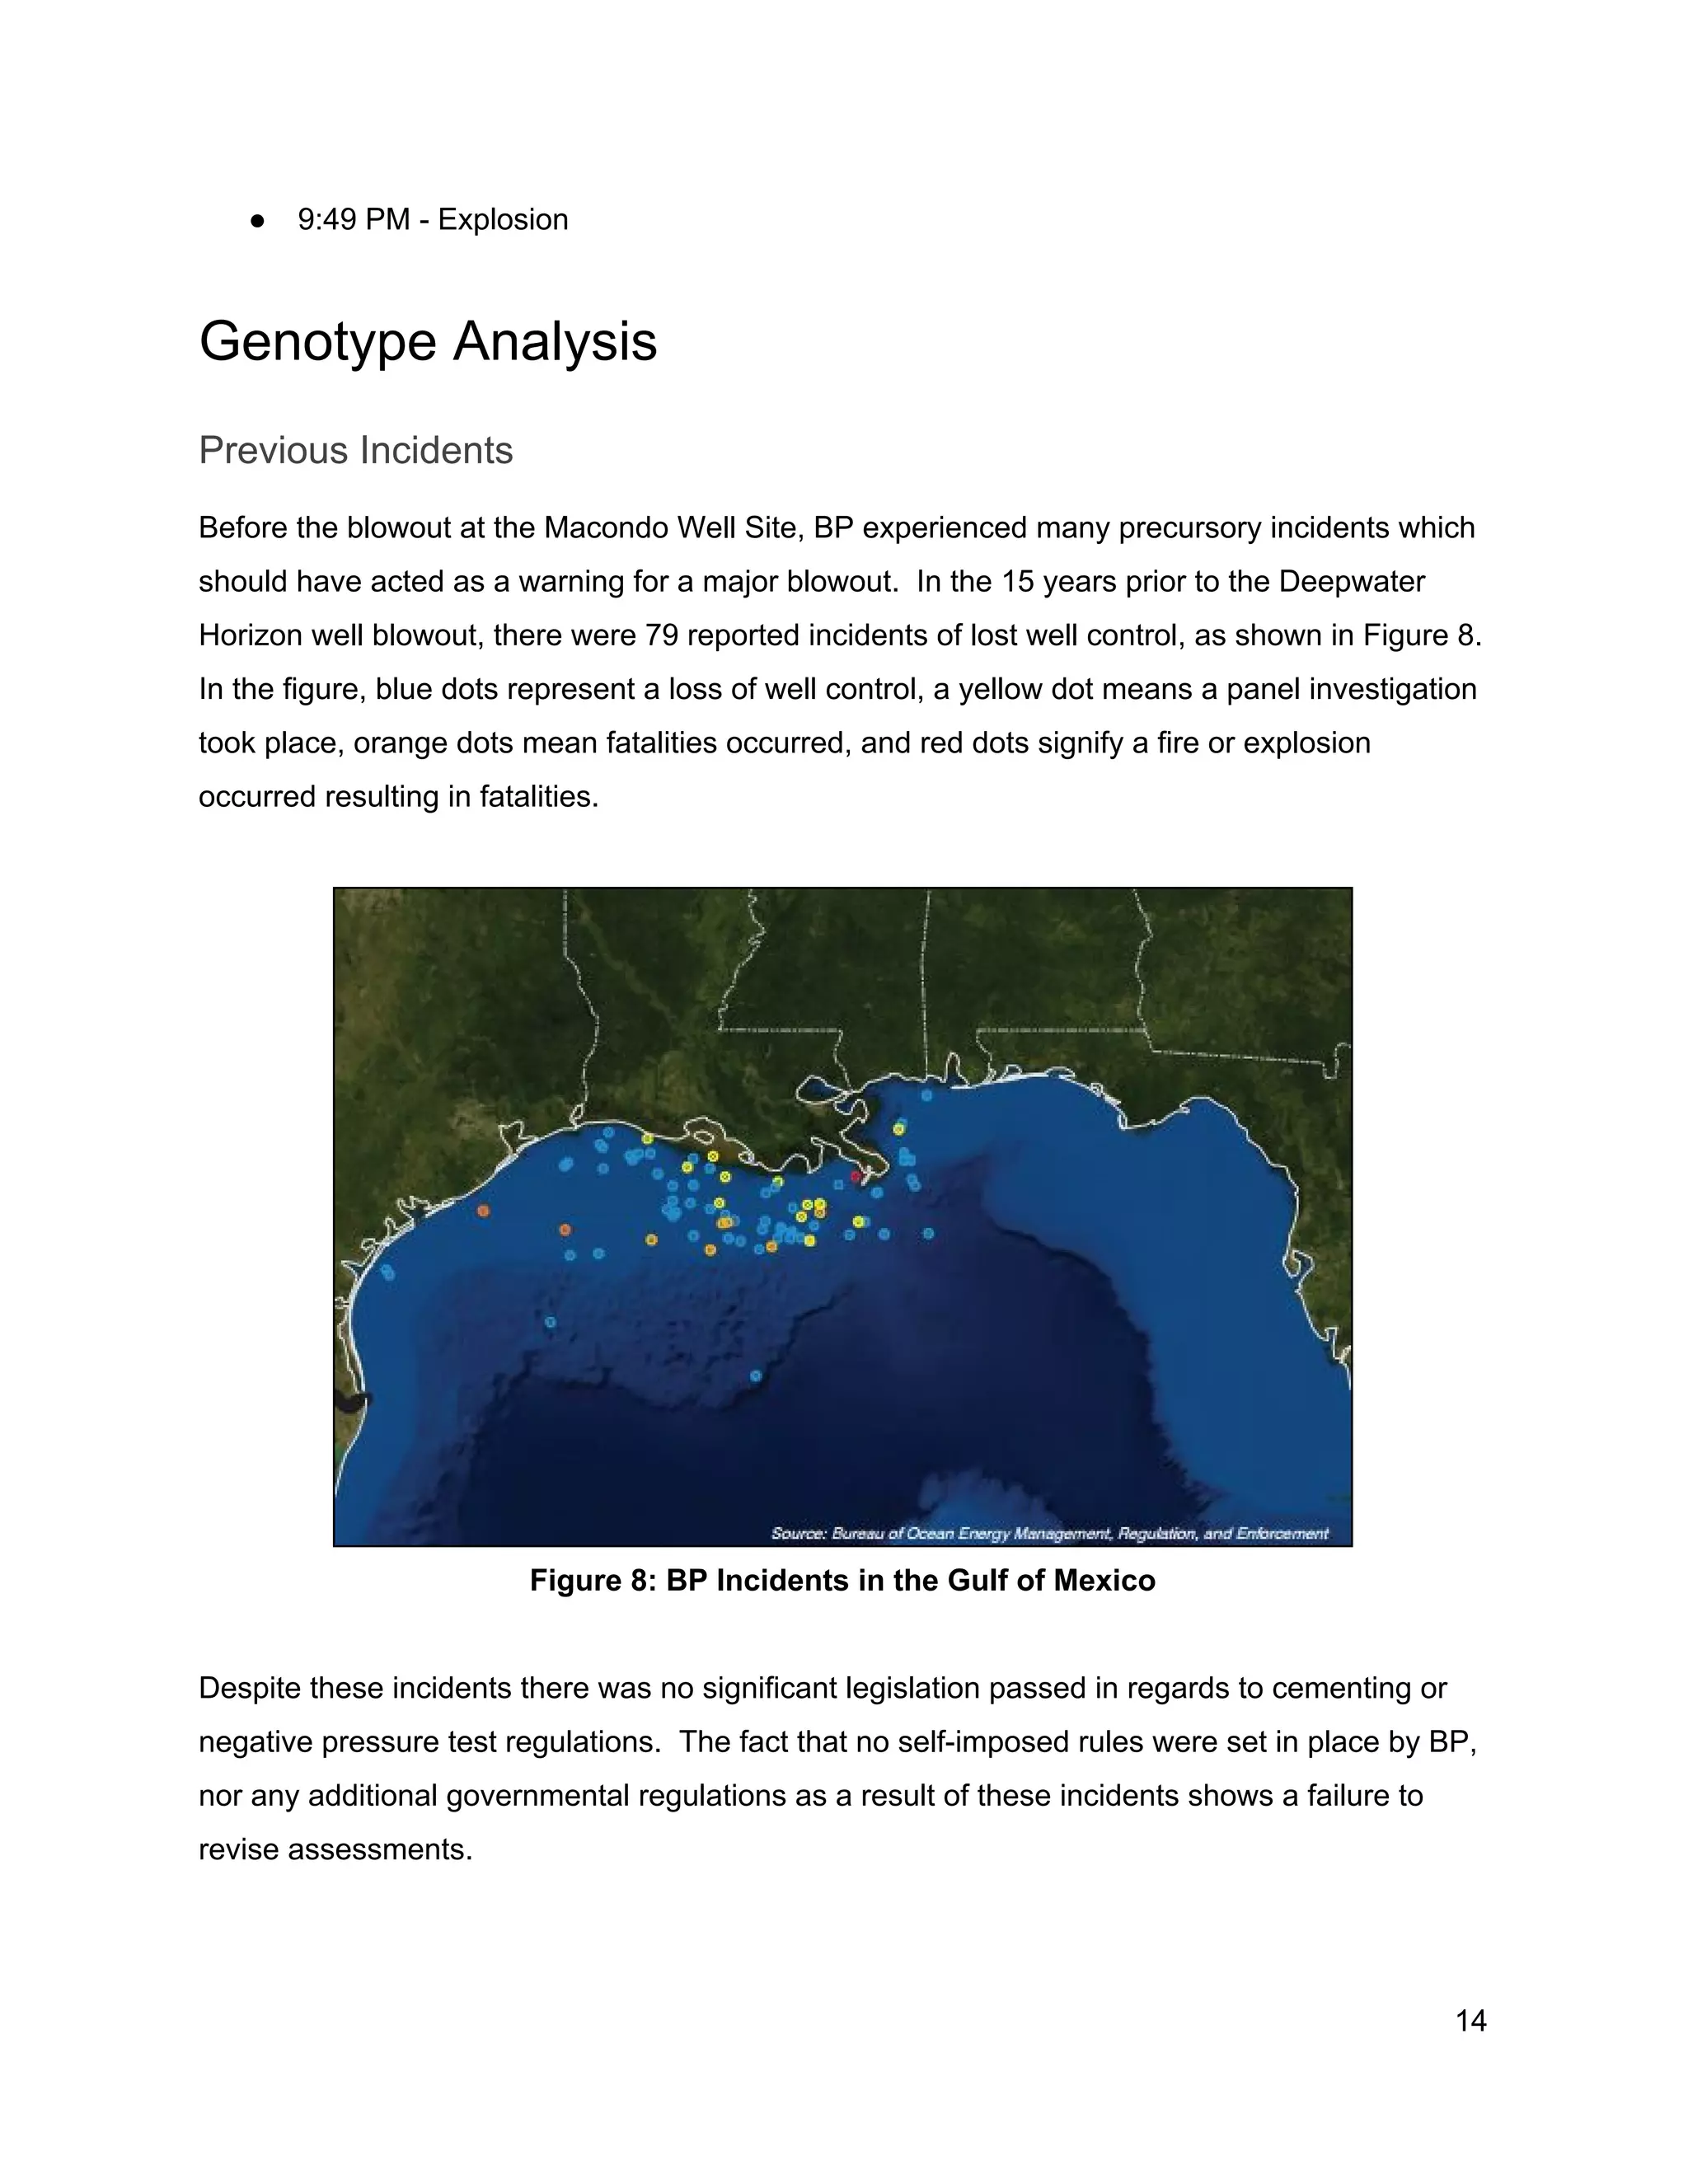
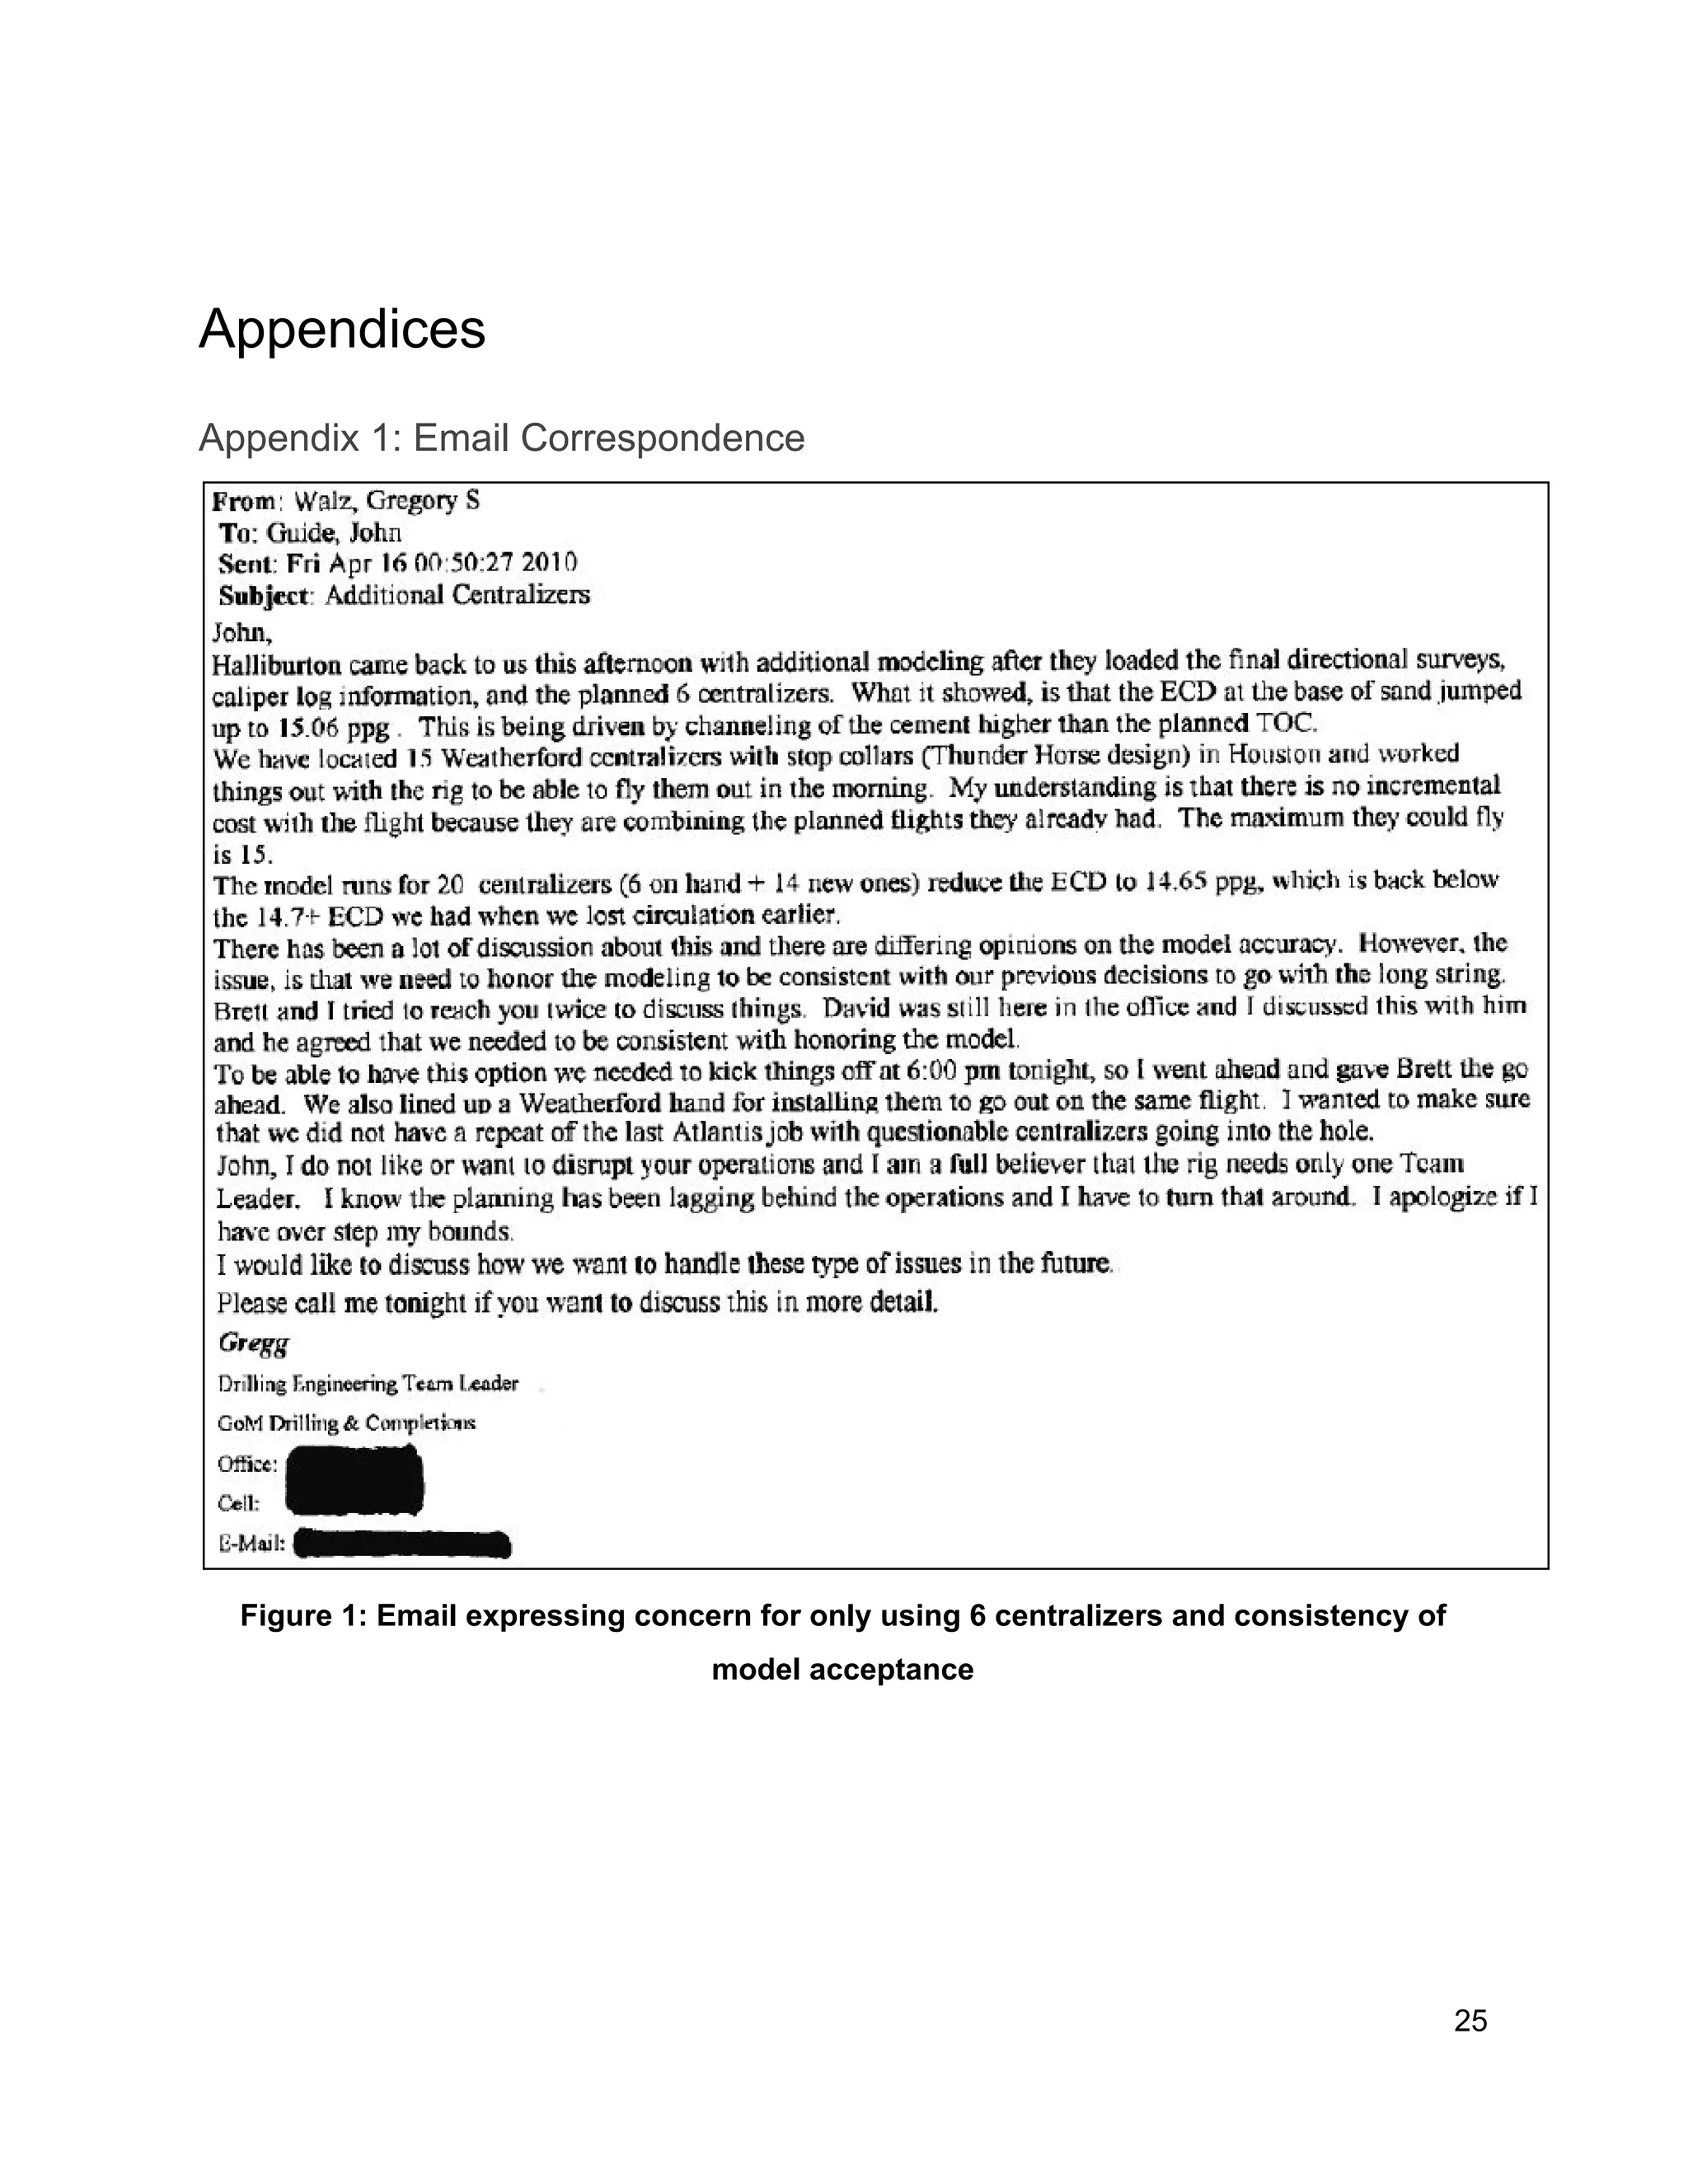
Deepwater Horizon 
Oil Spill Disaster 


Evan Harvey 
Spenser Schwabe 
Robert Slack 
Cole Swartwood 
Katie White 


Table of Contents 
Page 
Introduction 3 
The Deepwater Horizon Oil Rig 3 
The Macondo Prospect 4 
Phenotype Description 4 
Lost Circulation Event 4 
Long String Casing 5 
Centralizers 6 
Cementing Process 7 
Temporary Abandonment 9 
Pressure Tests 10 
Countdown to Failure 11 
The Explosion 12 
Timeline 13 
Genotype Analysis 13 
Previous Incidents 13 
Decision Making 15 
Lack of Vigilance 16 
Organizational Culture 17 
Conclusion 19 
Summary 19 
Aftermath 20 
Recommendations 21 
References 23 
Appendices 24 
Appendix 1: Email Correspondence 24 


2 
 
 
Introduction 
On April 20, 2010 at 9:49PM, an explosion occurred on the Deepwater Horizon oil rig.  This 
explosion resulted in the deaths of 11 crew members while many others were severely injured. 
Additionally, over 4 million barrels of oil were emptied into the Gulf of Mexico, greatly impacting 
the environment and ecosystem.  This disaster was caused by a string of system failures but 
can be attributed to a lack of oversight and flawed decision making by BP, Transocean, and 
Halliburton, all of which will be discussed in this paper.  In particular, the topics that will be 
discussed are: 
1. The phenotype description of the disaster, 
2. The genotype analysis of the disaster, 
3. Conclusions regarding the aftermath of the disaster and recommendations for preventing 
future oil industry disasters of this kind. 
The Deepwater Horizon Oil Rig 
The Deepwater Horizon is a $350 million oil rig built by Transocean and made its maiden 
voyage in 2001.  It is a very large rig and its services cost $1 million per day.  The Deepwater 
Horizon was not the original rig that was to drill for oil at the Macondo well where this disaster 
occurred.  The previous rig was relocated in an attempt to avoid the effects of Hurricane Ida 
which was expected to hit the area.  Despite this, the rig still suffered damage from the 
hurricane, which led to its replacement by the Deepwater Horizon.  The drilling at the well would 
have typically been completed by a smaller rig, like the one Deepwater Horizon replaced, 
because it would have been less expensive.  This is why the Deepwater Horizon’s goal was to 
complete the drilling that the previous rig had begun and prepare the well for temporary 
abandonment.  Temporary abandonment makes way for a new rig and involves removing the 
Deepwater Horizon’s riser and blowout preventer.  Unfortunately, the job would never be 
completed.  The Deepwater Horizon already had an accumulation of rig maintenance requests. 
In fact, “a September 2009 BP safety audit had produced a 30­page list of 390 items requiring 
3,545 man­hours of work” (United States, 2011) on the rig.  Additionally, on the date of the 
3 
 
explosion, BP and the Macondo well were almost 6 weeks behind schedule and $58 million over 
budget. 
The Macondo Prospect 
The Deepwater Horizon was to be located in an area known as the Macondo Prospect or the 
Macondo Well.  Although a lot of drilling had been done by BP and other companies in the Gulf 
of Mexico before, this specific location was new to everyone involved, and turned out to be a 
very dynamic and changing environment.  Figure 1 shows where the Macondo Prospect is 
located, about 48 miles off the shore of Louisiana, and at this location the rig would be sitting in 
about 5,000 feet of water.  This location is where BP engineers thought an estimated 50 million 
barrels of oil lie, just underneath the Earth’s surface.   
 
   
Figure 1:  The Location of the Macondo Prospect 
Phenotype Description 
Lost Circulation Event 
On April 9, 2010, the pay zone, the zone of hydrocarbon­bearing rock where oil and gas is 
found in the well, was reached.  BP’s drilling depth objective was 20,200 feet below sea level, 
however before they reached this objective, at 18,193 feet below sea level, the pressure exerted 
by the drilling exceeded the pressure that the formation could withstand.  Drilling mud, used to 
assist with drilling by helping control pressure in the well and stabilizing rock, began to flow into 
the cracks of the formation instead of returning to the rig.  Drilling was stopped in order to fill 
4 
 
these cracks with a thick fluid called “lost circulation pill.”  After this event, BP performed tests 
on the well to determine how much oil and gas may be present.  It was estimated that at least 
50 million barrels of oil were present and that it was worthwhile to retrieve.  In order to do this 
however, a production casing string would have to be installed so that drilling could continue 
without compromising the geologic formation. 
Long String Casing 
Casing is a string of steel tubes used to line the well as drilling advances.  It also controls 
pressure, protects the well structure from the pressure that is exerted by the drilling mud, and 
prevents hydrocarbons from leaking into the well and flowing upwards.   A long string casing is a 
“single continuous wall of steel between the wellhead on the seafloor, and the oil and gas zone 
at the bottom of the well” (United States, 2011).  Prior to the lost circulation event, a long string 
casing was planned to be installed.  The lost circulation event caused them to re­evaluate this 
plan and consider installing a liner instead.  A liner involves two pieces of casing, one shorter, 
low hanging piece and a second piece that is longer and hangs higher (Figure 2).  Halliburton 
Company, an industry leader in foam cementing, was contracted by BP and recommended 
using the liner because they believed it could be cemented more reliably.  However, BP resisted 
this conclusion due to a liner making for a slightly more complex system and it being more leak 
prone.  BP had their in­house engineers re­evaluate the decision to use the liner by Halliburton 
and concluded that the long string casing could in fact be cemented properly, so they switched 
back to this option for casing.  
 
5 
 
 
Figure 2: Long String and Liner Type Casings 
Centralizers 
Centralizers ensure a good cement job by keeping the long string casing centered while the 
cementing process is being carried out.  If an insufficient number of centralizers are used and 
the casing is not centered when it is cemented to the formation, gaps in the structure could 
occur which leads to potential leaking.  This is demonstrated in Figure 3.  BP’s original designs 
called for 16 or more centralizers to be installed, in fact, simulations and calculations specifically 
suggested 21 or more centralizers.   BP team member Brian Morel found that they only had 6 
centralizers in stock, so Halliburton engineer, Jesse Gagliano, performed calculations and 
created models to determine if a successful cement job could be completed with six centralizers. 
These models by Halliburton still suggested 21 centralizers.  Initially, an order was made for 
additional centralizers, but BP team members Brian Morel, John Guide, Gregory Walz, and Brett 
Cocales disagreed.  Morel questioned the validity of these results and Cocales agreed, stating 
in an email that the additional centralizers would only add a small amount of safety.  Walz was 
initially concerned about only using six centralizers and failed to get in touch with the team 
leader, Guide, so gave the go ahead to order the additional centralizers.  In an email to Guide 
he expressed these concerns as well as the need to be consistent in accepting a model’s 
results or not (Appendix 1, Figure 1).  When Guide finally responded, he was not happy about 
the additional time and equipment that would be added to the process if they included the 
additional new centralizers (Appendix 1, Figure 2).  Following this email, Walz agreed with 
6 
 
Guide and changed his mind.  Cocales agreed with the men, stating that it “would probably be 
fine” (Appendix 1, Figure 3) with only six centralizers and the reward was greater than the risk. 
The views of BP’s team to only install the six centralizers overcame the model and Halliburton's 
suggestion to install 21.  BP went against Halliburton, who was hired because of their expertise 
with this process, and was later questioned in court about why they would go against a model in 
the first place.  BP management claimed that it was just a model and not the real thing, further 
stating that from past experiences models are sometimes right and sometimes wrong. 
 
 
Figure 3: Demonstration of Centralizers 
Cementing Process 
Prior to cementing the casing in place, the crew should have completed what is referred to as a 
“bottoms up” process.  This means that enough drilling mud would be circulated so mud that 
was originally at the bottom of the well came back to the top.  Not only does this allow the mud 
to be tested for hydrocarbons to make sure no leaking has occurred, but also cleans the 
wellbore and reduces the risk of channeling.  However, the crew chose not to fully circulate the 
mud, only spending 30 minutes on a process that should have taken 6­12 hours and only 
pumping 350 barrels of mud rather than the recommended 2,760 barrels. The crew made this 
decision to not fully circulate the mud, therefore not performing the standard “bottoms up” 
procedure because they feared the more time they spent circulating the mud, the greater the 
7 
 
risk of cracks occurring in the formation, as in the lost circulation event, and the greater the risk 
of lost returns.  This was a decision that favored production and time over safety. 
 
Once the cementing process begun, four distinct decisions were made, which, in hindsight, 
turned out to be very costly.  The first was to pump the cement down the well at a low rate. 
Pumping at a higher rate improves efficiency, so it would seem based off of BP’s past decisions 
favoring time that they would have pumped the cement quickly. However, BP’s first priority was 
not risking lost returns, and based off of previous events such as the lost circulation event, they 
feared that the increased pressure from pumping the cement at a higher rate might increase the 
risk of lost returns.  Therefore, they only pumped the cement down the well at a rate of four 
barrels or less per minute, significantly lower than industry standards. 
 
Secondly, BP elected to pump a less than optimal volume of cement down the well.  Pumping 
more cement would have lessened the risk of contamination and errors in placement which 
could compromise the cement job.  More cement would have submitted the fragile geologic 
formation to more pressure, which is why they decided to limit the volume of cement. 
Additionally, as a result of BP limiting the amount of cement they used in the well, they did not 
meet their own standards for how high the cement column should reach in the well.  BP’s 
internal guidelines state that the top of the cement column should be at least 1,000 feet above 
the highest hydrocarbon bearing zone.  The actual cement column in the Macondo well only 
reached 500 feet above this zone, half of the required height.  Both BP and Halliburton 
engineers agreed that the 60 barrels of cement that they decided to pump down the well would 
provide little margin for error, however, they chose to proceed with their decision. 
 
The third poor decision made regarding the cement was choosing to use nitrogen foam cement. 
This cement contains bubbles of nitrogen gas and would reduce the pressure exerted on the 
formation.  This was a relatively new type of foam cement that Halliburton was working with and 
BP had no prior experience with cement of this type.  Two tests on this nitrogen foam cement 
were performed in February, prior to being used by the Deepwater Horizon, however, these 
tests concluded that this cement was unstable.  In fact, the cement failed more severely in the 
first test than the second and these results from the first test were never shared with BP.  On 
April 13, once details of the conditions of the well were clearer, Halliburton conducted another 
test on the cement and the results once again revealed that this cement would be unstable. 
8 
 
Halliburton did not share the results of this test to BP either and instead performed a second 
test on April 18, two days before it would be used at the site.  These tests typically take 48 
hours to complete and it is believed that Halliburton had completed the cement job and 
produced the results before the test was complete.  In fact, BP did not receive the results from 
this final test until six days after the blowout, on April 26, 2010. 
 
Finally, the cement job was completed at 12:40AM on April 20, 2010.  At 7:30AM that morning, 
the BP management team met and decided that the cement job went well enough to send home 
a team from Schlumberger whose job was to perform a cement bond log test.  A cement bond 
log is intended to evaluate the integrity of cement job by measuring how well the cement has 
bonded to the formation and the casing in the well.  It would also identify whether any 
channeling had occurred as well as its location.  The Schlumberger team had already been on 
the rig for a day when BP sent them back to shore.  By electing to not perform the test, BP 
saved time and over $160,000. 
Temporary Abandonment 
Following the completion of the cement job, the crew began the temporary abandonment 
procedures.  As previously mentioned, temporary abandonment involves sealing the well and 
removing the rig’s riser and blowout preventer so that a different rig can perform the extraction 
of the oil and natural gas from the reserve.  Figure 4 provides a visual of what the well looks like 
before and after this process.  The temporary abandonment procedures are as follows, which 
the crew would never be able to complete (United States, 2011): 
1. Perform a positive­pressure test to test the integrity of the production casing; 
2. Run the drill pipe into the well to 8,367 feet (3,300 feet below the mud line); 
3. Displace 3,300 feet of mud in the well with seawater, lifting the mud above the BOP and 
into the riser; 
4. Perform a negative­pressure test to assess the integrity of the well and bottom­hole 
cement job to ensure outside fluids (such as hydrocarbons) are not leaking into the well; 
5. Displace the mud in the riser with seawater; 
6. Set the surface cement plug at 8,367 feet; and 
7. Set the lockdown sleeve. 
 
9 
 
 
Figure 4: Before (left) and After (right) Temporary Abandonment 
Pressure Tests 
The first two steps in the temporary abandonment procedures are to perform a positive pressure 
test followed by a negative pressure test.  The positive pressure test evaluates the ability of the 
casing to hold in pressure.  This test is similar to pumping air into a bike tire and seeing if any air 
leaks out.  In the case of an oil well, however, fluids are pumped in to increase pressure and 
then observed to see if it is able to remain constant.  The positive pressure test began at noon 
on April 20, 2010, by pumping enough fluids into the well to set the pressure at 250 psi.  After 
five minutes of the pressure holding at this level, the pressure was increased to 2,500 psi and 
observed for 30 minutes.  The pressure held and the positive pressure test was declared a 
success. 
 
Following the success of the positive pressure test, the crew began the negative pressure test 
at 5:00PM the same day.  The negative pressure test also evaluates the integrity of the casing, 
but ensures that outside fluids and hydrocarbons will not leak into the well.  This involves 
removing fluids from the well, thereby decreasing the pressure, and making sure no fluids leak 
in.  This simulates removing the drilling mud, replacing it with seawater because it exerts less 
pressure, and removing the riser from the well in order for temporary abandonment to be 
successfully completed.  After the drilling mud is removed, the drill pipe is opened to bleed off 
any additional pressure present in the well until it reaches zero psi.  Next, the well is observed to 
ensure no fluids flow up the well and the pressure does not build back up.  When the crew first 
performed the negative pressure test on the day of the explosion, the pressure reached 266 psi 
10 
 
rather than zero psi and then jumped up to 1,260 psi.  It was believed that the annular 
preventers were not close entirely, as shown in Figure 5.  The test was performed a second and 
third time, with the pressure reaching zero psi but increasing again for each of these attempts. 
The BP Well Site Leader, Don Vidrine, insisted on performing the test a fourth time but this time 
monitoring the kill line pressure.  The kill line is another pipe that runs from the rig to the BOP 
and whose pressure should be identical to that of the drill pipe.  When the test was performed 
this fourth and final time, the kill line pressure reached and remained at zero psi, however, the 
drill pipe pressure was 1,400 psi.  The well site leaders and crew never reconciled this 
discrepancy and declared the test a success, which would later be deemed a huge mistake. 
 
 
Figure 5: Initial Negative Pressure Test with Annular Preventers Not Completely Closed 
Countdown to Failure 
After performing the positive and negative pressure tests and declaring each of them a success, 
the crew began the fifth step in the temporary abandonment process.  This step involves 
displacing the drilling mud and spacer from the riser so that the cement plug can be set, the 
lockdown sleeve installed, and temporary abandonment completed.  During this process, drilling 
mud that is being removed from the riser is being routed to active pits on the rig where the mud 
is stored.  At this point, crew should also be monitoring for kicks, which are any unplanned 
11 
 
influxes of gas or fluid in the well, as well as monitoring the drill pipe pressure and performing 
visual flow checks.  At 9:01PM, pressure began increasing in the drill pipe, which is represented 
by the red line and green section in Figure 6.  At 9:08PM, the pumps were turned off to perform 
a sheen test, which tests for the presence of hydrocarbons in the drilling mud and spacer fluid 
returning to the rig.  During this time, the pressure in the drill pipe continued to increase 
unnoticed, as indicated in the yellow section of Figure 6.  After a successful sheen test, the 
pumps were turned back on at 9:14PM.  The pressure increase went unnoticed until 9:30PM 
when the crew tried to bleed off the pressure as shown by the red line in Figure 7.  At 9:39PM, 
the pressure suddenly dropped, meaning that a kick had occurred and hydrocarbons were 
pushing drilling mud up the casing and into the well.  Unfortunately this went unnoticed by the 
crew and, combined with failures of automated safety mechanisms, would lead to disaster. 
 
 
Figure 6: Unnoticed Pressure Increase 
 
 
Figure 7: Attempt to Resolve Pressure Increase and Missed Kick Detection 
12 
 
The Explosion 
Following the missed kick detection, mud began spewing onto the Deepwater Horizon rig floor 
between 9:40PM and 9:43PM.  The crew began re­routing this mud into their mud­gas 
separator system and shut the annular preventers in order to shut in the well.  Unfortunately, 
their efforts were futile; they had responded too late and gas was already above the BOP, 
advancing up the riser toward the rig.  At 9:49PM, the first explosion occurred.  Crew members 
on the bridge tried to activate the blind shear ram, which would have severed the drill pipe and 
closed the well, however their Emergency Disconnect System (EDS) did not activate, despite 
the lights on the panel signifying otherwise.  Additionally, the BOP’s automatic deadman system 
should have activated and produced the same intended result, but this failed as well. 
Timeline 
The following is a list of the major events and decisions that lead to the disaster on April 20, 
2010. 
● 12:40 AM ­ Cement job completed 
● 7:30 AM ­ Decision made to not perform cement bond log test 
● 10:43 AM ­ Temporary abandonment procedures sent to crew 
● 12:00 PM ­ Positive Pressure Test performed 
● 5:00 PM ­ Negative Pressure Test began 
● 8:00 PM ­ Incorrectly concluded Negative Pressure Test as successful 
● 8:02 PM ­ Annular preventer was opened to begin displacing mud from riser and routing 
this mud to the active pits.  Kick monitoring should have also been occurring. 
● 9:01 PM ­ Drill pipe pressure began increasing 
● 9:08 PM ­ Pumps turned off to perform “sheen” test but the pressure kept increasing 
● 9:14 PM ­ Pumps turned back on 
● 9:30 PM ­ Pressure increase just now noticed, so crew tried to bleed off the extra 
pressure but it rose again. 
● 9:39 PM ­ The pressure dropped but this was a bad sign because it meant that 
hydrocarbons were pushing drilling mud up and into well. 
● 9:40 PM ­ Drilling mud began spewing on rig floor and was routed to diverter system 
● 9:41 PM ­ Annular preventer closed to isolate well but gas was already above BOP 
13 
 
● 9:49 PM ­ Explosion 
Genotype Analysis 
Previous Incidents 
Before the blowout at the Macondo Well Site, BP experienced many precursory incidents which 
should have acted as a warning for a major blowout. ​ ​In the 15 years prior to the Deepwater 
Horizon well blowout, there were 79 reported incidents of lost well control, as shown in Figure 8. 
In the figure, blue dots represent a loss of well control, a yellow dot means a panel investigation 
took place, orange dots mean fatalities occurred, and red dots signify a fire or explosion 
occurred resulting in fatalities. 
 
 
Figure 8: BP Incidents in the Gulf of Mexico 
 
Despite these incidents there was no significant legislation passed in regards to cementing or 
negative pressure test regulations.  The fact that no self­imposed rules were set in place by BP, 
nor any additional governmental regulations as a result of these incidents shows a failure to 
revise assessments.  
 
14 
 
Another previous incident was experienced by Transocean in the North Sea only four months 
prior to the Deepwater Horizon blowout.  This incident was described to be eerily similar to 
Macondo blowout, however, they were able to close the well in time before a blowout occurred. 
As a response to this incident Transocean created an internal PowerPoint and even sent out an 
operations advisory to some of its rigs, yet this information never made its way to the crew 
aboard Deepwater Horizon.  Had the crew had knowledge of this incident and how to handle it, 
it was said, “the events at Macondo may have unfolded very differently” (United States, 2011). 
The fact that this information never made its way to the Deepwater Horizon represents a failure 
to revise assessments as well as an overconfidence bias. Transocean failed to revise a 
mis­assessment despite new information they received.  This new information should have been 
made available to the members of the crew aboard Deepwater Horizon.  An overconfidence 
bias was also apparent, as the members of Transocean’s management and safety team did not 
feel it was necessary to make this information available to all of its rigs. 
Decision Making 
Many decisions were made that greatly contributed to the disaster.  One of the first poor 
decisions made was to install six centralizers rather than the recommended 21 based off of 
models and calculations.  Emails were circulated addressing the centralizers, John Guide 
expressed concern about ordering additional centralizers because they would add ten hours to 
the installation time (Appendix 1, Figure 2).  With BP being behind schedule, they chose to 
install less centralizers for the sake of time.  There was also a breakdown in crosschecks for 
they ignored the results of calculations and simulations.  This is an example of fragmented 
problem solving influencing their decision making.  In a situation such as this one, one coherent 
decision to accept the results of simulations should have been established.   Additionally, in an 
email from Brett Cocales to Brian Morel, in regards to only installing six centralizers, Cocales 
stated, “who cares, it’s done, end of story, will probably be fine and we’ll get a good cement job” 
(Appendix 1, Figure 3).  This is an example of overconfidence bias influencing decision making. 
Cocales was overconfident in the abilities of the centralizers, despite new information showing 
they may fail.  To that extent, it is also a prime example of cognitive tunneling.  
 
BP also made the decision to not fully circulate the drilling mud prior to cementing the well 
casing in place.  Fully circulating the drilling mud, or performing the “bottoms up” process as 
15 
 
previously mentioned, would have allowed the mud to be tested for the presence of 
hydrocarbons, cleared any debris, and prevented contamination of the cement.  Fully circulating 
the mud would have taken 12 hours.  Once the cementing process began, BP also chose to 
pump a low volume of cement at a low rate down the well when they should have pumped more 
cement at a quicker rate.  Each of these decisions represent a drift toward failure. 
 
BP also decided against performing a cement bond log test prior to the completion of the 
cement job.  The cement bond log test would have ensured the cement had bonded well to the 
formation, however, would have taken 9­12 hours and cost about $30 million.  Once again, BP 
made decisions that would reduce the time and money spent, further drifting toward failure. 
 
Once the cementing process was completed, the crew on the rig began the temporary 
abandonment procedures.  Problems arose when they began the negative pressure test.  The 
test was taking much longer due to unusual pressure readings.  The drill pipe pressure should 
have been reaching zero psi but, after two attempts, it kept rising.  It was assumed that the 
problem involved the kill line and performed the test again measuring the kill line pressure.  The 
kill line pressure reached zero psi, however, the drill pipe pressure still was not. There was a 
lack of sensitivity to operations because the crew lacked situational awareness during this time, 
failing to identify the reason behind the pressure discrepancies and make necessary 
adjustments.  The crew also fell victim to generating a limited number of hypothesis, assuming 
the problem was with the kill line pressure and suggesting no other alternatives.  The negative 
pressure test should have been declared a failure and the readings should have alerted the 
crew that hydrocarbons were potentially pushing up the drilling mud and moving up the well. 
However, the negative pressure test was declared a success, for they had no preoccupation 
with failure, and they proceeded with temporary abandonment.  If the crew had been 
preoccupied with failure, they would have thoroughly analyzed the pressure readings so that 
they could ensure a successful and safe operation. 
Lack of Vigilance 
During the temporary abandonment procedure, especially during the negative pressure test, 
monitoring for kicks is very important.  A missed detection of one of these kicks played a big role 
in the eventual blowout of the well.  Many organizational and human factors lead to the missed 
16 
 
detection of this kick.  The operators that were in charge of monitoring for kicks during this very 
important procedure worked arduous 12 hour shifts and had three screens to simultaneously 
monitor.  Not only did the operators have to monitor multiple screens, but the displays showed 
information using different graphs and techniques, making it difficult for the operators to follow 
and going against Wicken’s Principle of Consistency.  Pictures of the actual screens that were 
used to monitor for kicks on Deepwater Horizon are shown in Figures 9 and 10.  
 
Figure 9: Screen 1 
 
 
Figure 10: Screen 2 
 
Once a kick was detected it was this same operator’s job to get to the well and shut it off.  A 
major organizational failure was the fact there was no alarm system in place to alert the 
17 
 
operator of an influx of hydrocarbons which would result in a kick.  As a result of this, the 
operator had to be continuously monitoring the screens for the duration of the procedure in 
order to detect a kick.  All of the jobs this one operator has to perform and the multiple displays 
they have to monitor brings up the heuristic of attention to limited number of cues.  There is a 
limitation in the working memory for every person, and it was tested for this operator. 
Organizational Culture 
The organizational culture of BP, as well as Halliburton and Transocean to a degree, played a 
big role in the events that led up to the blowout.  A few weeks before the blowout occurred a 
safety interview was conducted with members of the crew which indicated that 46% of workers 
on the rig felt that some workers feared reprisals for reporting unsafe work conditions or 
situations.  This fact presents the possibility of a pathological culture in place on the rig.  
 
There was also evidence of a breakdown at the boundaries occurring with the management in 
charge of Deepwater Horizon.  This is evidenced by Figure 11, showing the important decisions 
being made by BP management not located on the rig.   


18 
 
Figure 11: Decision Making Responsibilities 
 
Many of these decisions were made without ever consulting the crew members working on the 
rig.  The people with the technical expertise had no say in the decision making which is a 
textbook case of a breakdown at the boundaries.  The crew who worked with the equipment and 
had knowledge of how it was operating should have had a say in the decisions being made 
about it. 
 
After the blowout, BP took the initiative to conduct its own accident report. However, in response 
to this report, Dr. Najmedin Meshkati of the University of Southern California released a 
statement criticizing BP of neglecting to “address human performance issues and organizational 
factors...”  He added that BP’s investigation also ignored factors such as fatigue, long shifts, and 
the company’s poor safety culture (United States, 2011).  This is indicative of the fact that BP 
was reported to stress personal safety in situations where process safety was the real issue. 
This also brings into question if Deepwater Horizon, and other oil rigs like it, should operate 
under HRO Principles similar to the nuclear industry and naval carrier ships.  The repercussions 
of an accident are extremely severe and the safety measures currently in place do not represent 
this. 
Conclusion 
Summary 
The Deepwater Horizon Oil Spill disaster occurred as the result of many small failures and 
contributing events and can be best represented using the Swiss Cheese Model.  The Swiss 
Cheese Model is comprised of defensive layers, or slices, but each of these layers have defects 
or holes that allow for accidents to occur (Riggs, 2016).  Applying the Swiss Cheese Model to 
the Deepwater Horizon Oil Spill Disaster, the layers would include: 
● Well Casing​.  A less risky option for lining the well was available; however, BP chose to 
the Long String Casing option because it was less complex, even though it could not be 
cemented as reliably. 
● Centralizers​.  BP elected to install six centralizers rather than the 21 that calculations 
and models deemed necessary in order for a proper cement job to be completed. 
19 
 
● Ignoring simulations​.  BP ignored calculations and models created by Halliburton, an 
industry leader in the cementing process, in regards to both the well casing and 
centralizer decisions. 
● Not performing “bottoms up” process​.  This test was vital for ensuring that the casing 
was cemented properly, no hydrocarbons were present, and there were no cracks where 
leaks could occur, however, BP elected to not perform this process. 
● Not performing the cement bond log test​.  The cement bond log test would have tested 
the integrity of the cement job after it was completed, however, once again, BP elected 
not to perform this test. 
● Missed kick detection​.  While performing the procedures for temporary abandonment, 
the crew should have also been monitoring for kicks.  The crew failed to detect the 
occurrence of a kick, which ultimately lead to the occurrence of the blowout. 
● Blind shear ram failure​.  Even though it was too late, due to the missed kick detection, by 
the time the blind shear ram was activated to close off the well, the blind shear ram failed 
to activate despite the necessary procedures being performed.  This failure was due to 
electronic and automatic failures in the system. 
● Time and money pressures​.  BP was already behind schedule and over budget by the 
time the Deepwater Horizon arrived at the Macondo Well in the Gulf of Mexico so many 
of the decisions made favored time, money, and reducing the risk of lost returns of oil 
and gas rather than safety. 
Aftermath 
After many failed attempts, the well was finally sealed on July 15, 2010.  All in all, over the 
course of 87 days, over 205 million gallons of crude oil had spilled into the Gulf of Mexico. 
When President Obama addressed the nation on June 15, 2010, one month before the well was 
sealed, he proclaimed, “This oil spill is the worst environmental disaster America has ever faced 
(United States, 2011).”  The impacts it had on the environment and surrounding communities 
and economies are still being felt to this day.  To go along with the 11 human lives lost in the 
explosion, 800,000 birds and 1,000 dolphin deaths were directly linked to the spill.  Fisheries 
losses totaled over $170 million and the tourism losses in the surrounding states was nearly 
$700 million.  Communities in Louisiana felt the losses the hardest and are still living with it. 
Randy Borne, a native crabber in the southern part of the state was interviewed in 2015 and 
20 
 
said in his thick Cajun accent, “Every year is worse and worse. I'm hardly catching nothing” (BP 
Lasting Economic Toll, 2015).  Prior to the spill, he was hauling in nearly 70 crates of crabs a 
day, now that number is down to about 12.  To this day there is still an estimated 26 million 
gallons of oil on the seafloor. 
 
With all of these damages came astronomical costs of retribution for BP.  After all was said and 
done they paid an estimated $32 billion in cleanup, legal fees, and fines.  It is the single largest 
criminal fine on record.  Of the $32 billion, $14 billion went to containing and cleaning up the 
spill and over $5 billion went to settling individual claims of the affected individuals and 
businesses.  To go along with the monetary damages, the two highest ranking officials at BP 
were also charged with seaman’s manslaughter as well as involuntary manslaughter for each of 
the 11 men killed in the explosion. 
 
Surprisingly, there were no legislative changes to offshore drilling as a result of the blowout. 
Despite the lax laws in place, over 1,500 oil drilling permits have been granted in the Gulf since 
the blowout.  However, BP did react to the spill by putting in place new oil spill exercises, 
investing in oil spill response technology, as well as technology to improve operating discipline 
and safety.   
Recommendations 
In response to the Macondo well blowout, BP took a look at their internal operating procedures 
as well as the procedures of their contract customers in what was known as the Bly Report.  The 
Bly Report contained 26 recommendations for future drilling some of which were: 
● “​Update and clarify current practices to ensure that a clear and comprehensive set of 
cementing guidelines are available.​”  The guidelines for the cementing process aboard 
the Deepwater Horizon were extremely insufficient.  The new guidelines will require 
clearly defined mandatory practices as well as a description of the technical authority’s 
role in oversight and decision making.   
● “​Update practice on pressure, including contingency and testing procedures.​”  This 
recommendation addresses the downfalls that occurred during  the negative pressure 
test aboard the Deepwater Horizon.  The report states that standard operating 
21 
 
procedures should include:  all operational steps and decision points, clearly defined 
success/failure criteria, authorization instructions, and a contingency plan of action.  
● “​Develop an advanced deepwater well control training programme that supplements 
current industry and regulatory training.​”  The training programme should include lessons 
learned from the Deepwater Horizon blowout and require attendance from all staff 
directly involved in well operations, including management and engineering both 
onshore and offshore.  The programme should also include teachings from outside the 
company, broadening knowledge and promoting the sharing of information.  
● “​Strengthen BP's requirements for BOP testing by drilling contractors, including 
emergency systems.​”  Playing such an integral role of the temporary abandonment 
procedure, the BOP must be held to strict standards.  The report outlines the minimum 
requirements it must achieve, strengthening the current requirements.  It incorporates 
minimum requirements for ram types, numbers, and capability as well as requirements 
for the well control activation systems.   
To date, BP has completed all 26 of the recommendations outlined in the report (Bly Report, 
2014).   
 
In addition to the recommendations outlined in the Bly Report, the team believes BP and other 
drilling companies like it should impose a few additional standards of operating procedures. 
Requiring better reporting of near misses and incidents, as well as providing protection for 
whistleblowers would provide a safer overall corporate environment.  Requiring a spill response 
plan prior to drilling would ensure a quicker and more efficient clean up if a spill did occur.  And 
lastly, having drilling rigs operate as highly reliable organizations similar to the nuclear industry, 
aviation, and naval aircraft carriers would improve safety for the rig workers, the surrounding 
communities, and the wildlife in the area.   
 
 
22 


23 
 
 
References  
 How Do Drilling Fluids Work? (n.d.). Retrieved March 30, 2016, from 
http://www.rigzone.com/training/insight.asp?insight_id=291  
 
Ingersoll, C., Locke, R. M., & Reavis, C. (2012). BP and the Deepwater Horizon Disaster of 
2010. ​MITSloan Management,​ 1­28. Retrieved March 30, 2016, from 
https://mitsloan.mit.edu/LearningEdge/CaseDocs/10 110 BP Deepwater Horizon 
Locke.Review.pdf.  
 
Riggs, Sara. “Linear and Latent Failure Models.” 2 Mar. 2016. 
 
United States., National Commission on the BP Deepwater Horizon Oil Spill and Offshore 
Drilling. (2011). ​Deep water the Gulf oil disaster and the future of offshore drilling: Report to 
the President​. Washington, D.C.: U.S. G.P.O. Retrieved March 28, 2016, from 
http://www.sciencedirect.com/science/article/pii/S0951832011002651  
 
"BP Oil Spill Has Lasting Economic Toll Five Years After Deepwater Horizon Explosion."  
International Business Times​. N.p., 16 Apr. 2015. Web. 24 Apr. 2016. 
 
"The Bly Report Recommendations." ​Bp.com​. British Petroleum, Dec. 2014. Web. 25 Apr. 2016. 


24 
 
 
Appendices 
Appendix 1: Email Correspondence 
 
Figure 1: Email expressing concern for only using 6 centralizers and consistency of 
model acceptance 
25 
 
 
Figure 2: Email expressing time concerns and additional pieces of equipment 
 
 
Figure 3: Email stating it “will probably be fine”  and reward is greater than risk 
 
26 

CaseStudyFinalReport.docx