Download to read offline

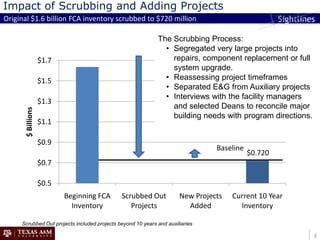
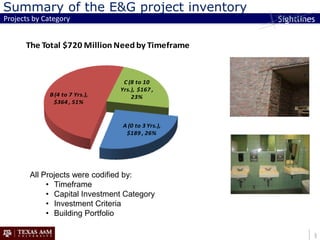
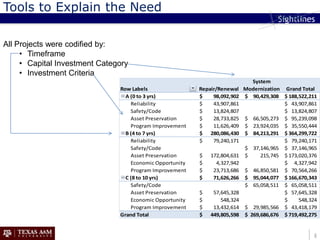
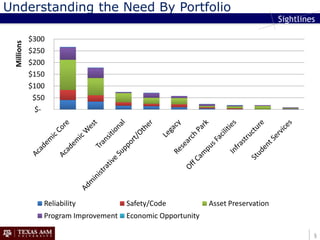
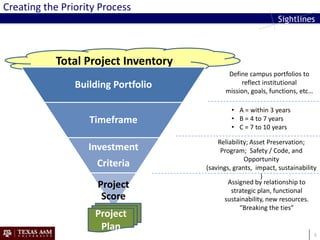
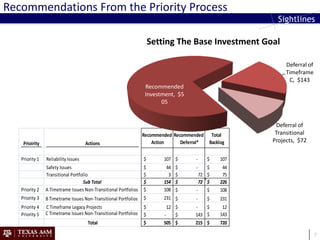
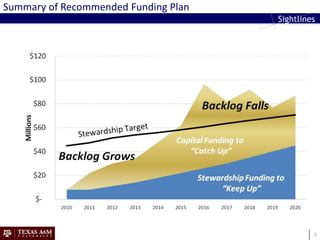


The document discusses Texas A&M's approach to reducing its deferred maintenance backlog. It originally totaled $1.6 billion but was scrubbed down to $720 million by removing projects beyond 10 years and separating E&G from auxiliary projects. The $720 million need was categorized by timeframe (0-3 years, 4-7 years, 8-10 years), investment criteria, and building portfolio. A priority process was recommended to set investment goals, fund the highest priority projects within 3 years for safety and reliability, and defer some projects between 7-10 years to reduce the backlog to a recommended funding level of $505 million.


![Developing the Capital Plan is Only Half the Battle [ERAPPA 2017]](https://cdn.slidesharecdn.com/ss_thumbnails/erappa2017developingthecapitalplanisonlyhalfthebattle-171023173415-thumbnail.jpg?width=640&height=640&fit=bounds)
![The State of Housing Facilities: Trends & Best Practices [ACUHO-i/APPA 2017]](https://cdn.slidesharecdn.com/ss_thumbnails/acuhoiappastateofhousingfacilities-trendsandbestpractices-171018200515-thumbnail.jpg?width=640&height=640&fit=bounds)
![More with Less: Five Strategies for Facilities Success [MAPPA-CAPPA 2017]](https://cdn.slidesharecdn.com/ss_thumbnails/sightlinesuntmappacappa2017presentationvpresented-171018192031-thumbnail.jpg?width=640&height=640&fit=bounds)


