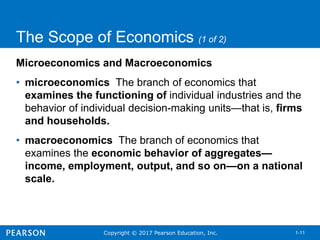
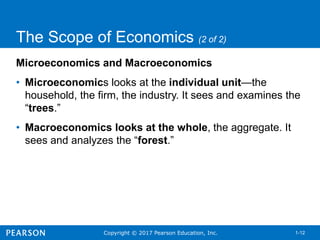
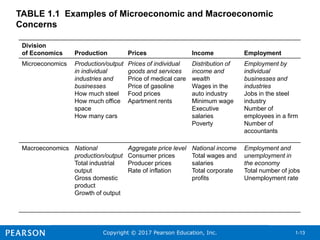
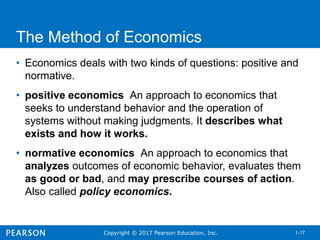
Copyright © 2017 Pearson Education, Inc. 1-1
Principles of Economics
Twelfth Edition(2 of 2)
Chapter 1
The Scope and
Method of Economics
Copyright © 2017 Pearson Education, Inc. 1-2
Chapter Outline and Learning Objectives
(1 of 2)
1.1 Why Study Economics?
• Identify three key reasons to study economics. Think of an example
from your life in which understanding opportunity costs or the
principle of efficient markets could make a difference in your decision
making.
1.2 The Scope of Economics
• Describe microeconomics, macroeconomics, and the diverse fields of
economics.
Copyright © 2017 Pearson Education, Inc. 1-3
Chapter Outline and Learning Objectives
(2 of 2)
1.3 The Method of Economics
• Think about an example of bad causal inference leading to erroneous
decision making. Identify the four main goals of economic policy.
Appendix: How to Read and Understand Graphs
• Understand how data can be graphically represented.
Copyright © 2017 Pearson Education, Inc. 1-4
Chapter 1 The Scope and Method of
Economics
• economics The study of how individuals and societies
choose to use the scarce resources that nature and
previous generations have provided.
• The key word in the definition is choose.
• Economics is a behavioral, or social, science.
• Economics is the study of how people make choices.
Copyright © 2017 Pearson Education, Inc. 1-5
Why Study Economics?
To Learn a Way of Thinking
• Economics has three fundamental concepts:
– Opportunity cost
– Marginalism
– Efficient markets
Copyright © 2017 Pearson Education, Inc. 1-6
To Learn a Way of Thinking (1 of 3)
Opportunity Cost
• opportunity cost The best alternative that we forgo, or
give up, when we make a choice or decision.
• scarce Limited.
Copyright © 2017 Pearson Education, Inc. 1-7
To Learn a Way of Thinking (2 of 3)
Marginalism
• marginalism The process of analyzing the additional or
incremental costs or benefits arising from a choice or
decision.
Copyright © 2017 Pearson Education, Inc. 1-8
To Learn a Way of Thinking (3 of 3)
Efficient Markets—No Free Lunch
• efficient market A market in which profit opportunities
are eliminated almost instantaneously.
• The study of economics teaches us a way of thinking and
helps us make decisions.
Copyright © 2017 Pearson Education, Inc. 1-9
To Understand Society
• Industrial Revolution The period in England during the
late eighteenth and early nineteenth centuries in which
new manufacturing technologies and improved
transportation gave rise to the modern factory system
and a massive movement of the population from the
countryside to the cities.
• The study of economics is an essential part of the study of
society.
Copyright © 2017 Pearson Education, Inc. 1-10
To Be an Informed Citizen
• To be an informed citizen requires a basic understanding
of economics.
Copyright © 2017 Pearson Education, Inc. 1-11
The Scope of Economics (1 of 2)
Microeconomics and Macroeconomics
• microeconomics The branch of economics that
examines the functioning of individual industries and the
behavior of individual decision-making units—that is, firms
and households.
• macroeconomics The branch of economics that
examines the economic behavior of aggregates—
income, employment, output, and so on—on a national
scale.
Copyright © 2017 Pearson Education, Inc. 1-12
The Scope of Economics (2 of 2)
Microeconomics and Macroeconomics
• Microeconomics looks at the individual unit—the
household, the firm, the industry. It sees and examines the
“trees.”
• Macroeconomics looks at the whole, the aggregate. It
sees and analyzes the “forest.”
Copyright © 2017 Pearson Education, Inc. 1-13
TABLE 1.1 Examples of Microeconomic and Macroeconomic
Concerns
Division
of Economics Production Prices Income Employment
Microeconomics Production/output
in individual
industries and
businesses
How much steel
How much office
space
How many cars
Prices of individual
goods and services
Price of medical care
Price of gasoline
Food prices
Apartment rents
Distribution of
income and
wealth
Wages in the
auto industry
Minimum wage
Executive
salaries
Poverty
Employment by
individual
businesses and
industries
Jobs in the steel
industry
Number of
employees in a firm
Number of
accountants
Macroeconomics National
production/output
Total industrial
output
Gross domestic
product
Growth of output
Aggregate price level
Consumer prices
Producer prices
Rate of inflation
National income
Total wages and
salaries
Total corporate
profits
Employment and
unemployment in
the economy
Total number of jobs
Unemployment rate
Copyright © 2017 Pearson Education, Inc. 1-14
TABLE 1.2 The Fields of Economics ( 1 of 3)
Behavioral economics Do aggregate household savings increase when we
automatically enroll people in savings programs and let
them opt out as opposed to requiring them to sign up?
Comparative economic systems How does the resource allocation process differ in
market versus command and control systems?
Econometrics What inferences can we make based on conditional
moment inequalities?
Economic development Does increasing employment opportunities for girls in
developing nations increase their educational
achievements?
Economic history How did the growth of railroads and improvement in
transportation more generally change the U.S. banking
systems in the nineteenth century?
Copyright © 2017 Pearson Education, Inc. 1-15
TABLE 1.2 The Fields of Economics (cont’d 2 of 3)
Environmental economics What effect would a tax on carbon have on emissions?
Is a tax better or worse than rules?
Finance Is high frequency trading socially beneficial?
Health economics Do co-pays by patients change the choice and use of
medicines by insured patients?
The history of economic thought How did Aristotle think about just prices?
Industrial organization How do we explain price wars in the airline industry
Copyright © 2017 Pearson Education, Inc. 1-16
TABLE 1.2 The Fields of Economics (cont’d 3 of 3)
International economics What are the benefits and costs of free trade? Does
concern about the environment change our views of free
trade?
Labor economics Will increasing the minimum wage decrease employment
opportunities?
Law and economics Does the current U.S. patent law increase or decrease
the rate of innovation?
Public economics Why is corruption more widespread in some countries
than in others?
Urban and regional economics Do enterprise zones improve employment opportunities
in central cities?
Copyright © 2017 Pearson Education, Inc. 1-17
The Method of Economics
• Economics deals with two kinds of questions: positive and
normative.
• positive economics An approach to economics that
seeks to understand behavior and the operation of
systems without making judgments. It describes what
exists and how it works.
• normative economics An approach to economics that
analyzes outcomes of economic behavior, evaluates them
as good or bad, and may prescribe courses of action.
Also called policy economics.
Copyright © 2017 Pearson Education, Inc. 1-18
Theories and Models (1 of 5)
• model A formal statement of a theory, usually a
mathematical statement of a presumed relationship
between two or more variables.
• variable A measure that can change from time to time or
from observation to observation.
• Ockham’s razor The principle that irrelevant detail should
be cut away.
Copyright © 2017 Pearson Education, Inc. 1-19
Theories and Models ( 2 of 5)
All Else Equal
• ceteris paribus, or all else equal A device used to
analyze the relationship between two variables while the
values of other variables are held unchanged.
• Using the device of ceteris paribus is one part of the
process of abstraction.
• In formulating economic theory, the concept helps us
simplify reality to focus on the relationships that interest
us.
Copyright © 2017 Pearson Education, Inc. 1-20
Theories and Models (3 of 5)
Expressing Models in Words, Graphs, and Equations
• Graphs and equations capture the quantitative side of
economic observations and predictions.
Copyright © 2017 Pearson Education, Inc. 1-21
Theories and Models (4 of 5)
Cautions and Pitfalls
• Economists are interested in cause and effect, but sorting
out causality from correlation is not always easy.
• post hoc, ergo propter hoc Literally, “after this (in time),
therefore because of this.” A common error made in
thinking about causation: If Event A happens before Event
B, it is not necessarily true that A caused B.
Copyright © 2017 Pearson Education, Inc. 1-22
Theories and Models (5 of 5)
Testing Theories and Models: Empirical Economics
• empirical economics The collection and use of data to
test economic theories.
Copyright © 2017 Pearson Education, Inc. 1-23
Economic Policy ( 1 of 3)
• Four criteria are important in judging economic outcomes:
1. Efficiency
2. Equity
3. Growth
4. Stability
Copyright © 2017 Pearson Education, Inc. 1-24
Economic Policy (2 of 3)
Efficiency
• efficiency In economics, allocative efficiency. An efficient
economy is one that produces what people want at the
least possible cost.
Equity
• equity Fairness.
Copyright © 2017 Pearson Education, Inc. 1-25
Economic Policy ( 3 of 3)
Growth
• economic growth An increase in the total output of an
economy.
Stability
• stability A condition in which national output is growing
steadily, with low inflation and full employment of
resources.
Copyright © 2017 Pearson Education, Inc. 1-26
REVIEW TERMS AND CONCEPTS
• ceteris paribus, or all else equal
• economic growth
• economics
• efficiency
• efficient market
• empirical economics
• equity
• Industrial Revolution
• macroeconomics
• Marginalism
• microeconomics
• model
• normative economics
• Ockham’s razor
• opportunity cost
• positive economics
• post hoc, ergo propter hoc
• scarce
• stability
• variable
Copyright © 2017 Pearson Education, Inc. 1-27
CHAPTER 1 APPENDIX:
How to Read and Understand Graphs
• graph A two-dimensional representation of a set of
numbers or data.
Time Series Graphs
• time series graph A graph illustrating how a variable
changes over time.
Copyright © 2017 Pearson Education, Inc. 1-28
TABLE 1A.1 Total
Disposable Personal
Income in the United
States, 1975–2014 (in
Billions of Dollars)
Year
Total
Disposable
Personal
Income Year
Total
Disposable
Personal
Income
1975
1976
1977
1978
1979
1980
1981
1982
1983
1984
1985
1986
1987
1988
1989
1990
1991
1992
1993
1994
1,219
1,326
1,457
1,630
1,809
2,018
2,251
2,425
2,617
2,904
3,099
3,288
3,466
3,770
4,052
4,312
4,485
4,800
5,000
5,244
1995
1996
1997
1998
1999
2000
2001
2002
2003
2004
2005
2006
2007
2008
2009
2010
2011
2012
2013
2014
5,533
5,830
6,149
6,561
6,876
7,401
7,752
8,099
8,466
9,002
9,401
10,037
10,507
10,994
10,943
11,238
11,801
12,384
12,508
12,981
Source: U.S. Department of Commerce, Bureau of Economic Analysis.
FIGURE 1A.1 Total Disposable Personal
Income in the United States: 1975–2014 (in
Billions of Dollars)
Source: See Table 1A.1.
Copyright © 2017 Pearson Education, Inc. 1-29
Graphing Two Variables
• X-axis The horizontal line against which a variable is
plotted.
• Y-axis The vertical line against which a variable is plotted.
• origin The point at which the horizontal and vertical axes
intersect.
• Y-intercept The point at which a graph intersects the
Y-axis.
• X-intercept The point at which a graph intersects the
X-axis.
Copyright © 2017 Pearson Education, Inc. 1-30
Plotting Income and Consumption Data
for Households
• positive relationship A relationship between two
variables, X and Y, in which a decrease in X is
associated with a decrease in Y and an increase
in X is associated with an increase in Y.
• negative relationship A relationship between two
variables, X and Y, in which a decrease in X is
associated with an increase in Y and an increase
in X is associated with a decrease in Y.
Copyright © 2017 Pearson Education, Inc. 1-31
FIGURE 1A.2 Household
Consumption and Income
Source: See Table 1A.2.
TABLE 1A.2 Consumption
Expenditures and Income, 2012
Average
Income
Before Taxes
Average
Consumption
Expenditures
Bottom fifth
2nd fifth
3rd fifth
4th fifth
Top fifth
$ 9,988
27,585
47,265
75,952
167,010
$ 22,154
32,632
43,004
59,980
99,368
Source: Consumer Expenditures in 2012, U.S. Bureau
of Labor Statistics.
A graph is a simple two-dimensional geometric representation of data. The graph in Figure 1A.2 displays
the data from Table 1A.2.
Along the horizontal scale (X-axis), we measure household income. Along the vertical scale (Y-axis), we
measure household consumption.
Note: At point A, consumption equals $22,154 and income equals $9,988. At point B, consumption
equals $32,632 and income equals $27,585.
Copyright © 2017 Pearson Education, Inc. 1-32
Slope
• slope A measurement that indicates whether the
relationship between variables is positive or negative
and how much of a response there is in Y (the variable
on the vertical axis) when X (the variable on the
horizontal axis) changes.
Copyright © 2017 Pearson Education, Inc. 1-33
FIGURE 1A.3 A Curve with (a) Positive Slope and
(b) Negative Slope
A positive slope indicates that increases in X are associated with increases in Y and that
decreases in X are associated with decreases in Y.
A negative slope indicates the opposite—when X increases, Y decreases; and when X
decreases, Y increases.
Copyright © 2017 Pearson Education, Inc. 1-34
FIGURE 1A.4 Changing Slopes along Curves
Copyright © 2017 Pearson Education, Inc. 1-35
Some Precautions
FIGURE 1A.5 National Income and Consumption
Source: See Table 1A.3.
TABLE 1A.3 Aggregate National Income
and Consumption for the United States,
1930–2014 (in Billions of Dollars)
Aggregate
National Income
Aggregate
Consumption
1930
1940
1950
1960
1970
1980
1990
2000
2010
2011
2012
2013
2014
75
78
215
377
762
2,018
4,312
7,401
11,238
11,801
12,384
12,505
12,981
70
71
192
332
648
1,755
3,826
6,792
10,202
10,689
11,083
11,484
11,928
Source: U.S. Department of Commerce, Bureau of Economic Analysis.
It is important to think carefully about what is represented by points in the space defined by the axes of a graph.
In Figure 1A.5 we have graphed income with consumption, as in Figure 1A.2, but here each observation point is
national income and aggregate consumption in different years, measured in billions of dollars.
Copyright © 2017 Pearson Education, Inc. 1-36
APPENDIX REVIEW TERMS AND
CONCEPTS
• graph
• negative relationship
• origin
• positive relationship
• Slope
• time series graph
• X-axis
• X-intercept
• Y-axis
• Y-intercept

Chapter 1 the scope and method of economic

  • 1.
    Copyright © 2017Pearson Education, Inc. 1-1 Principles of Economics Twelfth Edition(2 of 2) Chapter 1 The Scope and Method of Economics
  • 2.
    Copyright © 2017Pearson Education, Inc. 1-2 Chapter Outline and Learning Objectives (1 of 2) 1.1 Why Study Economics? • Identify three key reasons to study economics. Think of an example from your life in which understanding opportunity costs or the principle of efficient markets could make a difference in your decision making. 1.2 The Scope of Economics • Describe microeconomics, macroeconomics, and the diverse fields of economics.
  • 3.
    Copyright © 2017Pearson Education, Inc. 1-3 Chapter Outline and Learning Objectives (2 of 2) 1.3 The Method of Economics • Think about an example of bad causal inference leading to erroneous decision making. Identify the four main goals of economic policy. Appendix: How to Read and Understand Graphs • Understand how data can be graphically represented.
  • 4.
    Copyright © 2017Pearson Education, Inc. 1-4 Chapter 1 The Scope and Method of Economics • economics The study of how individuals and societies choose to use the scarce resources that nature and previous generations have provided. • The key word in the definition is choose. • Economics is a behavioral, or social, science. • Economics is the study of how people make choices.
  • 5.
    Copyright © 2017Pearson Education, Inc. 1-5 Why Study Economics? To Learn a Way of Thinking • Economics has three fundamental concepts: – Opportunity cost – Marginalism – Efficient markets
  • 6.
    Copyright © 2017Pearson Education, Inc. 1-6 To Learn a Way of Thinking (1 of 3) Opportunity Cost • opportunity cost The best alternative that we forgo, or give up, when we make a choice or decision. • scarce Limited.
  • 7.
    Copyright © 2017Pearson Education, Inc. 1-7 To Learn a Way of Thinking (2 of 3) Marginalism • marginalism The process of analyzing the additional or incremental costs or benefits arising from a choice or decision.
  • 8.
    Copyright © 2017Pearson Education, Inc. 1-8 To Learn a Way of Thinking (3 of 3) Efficient Markets—No Free Lunch • efficient market A market in which profit opportunities are eliminated almost instantaneously. • The study of economics teaches us a way of thinking and helps us make decisions.
  • 9.
    Copyright © 2017Pearson Education, Inc. 1-9 To Understand Society • Industrial Revolution The period in England during the late eighteenth and early nineteenth centuries in which new manufacturing technologies and improved transportation gave rise to the modern factory system and a massive movement of the population from the countryside to the cities. • The study of economics is an essential part of the study of society.
  • 10.
    Copyright © 2017Pearson Education, Inc. 1-10 To Be an Informed Citizen • To be an informed citizen requires a basic understanding of economics.
  • 11.
    Copyright © 2017Pearson Education, Inc. 1-11 The Scope of Economics (1 of 2) Microeconomics and Macroeconomics • microeconomics The branch of economics that examines the functioning of individual industries and the behavior of individual decision-making units—that is, firms and households. • macroeconomics The branch of economics that examines the economic behavior of aggregates— income, employment, output, and so on—on a national scale.
  • 12.
    Copyright © 2017Pearson Education, Inc. 1-12 The Scope of Economics (2 of 2) Microeconomics and Macroeconomics • Microeconomics looks at the individual unit—the household, the firm, the industry. It sees and examines the “trees.” • Macroeconomics looks at the whole, the aggregate. It sees and analyzes the “forest.”
  • 13.
    Copyright © 2017Pearson Education, Inc. 1-13 TABLE 1.1 Examples of Microeconomic and Macroeconomic Concerns Division of Economics Production Prices Income Employment Microeconomics Production/output in individual industries and businesses How much steel How much office space How many cars Prices of individual goods and services Price of medical care Price of gasoline Food prices Apartment rents Distribution of income and wealth Wages in the auto industry Minimum wage Executive salaries Poverty Employment by individual businesses and industries Jobs in the steel industry Number of employees in a firm Number of accountants Macroeconomics National production/output Total industrial output Gross domestic product Growth of output Aggregate price level Consumer prices Producer prices Rate of inflation National income Total wages and salaries Total corporate profits Employment and unemployment in the economy Total number of jobs Unemployment rate
  • 14.
    Copyright © 2017Pearson Education, Inc. 1-14 TABLE 1.2 The Fields of Economics ( 1 of 3) Behavioral economics Do aggregate household savings increase when we automatically enroll people in savings programs and let them opt out as opposed to requiring them to sign up? Comparative economic systems How does the resource allocation process differ in market versus command and control systems? Econometrics What inferences can we make based on conditional moment inequalities? Economic development Does increasing employment opportunities for girls in developing nations increase their educational achievements? Economic history How did the growth of railroads and improvement in transportation more generally change the U.S. banking systems in the nineteenth century?
  • 15.
    Copyright © 2017Pearson Education, Inc. 1-15 TABLE 1.2 The Fields of Economics (cont’d 2 of 3) Environmental economics What effect would a tax on carbon have on emissions? Is a tax better or worse than rules? Finance Is high frequency trading socially beneficial? Health economics Do co-pays by patients change the choice and use of medicines by insured patients? The history of economic thought How did Aristotle think about just prices? Industrial organization How do we explain price wars in the airline industry
  • 16.
    Copyright © 2017Pearson Education, Inc. 1-16 TABLE 1.2 The Fields of Economics (cont’d 3 of 3) International economics What are the benefits and costs of free trade? Does concern about the environment change our views of free trade? Labor economics Will increasing the minimum wage decrease employment opportunities? Law and economics Does the current U.S. patent law increase or decrease the rate of innovation? Public economics Why is corruption more widespread in some countries than in others? Urban and regional economics Do enterprise zones improve employment opportunities in central cities?
  • 17.
    Copyright © 2017Pearson Education, Inc. 1-17 The Method of Economics • Economics deals with two kinds of questions: positive and normative. • positive economics An approach to economics that seeks to understand behavior and the operation of systems without making judgments. It describes what exists and how it works. • normative economics An approach to economics that analyzes outcomes of economic behavior, evaluates them as good or bad, and may prescribe courses of action. Also called policy economics.
  • 18.
    Copyright © 2017Pearson Education, Inc. 1-18 Theories and Models (1 of 5) • model A formal statement of a theory, usually a mathematical statement of a presumed relationship between two or more variables. • variable A measure that can change from time to time or from observation to observation. • Ockham’s razor The principle that irrelevant detail should be cut away.
  • 19.
    Copyright © 2017Pearson Education, Inc. 1-19 Theories and Models ( 2 of 5) All Else Equal • ceteris paribus, or all else equal A device used to analyze the relationship between two variables while the values of other variables are held unchanged. • Using the device of ceteris paribus is one part of the process of abstraction. • In formulating economic theory, the concept helps us simplify reality to focus on the relationships that interest us.
  • 20.
    Copyright © 2017Pearson Education, Inc. 1-20 Theories and Models (3 of 5) Expressing Models in Words, Graphs, and Equations • Graphs and equations capture the quantitative side of economic observations and predictions.
  • 21.
    Copyright © 2017Pearson Education, Inc. 1-21 Theories and Models (4 of 5) Cautions and Pitfalls • Economists are interested in cause and effect, but sorting out causality from correlation is not always easy. • post hoc, ergo propter hoc Literally, “after this (in time), therefore because of this.” A common error made in thinking about causation: If Event A happens before Event B, it is not necessarily true that A caused B.
  • 22.
    Copyright © 2017Pearson Education, Inc. 1-22 Theories and Models (5 of 5) Testing Theories and Models: Empirical Economics • empirical economics The collection and use of data to test economic theories.
  • 23.
    Copyright © 2017Pearson Education, Inc. 1-23 Economic Policy ( 1 of 3) • Four criteria are important in judging economic outcomes: 1. Efficiency 2. Equity 3. Growth 4. Stability
  • 24.
    Copyright © 2017Pearson Education, Inc. 1-24 Economic Policy (2 of 3) Efficiency • efficiency In economics, allocative efficiency. An efficient economy is one that produces what people want at the least possible cost. Equity • equity Fairness.
  • 25.
    Copyright © 2017Pearson Education, Inc. 1-25 Economic Policy ( 3 of 3) Growth • economic growth An increase in the total output of an economy. Stability • stability A condition in which national output is growing steadily, with low inflation and full employment of resources.
  • 26.
    Copyright © 2017Pearson Education, Inc. 1-26 REVIEW TERMS AND CONCEPTS • ceteris paribus, or all else equal • economic growth • economics • efficiency • efficient market • empirical economics • equity • Industrial Revolution • macroeconomics • Marginalism • microeconomics • model • normative economics • Ockham’s razor • opportunity cost • positive economics • post hoc, ergo propter hoc • scarce • stability • variable
  • 27.
    Copyright © 2017Pearson Education, Inc. 1-27 CHAPTER 1 APPENDIX: How to Read and Understand Graphs • graph A two-dimensional representation of a set of numbers or data. Time Series Graphs • time series graph A graph illustrating how a variable changes over time.
  • 28.
    Copyright © 2017Pearson Education, Inc. 1-28 TABLE 1A.1 Total Disposable Personal Income in the United States, 1975–2014 (in Billions of Dollars) Year Total Disposable Personal Income Year Total Disposable Personal Income 1975 1976 1977 1978 1979 1980 1981 1982 1983 1984 1985 1986 1987 1988 1989 1990 1991 1992 1993 1994 1,219 1,326 1,457 1,630 1,809 2,018 2,251 2,425 2,617 2,904 3,099 3,288 3,466 3,770 4,052 4,312 4,485 4,800 5,000 5,244 1995 1996 1997 1998 1999 2000 2001 2002 2003 2004 2005 2006 2007 2008 2009 2010 2011 2012 2013 2014 5,533 5,830 6,149 6,561 6,876 7,401 7,752 8,099 8,466 9,002 9,401 10,037 10,507 10,994 10,943 11,238 11,801 12,384 12,508 12,981 Source: U.S. Department of Commerce, Bureau of Economic Analysis. FIGURE 1A.1 Total Disposable Personal Income in the United States: 1975–2014 (in Billions of Dollars) Source: See Table 1A.1.
  • 29.
    Copyright © 2017Pearson Education, Inc. 1-29 Graphing Two Variables • X-axis The horizontal line against which a variable is plotted. • Y-axis The vertical line against which a variable is plotted. • origin The point at which the horizontal and vertical axes intersect. • Y-intercept The point at which a graph intersects the Y-axis. • X-intercept The point at which a graph intersects the X-axis.
  • 30.
    Copyright © 2017Pearson Education, Inc. 1-30 Plotting Income and Consumption Data for Households • positive relationship A relationship between two variables, X and Y, in which a decrease in X is associated with a decrease in Y and an increase in X is associated with an increase in Y. • negative relationship A relationship between two variables, X and Y, in which a decrease in X is associated with an increase in Y and an increase in X is associated with a decrease in Y.
  • 31.
    Copyright © 2017Pearson Education, Inc. 1-31 FIGURE 1A.2 Household Consumption and Income Source: See Table 1A.2. TABLE 1A.2 Consumption Expenditures and Income, 2012 Average Income Before Taxes Average Consumption Expenditures Bottom fifth 2nd fifth 3rd fifth 4th fifth Top fifth $ 9,988 27,585 47,265 75,952 167,010 $ 22,154 32,632 43,004 59,980 99,368 Source: Consumer Expenditures in 2012, U.S. Bureau of Labor Statistics. A graph is a simple two-dimensional geometric representation of data. The graph in Figure 1A.2 displays the data from Table 1A.2. Along the horizontal scale (X-axis), we measure household income. Along the vertical scale (Y-axis), we measure household consumption. Note: At point A, consumption equals $22,154 and income equals $9,988. At point B, consumption equals $32,632 and income equals $27,585.
  • 32.
    Copyright © 2017Pearson Education, Inc. 1-32 Slope • slope A measurement that indicates whether the relationship between variables is positive or negative and how much of a response there is in Y (the variable on the vertical axis) when X (the variable on the horizontal axis) changes.
  • 33.
    Copyright © 2017Pearson Education, Inc. 1-33 FIGURE 1A.3 A Curve with (a) Positive Slope and (b) Negative Slope A positive slope indicates that increases in X are associated with increases in Y and that decreases in X are associated with decreases in Y. A negative slope indicates the opposite—when X increases, Y decreases; and when X decreases, Y increases.
  • 34.
    Copyright © 2017Pearson Education, Inc. 1-34 FIGURE 1A.4 Changing Slopes along Curves
  • 35.
    Copyright © 2017Pearson Education, Inc. 1-35 Some Precautions FIGURE 1A.5 National Income and Consumption Source: See Table 1A.3. TABLE 1A.3 Aggregate National Income and Consumption for the United States, 1930–2014 (in Billions of Dollars) Aggregate National Income Aggregate Consumption 1930 1940 1950 1960 1970 1980 1990 2000 2010 2011 2012 2013 2014 75 78 215 377 762 2,018 4,312 7,401 11,238 11,801 12,384 12,505 12,981 70 71 192 332 648 1,755 3,826 6,792 10,202 10,689 11,083 11,484 11,928 Source: U.S. Department of Commerce, Bureau of Economic Analysis. It is important to think carefully about what is represented by points in the space defined by the axes of a graph. In Figure 1A.5 we have graphed income with consumption, as in Figure 1A.2, but here each observation point is national income and aggregate consumption in different years, measured in billions of dollars.
  • 36.
    Copyright © 2017Pearson Education, Inc. 1-36 APPENDIX REVIEW TERMS AND CONCEPTS • graph • negative relationship • origin • positive relationship • Slope • time series graph • X-axis • X-intercept • Y-axis • Y-intercept