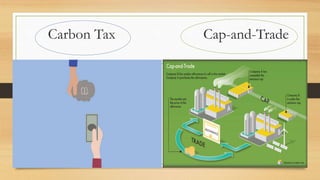
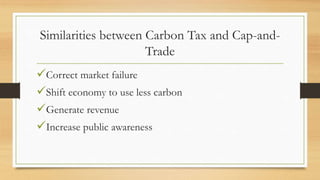
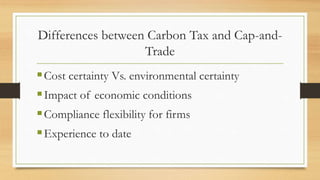
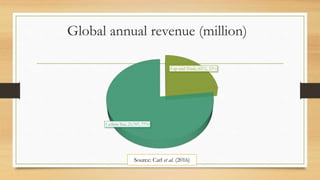
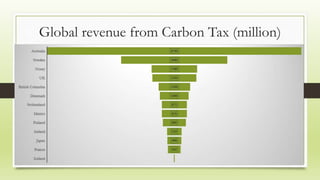
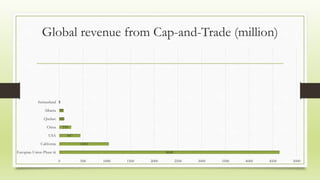
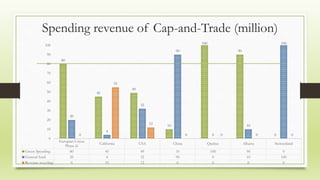
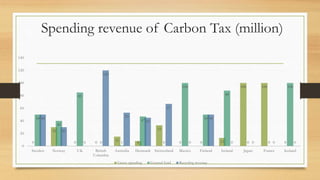
Carbon Tax Vs. Cap-and-Trade: A
Comparative Analysis
Overview
• Carbon tax
• Cap-and-Trade
• Similarities
• Differences
• Application of Carbon tax and Cap-and-Trade
• Conclusion
Carbon Tax Cap-and-Trade
Similarities between Carbon Tax and Cap-and-
Trade
Correct market failure
Shift economy to use less carbon
Generate revenue
Increase public awareness
Differences between Carbon Tax and Cap-and-
Trade
Cost certainty Vs. environmental certainty
Impact of economic conditions
Compliance flexibility for firms
Experience to date
Global annual revenue (million)
Cap-and-Trade, 6572, 23%
Carbon Tax, 21,707, 77%
Source: Carl et al. (2016)
Global revenue from Carbon Tax (million)
Global revenue from Cap-and-Trade (million)
4640
1043
447
250
100
92
9
0 500 1000 1500 2000 2500 3000 3500 4000 4500 5000
Europian Union Phase iii
California
USA
China
Quebec
Albarta
Switzerland
Spending revenue of Cap-and-Trade (million)
Europian Union
Phase iii
California USA China Quebec Albarta Switzerland
Green Spending 80 45 49 10 100 90 0
General fund 20 4 32 90 0 10 100
Revenue recycling 0 55 12 0 0 0 0
80
45
49
10
100
90
0
20
4
32
90
0
10
100
0
55
12
0 0 0 0
0
10
20
30
40
50
60
70
80
90
100
Spending revenue of Carbon Tax (million)
0
30
0 0 15 8
33
0 0 13
100 100
0
50
40
85
0 1
47
0
100
50
88
0 0
100
50
30
0
120
53
45
67
0
50
0 0 0 0
0
20
40
60
80
100
120
140
Sweden Norway UK British
Columbia
Australia Denmark Switzerland Maxico Finland Ireland Japan France Iceland
Green spending General fund Recycling revenue
California AB 32 Cap-and-Trade System
• Active period -November 2012-2020
• Coverage -Large emitters (>25000 t per year) industry, power
generation, Transport, natural gas
• Target -80% reduction in GHG emissions below 1990 levels by 2050
• Revenue -$477 m in 2013 (Expected revenue- Maximum $70 b in 2020)
California AB 32 Cap-and-Trade System
• Spending -Investment on ‘green’ projects
-Water energy efficiency water action plan
-Low carbon transportation subsidies
-High speed passenger rail system
-New recruitment in administration
-Distributed among rate payers
California AB 32 Cap-and-Trade System
• Results -The link to Québec has not impacted California’s market
price as the state, being the larger market, is the ‘price
maker’ for the two systems.
-Reduce the likelihood of over-allocation
-Subnational Global Climate Leadership
Sweden Carbon dioxide Tax
• Active period -1991 to ongoing
• Coverage -Fossil fuel used for heating and transport
• Revenue - $ 3.68 b (2013)
• Spending -Contributes to country’s general budget
-Administrative cost
-Green Tax shift
Sweden Carbon dioxide Tax
• Results -Cut carbon emissions by 9% with 44% economic growth
-Paying extra for filling the tank
-Service sector grew more
-Gift for buying green car
Conclusion
• Most countries use Carbon tax.
• Both are well implanted policy.
• Mixer of both policy also can be a good idea.
Thank You

Carbon Tax Vs. Cap-and-Trade: A Comparative Analysis

  • 1.
    Carbon Tax Vs.Cap-and-Trade: A Comparative Analysis
  • 2.
    Overview • Carbon tax •Cap-and-Trade • Similarities • Differences • Application of Carbon tax and Cap-and-Trade • Conclusion
  • 3.
  • 4.
    Similarities between CarbonTax and Cap-and- Trade Correct market failure Shift economy to use less carbon Generate revenue Increase public awareness
  • 5.
    Differences between CarbonTax and Cap-and- Trade Cost certainty Vs. environmental certainty Impact of economic conditions Compliance flexibility for firms Experience to date
  • 6.
    Global annual revenue(million) Cap-and-Trade, 6572, 23% Carbon Tax, 21,707, 77% Source: Carl et al. (2016)
  • 7.
    Global revenue fromCarbon Tax (million)
  • 8.
    Global revenue fromCap-and-Trade (million) 4640 1043 447 250 100 92 9 0 500 1000 1500 2000 2500 3000 3500 4000 4500 5000 Europian Union Phase iii California USA China Quebec Albarta Switzerland
  • 9.
    Spending revenue ofCap-and-Trade (million) Europian Union Phase iii California USA China Quebec Albarta Switzerland Green Spending 80 45 49 10 100 90 0 General fund 20 4 32 90 0 10 100 Revenue recycling 0 55 12 0 0 0 0 80 45 49 10 100 90 0 20 4 32 90 0 10 100 0 55 12 0 0 0 0 0 10 20 30 40 50 60 70 80 90 100
  • 10.
    Spending revenue ofCarbon Tax (million) 0 30 0 0 15 8 33 0 0 13 100 100 0 50 40 85 0 1 47 0 100 50 88 0 0 100 50 30 0 120 53 45 67 0 50 0 0 0 0 0 20 40 60 80 100 120 140 Sweden Norway UK British Columbia Australia Denmark Switzerland Maxico Finland Ireland Japan France Iceland Green spending General fund Recycling revenue
  • 11.
    California AB 32Cap-and-Trade System • Active period -November 2012-2020 • Coverage -Large emitters (>25000 t per year) industry, power generation, Transport, natural gas • Target -80% reduction in GHG emissions below 1990 levels by 2050 • Revenue -$477 m in 2013 (Expected revenue- Maximum $70 b in 2020)
  • 12.
    California AB 32Cap-and-Trade System • Spending -Investment on ‘green’ projects -Water energy efficiency water action plan -Low carbon transportation subsidies -High speed passenger rail system -New recruitment in administration -Distributed among rate payers
  • 13.
    California AB 32Cap-and-Trade System • Results -The link to Québec has not impacted California’s market price as the state, being the larger market, is the ‘price maker’ for the two systems. -Reduce the likelihood of over-allocation -Subnational Global Climate Leadership
  • 14.
    Sweden Carbon dioxideTax • Active period -1991 to ongoing • Coverage -Fossil fuel used for heating and transport • Revenue - $ 3.68 b (2013) • Spending -Contributes to country’s general budget -Administrative cost -Green Tax shift
  • 15.
    Sweden Carbon dioxideTax • Results -Cut carbon emissions by 9% with 44% economic growth -Paying extra for filling the tank -Service sector grew more -Gift for buying green car
  • 16.
    Conclusion • Most countriesuse Carbon tax. • Both are well implanted policy. • Mixer of both policy also can be a good idea.
  • 17.