The case study analyzes the pricing dynamics of used cars, emphasizing the rising trend in sales, especially in developing countries. Using a supervised learning method called random forest, the study aims to model car prices based on various features, highlighting significant correlations such as wheel base, car length, and engine type. Recommendations include setting prices between $18,500 and $30,000, focusing on fuel economy, and considering customer preferences for certain car types and features.

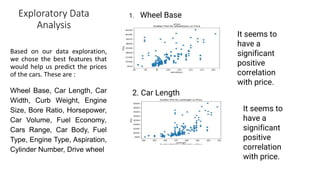
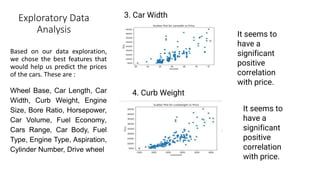
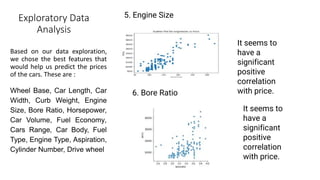
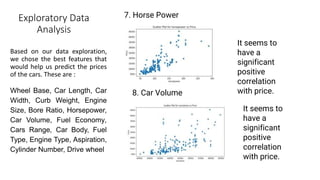


![Health 10 Ppt[1]. Stomach Cancer](https://cdn.slidesharecdn.com/ss_thumbnails/health10ppt1-stomachcancer-091223081620-phpapp02-thumbnail.jpg?width=640&height=640&fit=bounds)


