Downloaded 191 times

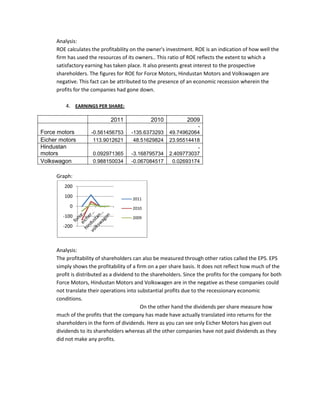
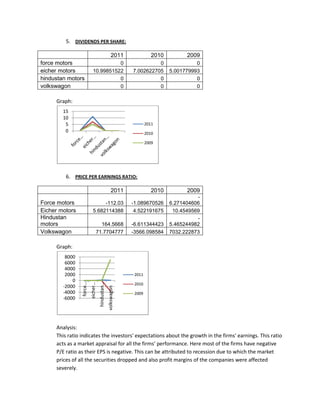
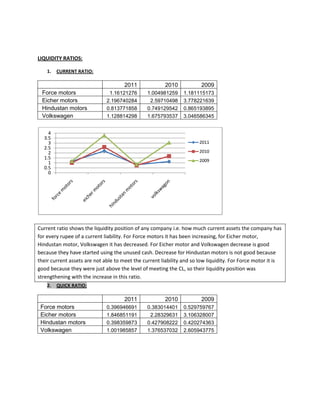
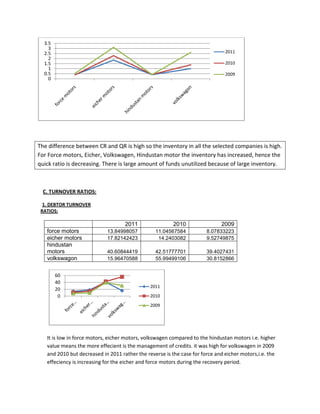

The document analyzes various profitability and liquidity ratios for automobile companies in India from 2009-2011. For profitability ratios, Force Motors had the highest gross profit margin each year, indicating efficient production. Eicher Motors and Volkswagen had the highest net profit margins in some years. Force Motors and Hindustan Motors had negative earnings per share and return on equity in some years due to economic recession. For liquidity ratios, current and quick ratios decreased for some companies due to higher inventory levels. Debtor turnover was highest for Hindustan Motors, while creditor turnover was lowest for Force Motors. Inventory turnover was highest for Volkswagen in 2011. Asset turnover was lowest for Force Motors each year


![[PDF] The BMW Group – an Overview.pdf](https://cdn.slidesharecdn.com/ss_thumbnails/5bpdf-5d-the-bmw-group-e2-80-93-an-overview-120211135247-phpapp02-thumbnail.jpg?width=640&height=640&fit=bounds)


