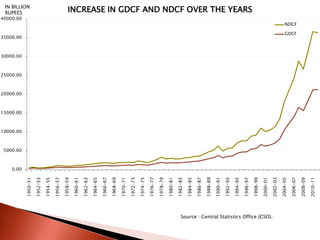
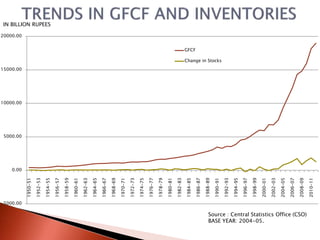
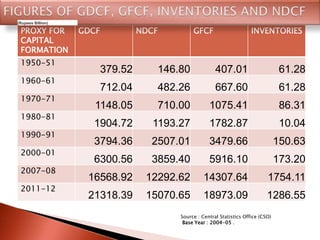
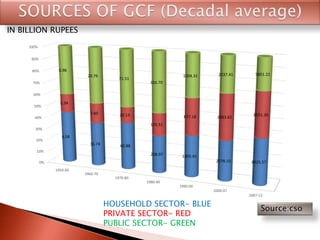
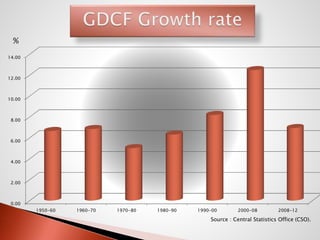
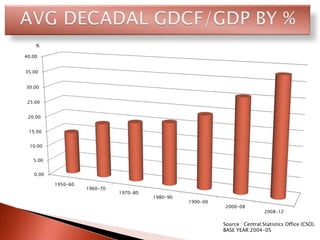
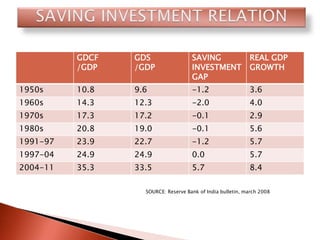
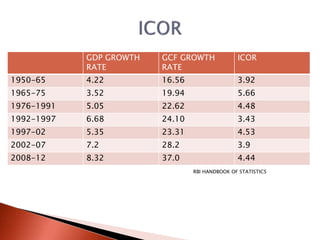
A KEY GROWTH DRIVER
Accumulation of capital(machines, tools etc.) adds to the
capital stock of the economy and thereby raises its
productive capacity. The proportion (or %) of domestic
product that takes on the form of capital-goods is the
rate of capital formation. This capital helps in producing
economy’s output. It is also called investment.
Concept of GDCF and NDCF.
CAPITAL
FORMATION
Gross fixed capital
formation (GFCF)
Which does not change their form
in the process of production. Eg.
building, machineries etc
Inventories (change
in stock)
These are kept in stock to ensure
continuous production, sale and
transportation. Eg. raw materials,
finished goods etc
0.00
5000.00
10000.00
15000.00
20000.00
25000.00
30000.00
35000.00
40000.00
1950-51
1952-53
1954-55
1956-57
1958-59
1960-61
1962-63
1964-65
1966-67
1968-69
1970-71
1972-73
1974-75
1976-77
1978-79
1980-81
1982-83
1984-85
1986-87
1988-89
1990-91
1992-93
1994-95
1996-97
1998-99
2000-01
2002-03
2004-05
2006-07
2008-09
2010-11
INCREASE IN GDCF AND NDCF OVER THE YEARS
NDCF
GDCF
IN BILLION
RUPEES
Source : Central Statistics Office (CSO).
-5000.00
0.00
5000.00
10000.00
15000.00
20000.00
1950-51
1952-53
1954-55
1956-57
1958-59
1960-61
1962-63
1964-65
1966-67
1968-69
1970-71
1972-73
1974-75
1976-77
1978-79
1980-81
1982-83
1984-85
1986-87
1988-89
1990-91
1992-93
1994-95
1996-97
1998-99
2000-01
2002-03
2004-05
2006-07
2008-09
2010-11
GFCF
Change in Stocks
Source : Central Statistics Office (CSO)
BASE YEAR: 2004-05.
IN BILLION RUPEES
PROXY FOR
CAPITAL
FORMATION
GDCF NDCF GFCF INVENTORIES
1950-51
379.52 146.80 407.01 61.28
1960-61
712.04 482.26 667.60 61.28
1970-71
1148.05 710.00 1075.41 86.31
1980-81
1904.72 1193.27 1782.87 10.04
1990-91
3794.36 2507.01 3479.66 150.63
2000-01
6300.56 3859.40 5916.10 173.20
2007-08
16568.92 12292.62 14307.64 1754.11
2011-12
21318.39 15070.65 18973.09 1286.55
Source : Central Statistics Office (CSO)
Base Year : 2004-05 .
(Rupees Billion)
0%
10%
20%
30%
40%
50%
60%
70%
80%
90%
100%
1950-60
1960-70
1970-80
1980-90
1990-00
2000-07
2007-12
6.58
16.74 60.88
208.97 1005.42
2578.10 8925.57
2.34
7.60 20.13
125.51
877.18 2883.62
8551.36
5.98
20.76
71.51
326.70
1004.31 2237.41 5851.22
HOUSEHOLD SECTOR- BLUE
PRIVATE SECTOR- RED
PUBLIC SECTOR- GREEN
IN BILLION RUPEES
Source:cso
0.00
2.00
4.00
6.00
8.00
10.00
12.00
14.00
1950-60 1960-70 1970-80 1980-90 1990-00 2000-08 2008-12
%
Source : Central Statistics Office (CSO).
0.00
5.00
10.00
15.00
20.00
25.00
30.00
35.00
40.00
1950-60
1960-70
1970-80
1980-90
1990-00
2000-08
2008-12
%
Source : Central Statistics Office (CSO).
BASE YEAR:2004-05
GDCF
/GDP
GDS
/GDP
SAVING
INVESTMENT
GAP
REAL GDP
GROWTH
1950s 10.8 9.6 -1.2 3.6
1960s 14.3 12.3 -2.0 4.0
1970s 17.3 17.2 -0.1 2.9
1980s 20.8 19.0 -0.1 5.6
1991-97 23.9 22.7 -1.2 5.7
1997-04 24.9 24.9 0.0 5.7
2004-11 35.3 33.5 5.7 8.4
SOURCE: Reserve Bank of India bulletin, march 2008
GDP GROWTH
RATE
GCF GROWTH
RATE
ICOR
1950-65 4.22 16.56 3.92
1965-75 3.52 19.94 5.66
1976-1991 5.05 22.62 4.48
1992-1997 6.68 24.10 3.43
1997-02 5.35 23.31 4.53
2002-07 7.2 28.2 3.9
2008-12 8.32 37.0 4.44
RBI HANDBOOK OF STATISTICS
 Is growth in economy possible without human
capital?
 To quote Ranger Nurkse, “Economic development has much
to do with human endowments, social attitudes, political
conditions, and historical accidents. Capital is necessary but
not a sufficient condition of economic progress".
 There are number of ways to increase human capital but
investment in human capital is mainly investment in two
areas:
A) Education B) Health
 Increases output
 Adds to the productive capacity
 Tool of economic exchange
 Improves quality of life
 Rise in per capita income
 Increases life expectancy
 Higher educational attainment
Capital formation in india

Capital formation in india