Download to read offline
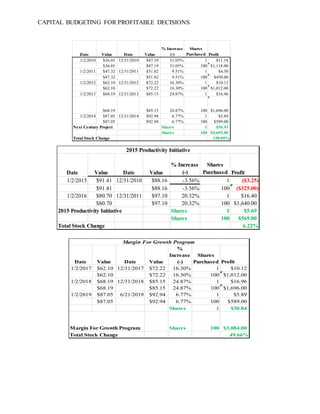
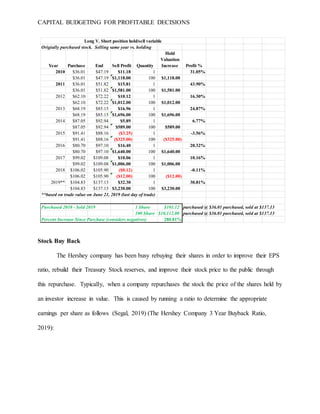
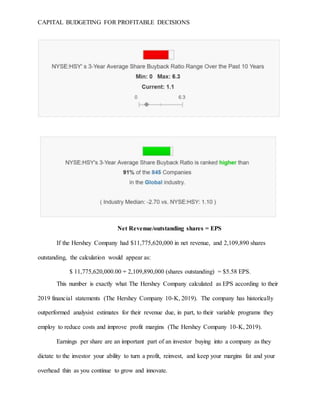
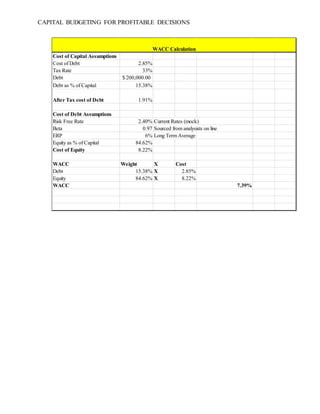


The document discusses capital budgeting techniques used by The Hershey Company to evaluate investment projects. It describes the capital budgeting process, methods to evaluate projects like net present value, internal rate of return and payback period. It provides examples of how these methods are used to determine if projects will be profitable. It also summarizes several major capital projects undertaken by Hershey from 2010-2019 related to supply chain improvements, cost reductions and productivity gains.


