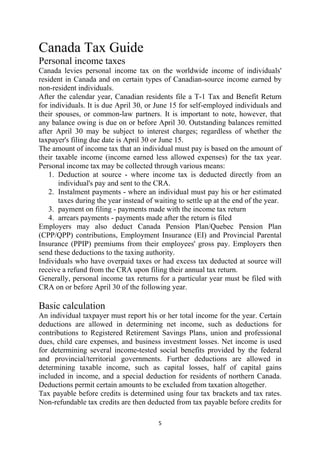
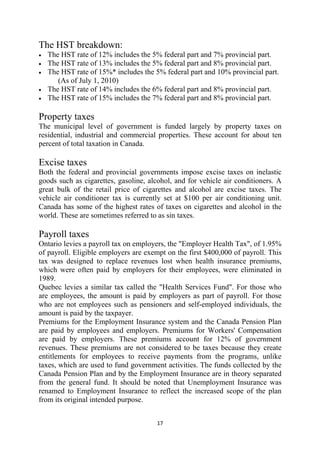
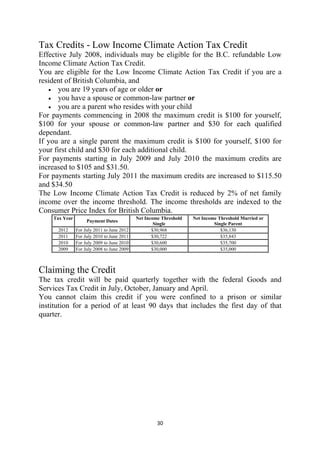
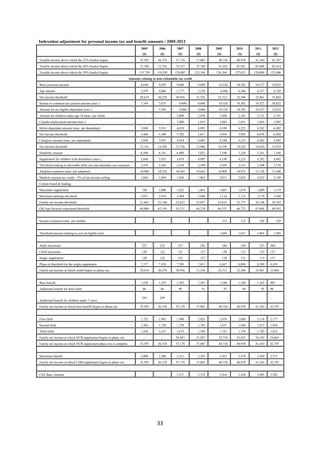
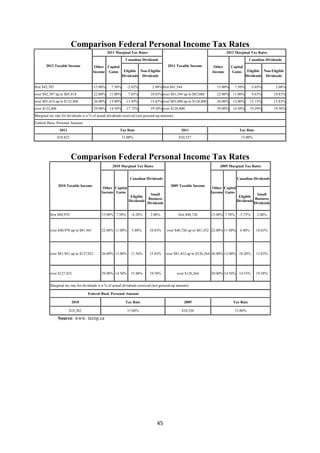
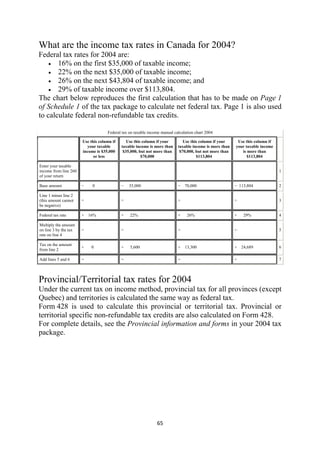
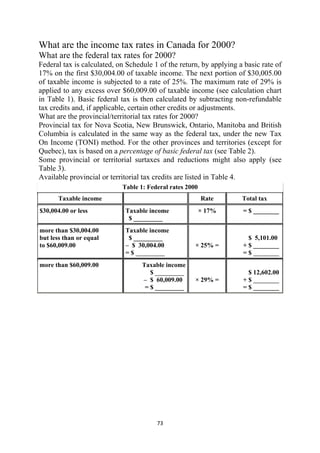
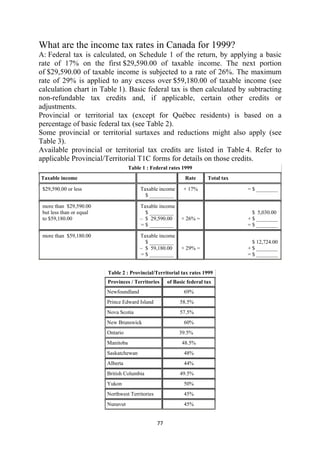
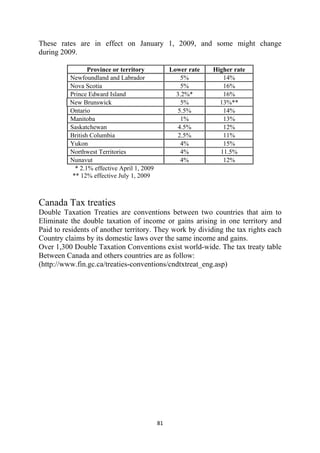
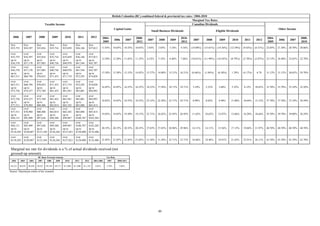
This document provides information on personal income taxes in Canada:
- Canada levies personal income tax on income earned by residents as well as some foreign-source income. Individuals file annual tax returns by April 30.
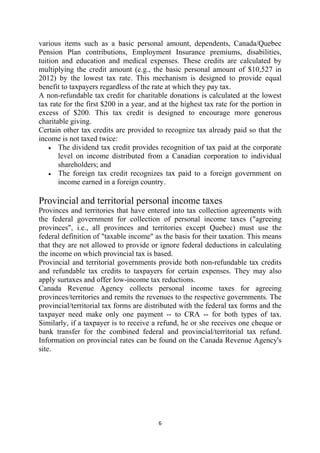
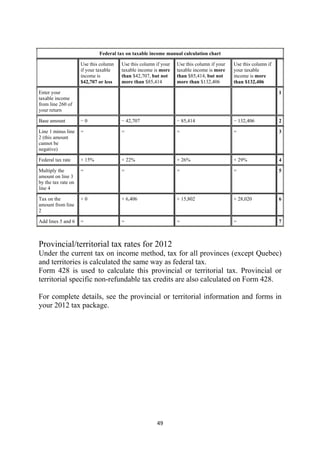
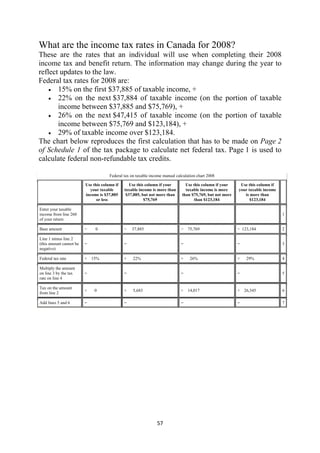
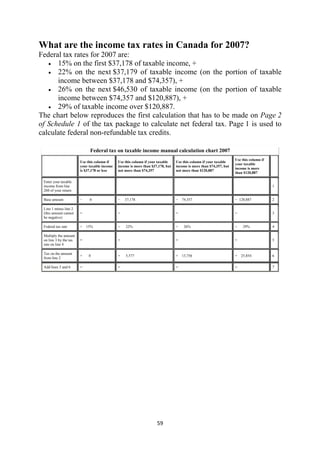
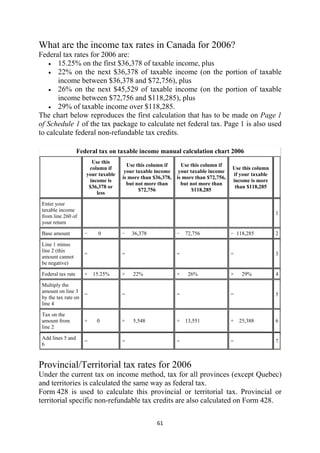
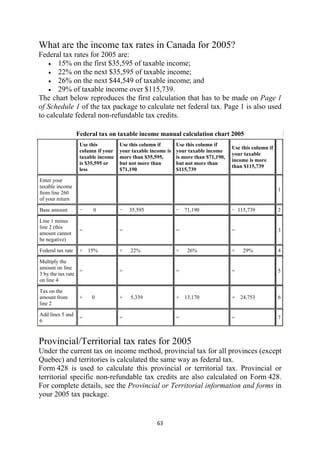
- Taxable income is determined by deducting allowed expenses from total income. Tax payable is calculated using tax brackets and rates. Non-refundable tax credits are then deducted to determine the amount owed.
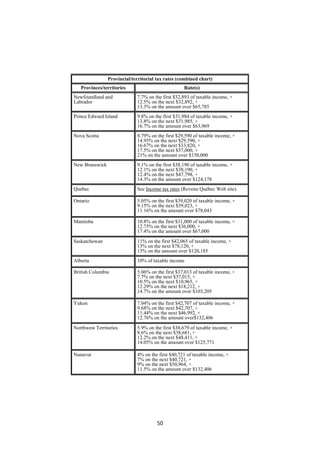
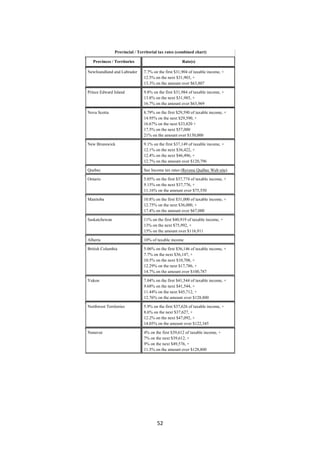
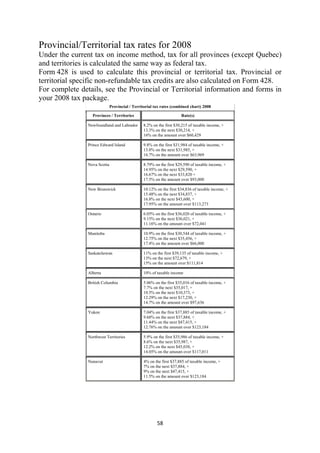
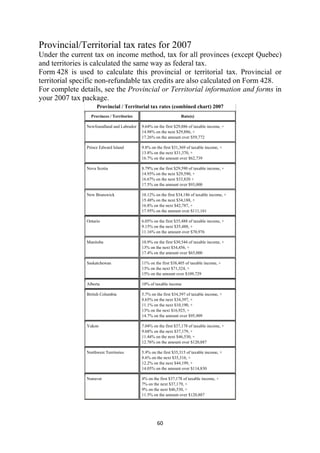
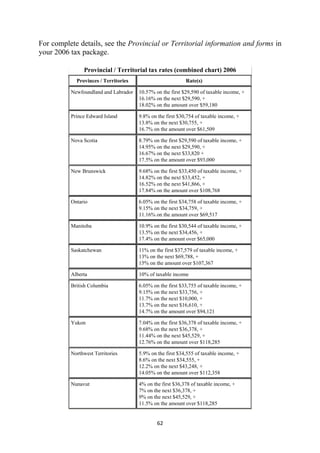
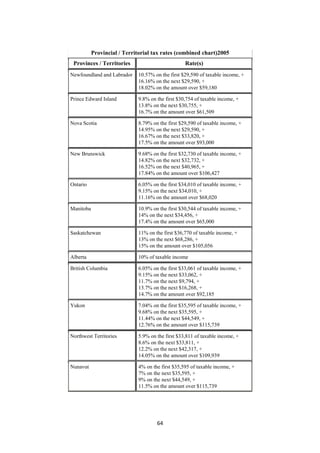
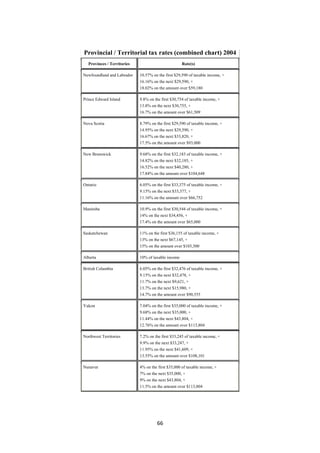
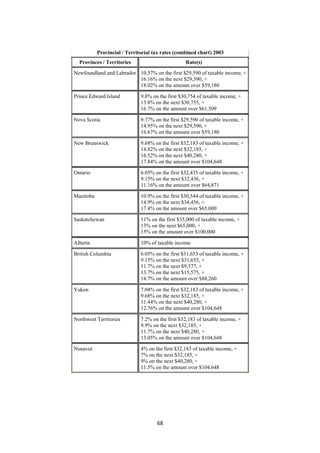
- Provinces/territories (except Quebec) use the federal definition of taxable income and CRA collects taxes on their behalf. Quebec has its own system.
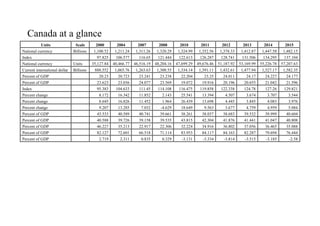
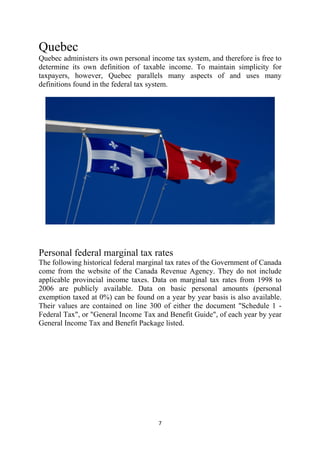
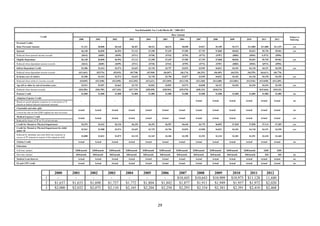
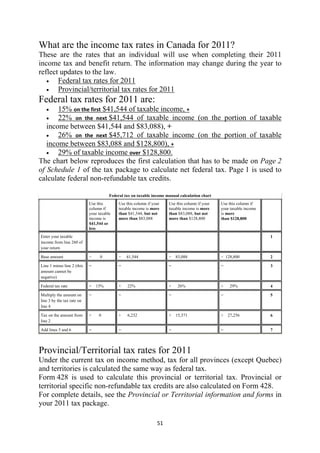
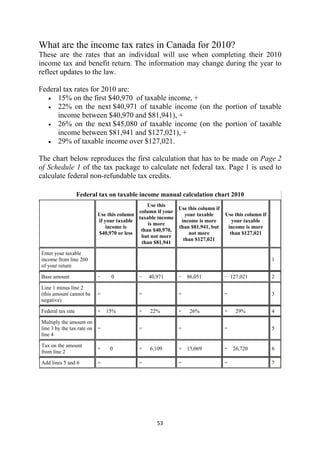
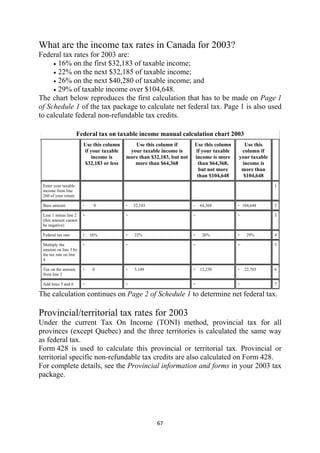
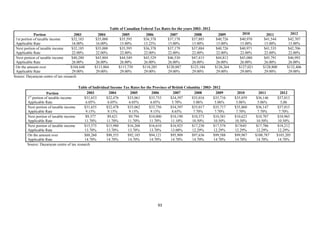
- Historical federal marginal tax rates from 1998-2012 are provided for five tax brackets, ranging from 0
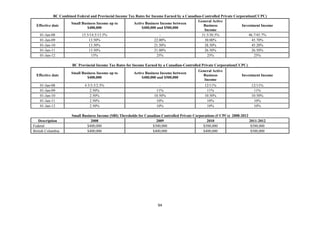
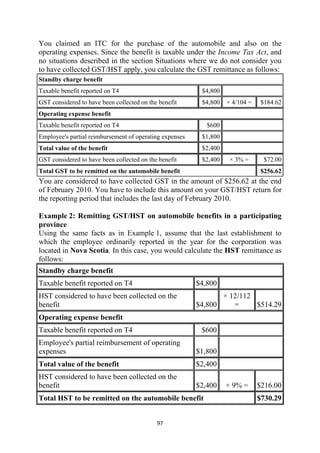
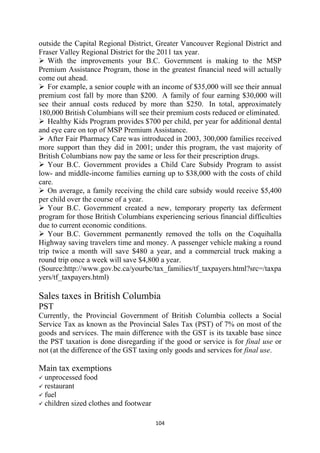
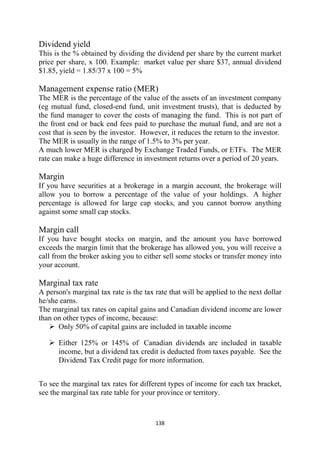
![You are considered to have collected HST in the amount of $730.29 at the end
of February 2010. You have to include this amount on your GST/HST return for
the reporting period that includes the last day of February 2010.
Example 3: Long service award
You bought a watch for $560 (including GST/HST and PST) for your employee
to mark the employee's 25 years of service. You reported a taxable benefit of
$560 in box 14 and under code 40 on the employee's T4 slip.
You could not claim an ITC because you bought the watch for the employee's
exclusive personal use and enjoyment. Since you cannot claim an ITC, you are
not considered to have collected GST/HST and, as a result, you will not have to
remit GST/HST on the benefit.
Example 4: Special clothing
You provided your employee with safety footwear designed to protect him or
her from particular hazards associated with his or her employment. Since we do
not consider the footwear to be a taxable benefit to the employee for income tax
purposes, you are not considered to have collected GST/HST on the footwear
and you do not have to remit GST/HST. However, you can claim an ITC for
any GST/HST you paid on the footwear.
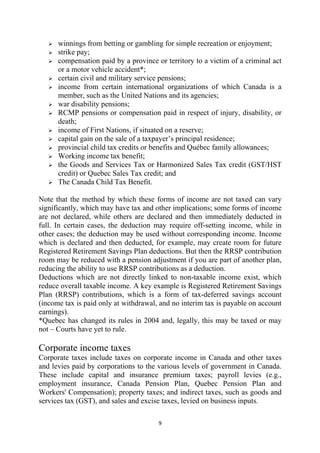
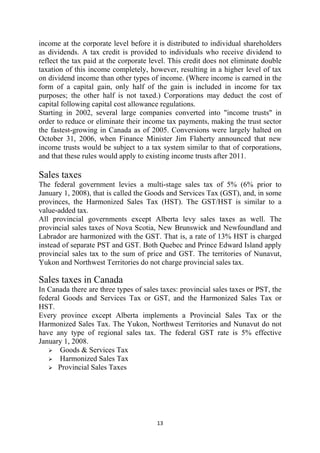
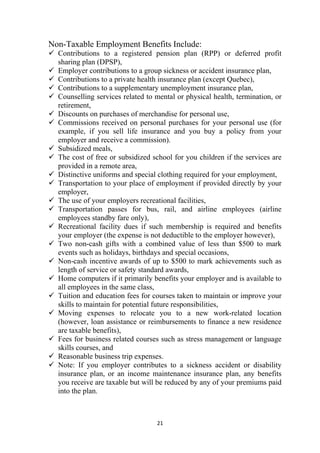
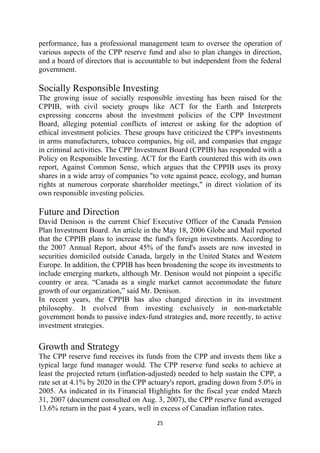
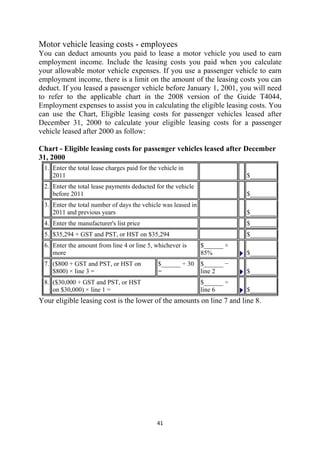
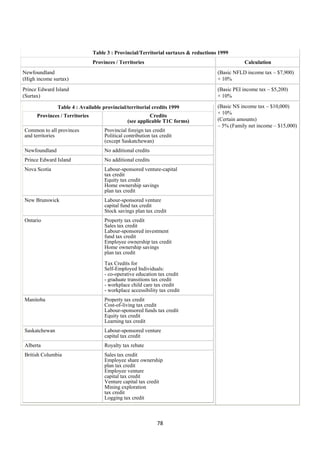
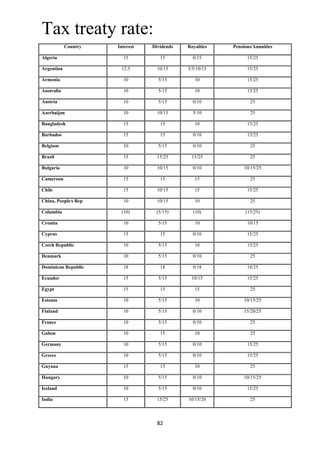
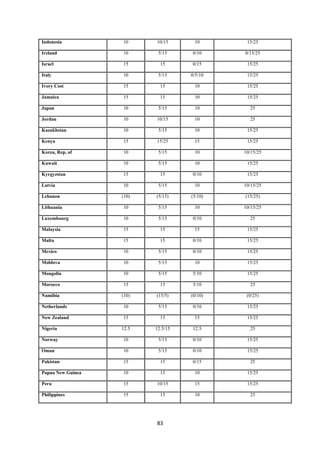
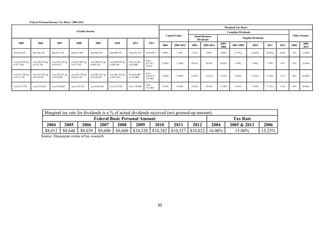
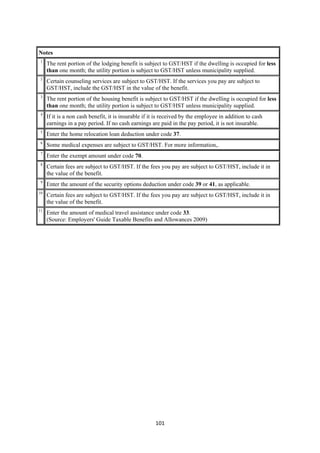
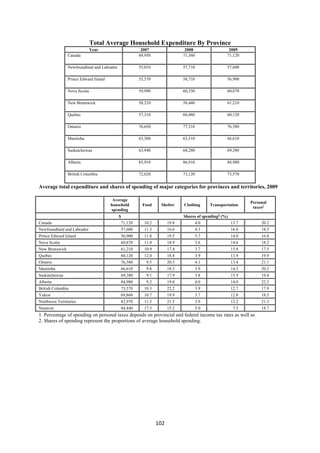
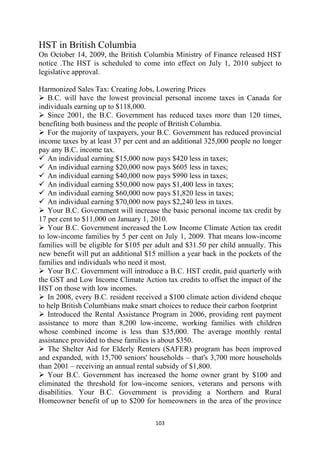
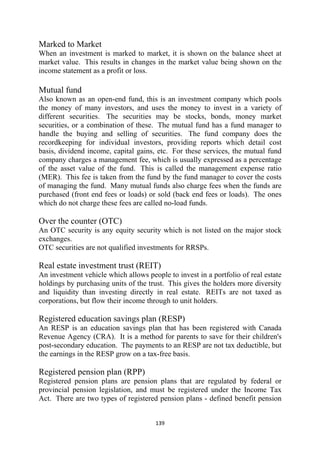
Benefits Chart
This chart indicates whether the taxable allowances and benefits discussed in
this guide are subject to CPP and EI withholdings, and shows which codes you
should use to report them on the employee's T4 slip. The chart also indicates
whether GST/HST has to be included in the value of the taxable benefit for
income tax purposes. Cash reimbursements and non-cash benefits are subject to
GST/HST, unless they are for exempt or zero-rated supplies. Cash allowances
are not subject to GST/HST.
Taxable allowance or benefit CPP EI Code GST/HST
Automobile and motor vehicle allowances yes yes 40 no
Automobile standby charge and operating expense benefits yes no 34 yes
[Note 1]
Board and lodging, if cash earnings also paid in the pay period yes yes 30
[Note 1]
Board and lodging, if no cash earnings paid in the pay period yes no 30
Cellular phone service – in cash yes yes 40 yes
Cellular phone service – non-cash yes no 40 yes
Child care expenses – in cash yes yes 40 yes
Child care expenses – non-cash yes no 40 yes
[Note 2]
Counseling services – in cash yes yes 40
98](https://image.slidesharecdn.com/canadataxation2012-120731035232-phpapp02/85/Canada-taxation-2012-98-320.jpg)
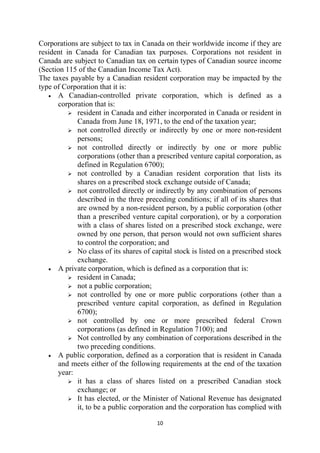
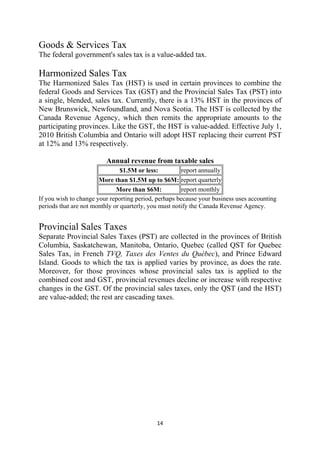
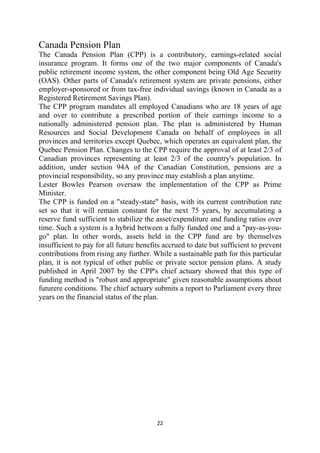
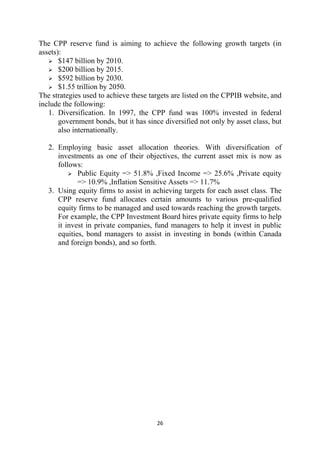
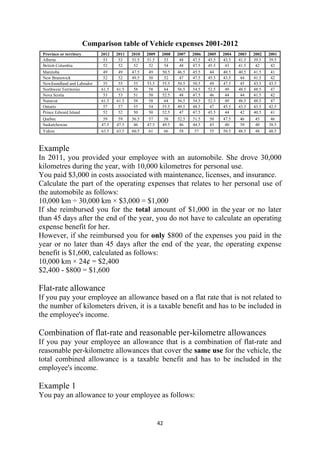
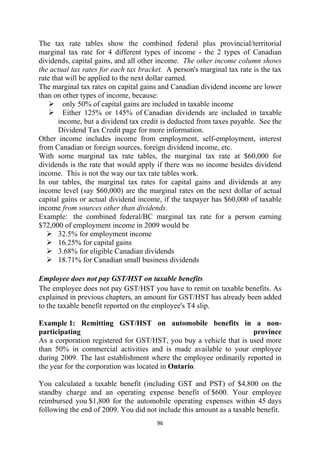
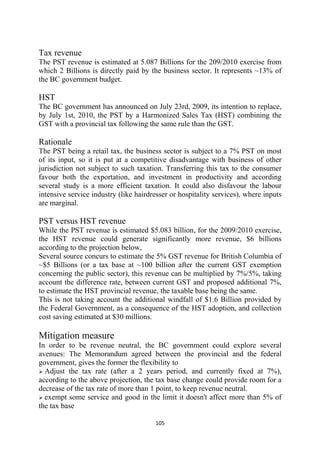
![Taxable allowance or benefit CPP EI Code GST/HST
[Note 2]
Counseling services – non-cash yes no 40
Disability-related employment benefits – in cash yes yes 40 yes
Disability-related employment benefits – non-cash yes no 40 yes
Discounts on merchandise and commissions on sales yes no 40 yes
Educational allowances for children yes yes 40 no
Gifts and awards – in cash yes yes 40 no
Gifts and awards – non-cash/near-cash yes no 40 yes
Group term life insurance policies: Employer-paid premiums yes no 40 no
[Note 3]
Housing, rent-free or low-rent – in cash yes yes 30
[Note 4] [Note 3]
Housing, rent-free or low-rent – non-cash yes 30
Interest-free and low-interest loans [Note 5] yes no 36 no
Internet service (at home) – in cash yes yes 40 yes
Internet service (at home) – non-cash yes no 40 yes
Meals – Overtime allowances yes yes 40 no
Meals – Overtime – in cash yes yes 40 yes
Meals – Overtime – non-cash yes no 40 yes
Meals – Subsidized yes no 30 yes
[Note 6]
Medical expenses – in cash yes yes 40
[Note 6]
Medical expenses – non-cash yes no 40
Moving expenses and relocation benefits – in cash yes yes 40 yes
Moving expenses and relocation benefits – non-cash yes no 40 yes
Moving expenses – non accountable allowance over $650 yes yes 40 no
Municipal officer's expense allowance [Note 7] yes no 40 no
Parking – in cash yes yes 40 yes
Parking – non-cash yes no 40 yes
Power saws and tree trimmers – rental paid by employer for
yes yes 40 yes
employee-owned tools
Premiums under provincial hospitalization, medical care
yes yes 40 no
insurance, and certain federal government plans – in cash
Premiums under provincial hospitalization, medical care
yes no 40 no
insurance, and certain federal government plans – non-cash
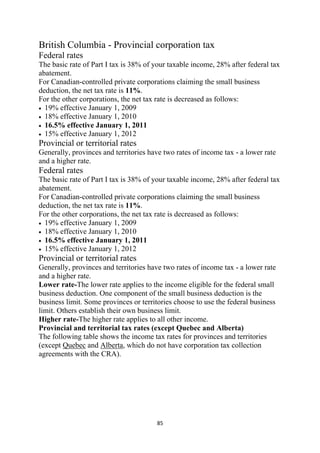
[Note 8]
Professional membership dues – in cash yes yes 40
[Note 8]
Professional membership dues – non-cash yes no 40
Recreational facilities – in cash yes yes 40 yes
99](https://image.slidesharecdn.com/canadataxation2012-120731035232-phpapp02/85/Canada-taxation-2012-99-320.jpg)
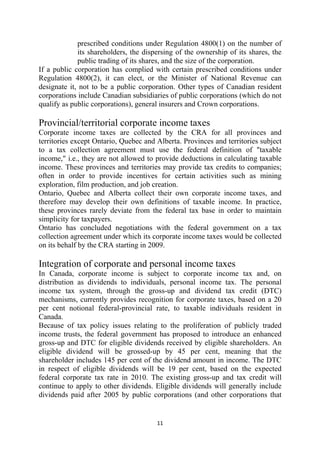
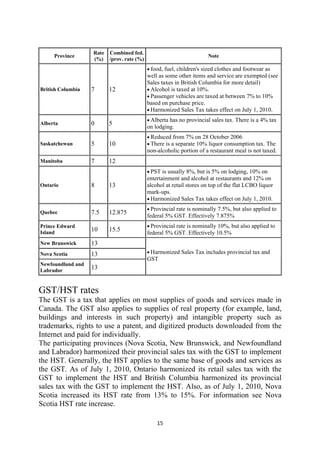
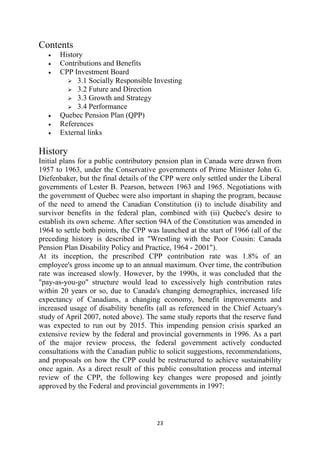
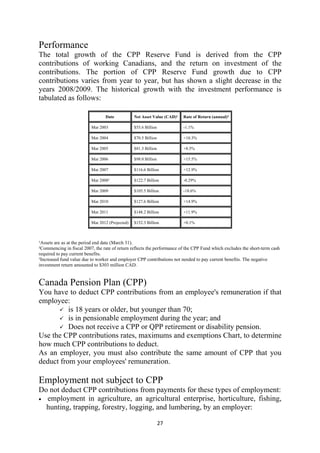
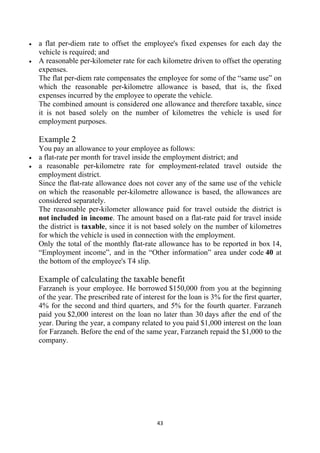
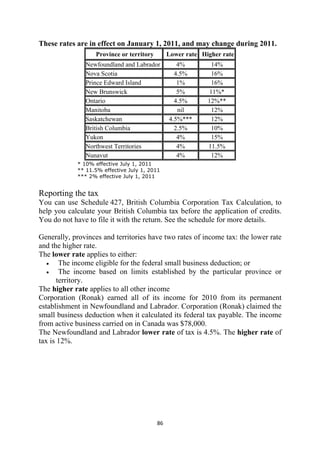
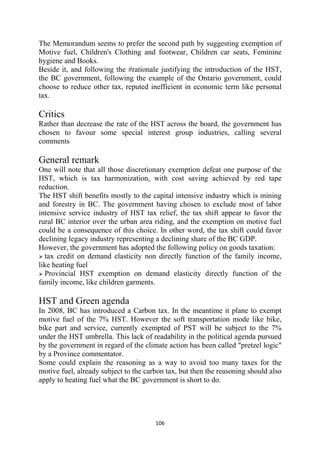
![Taxable allowance or benefit CPP EI Code GST/HST
Recreational facilities – non-cash yes no 40 yes
Recreational facilities – club membership dues yes no 40 yes
Registered retirement savings plan (RRSP) contributions yes yes 40 no
[Note 8]
Registered retirement savings plan (RRSP) administration fees yes no 40
Scholarships and bursaries yes yes 40 no
[Note 9]
Security options yes no 38 no
Social events – in cash yes yes 40 no
Social events – non-cash yes no 40 yes
Spouse or common-law partner's travelling expenses – cash
yes yes 40 no
allowance
Spouse or common-law partner's travelling expenses – non-cash yes no 40 yes
Tax-Free Savings Account – contributions yes yes 40 no
[Note 10]
Tax-Free Savings Account – administration fees yes no 40
Tool allowance yes yes 40 no
Tool reimbursement yes yes 40 yes
Transit passes – in cash yes yes 40 yes
Transit passes – non-cash yes no 40 yes
Transportation to and from the job – in cash yes yes 40 yes
Transportation to and from the job – non-cash yes no 40 yes
Travel assistance in a prescribed zone [Note 11] yes yes 32 yes
Travelling allowances to a part-time employee and other
yes yes 40 no
employees
[Note 10]
Tuition fees – in cash yes yes 40
[Note 10]
Tuition fees – non-cash yes no 40
Uniforms and special clothing – in cash yes yes 40 yes
Uniforms and special clothing – non-cash yes no 40 yes
Wage-loss replacement or income maintenance non-group plan
yes no 40 no
premiums
100](https://image.slidesharecdn.com/canadataxation2012-120731035232-phpapp02/85/Canada-taxation-2012-100-320.jpg)
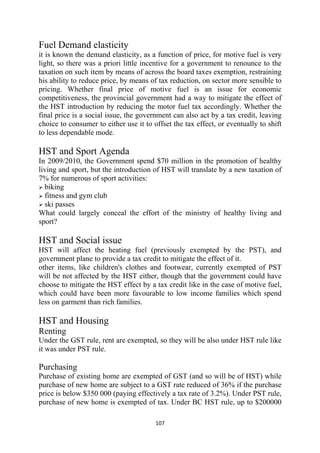
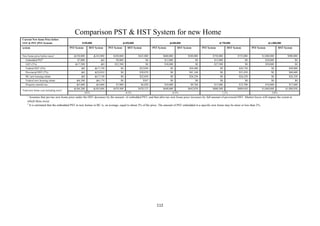
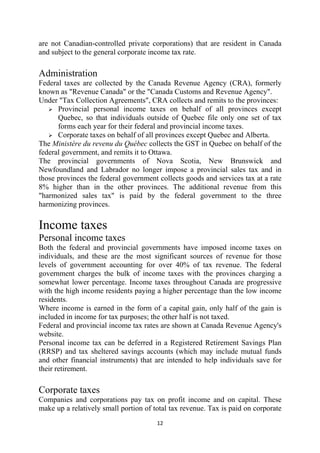
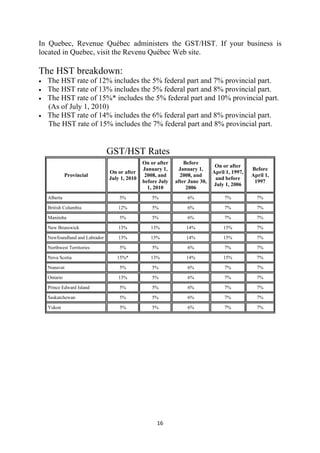
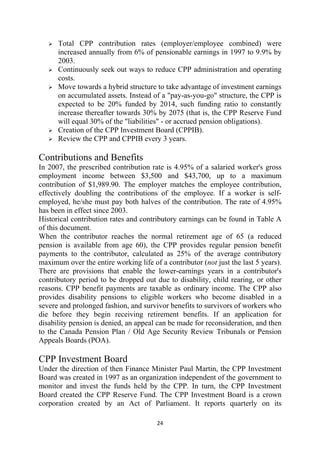
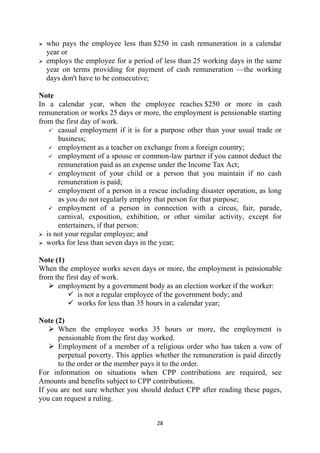
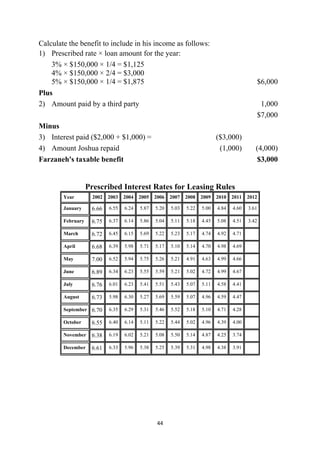
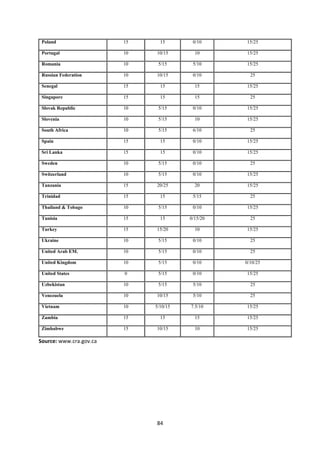
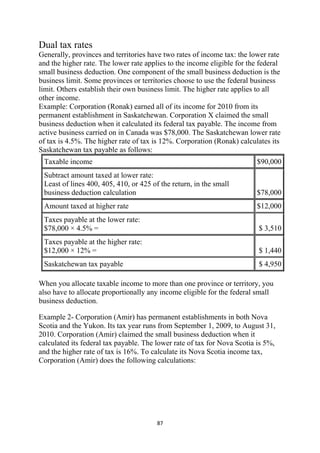
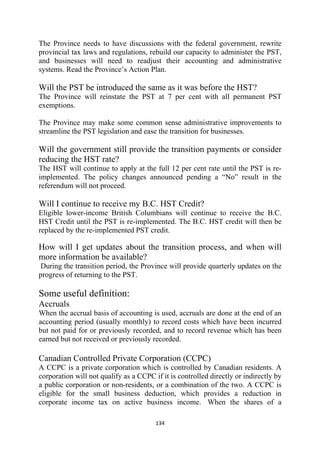
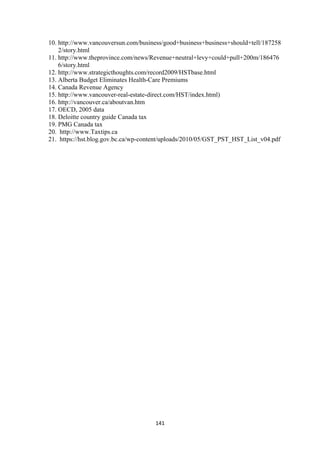
![Food and Beverages
GST-taxable RST-taxable Is there a change
before before to the amount of
July 1, 2010 July 1,2010 tax payable
under the HST?
Basic Groceries (e.g., Dairy, Meat, No GST No RST No HST
Vegetables, Canned goods)
Snack Foods (e.g., Chips, Pop) 5% 8% No (remains 13%)
Qualifying Prepared Food and 5% No RST No (remains 5%)
Beverages Sold for $4.00 or Less
Restaurant Meals for More than 5% 8% No (remains 13%)
$4.00
Alcoholic Beverages 5% 10-12% HST 13%[1]
Banking and Investments
GST-taxable RST-taxable Is there a
before before change to the
July 1, 2010 July 1,2010 amount of tax
payable
under the
HST?
Mortgage Interest Costs No GST No RST No HST
Most Financial Services No GST No RST No HST
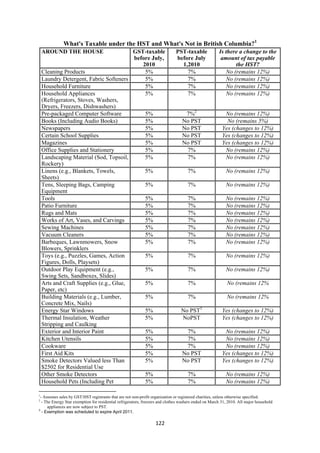
Around the House
GST-taxable before RST-taxable Is there a change to the
July 1, 2010 before amount of tax payable
July 1,2010 under the HST?
Cleaning Products 5% 8% No (remains 13%)
Laundry Detergent, Fabric Softeners 5% 8% No (remains 13%)
Household Furniture 5% 8% No (remains 13%)
Refrigerators and Freezers 5% 8% No (remains 13%)
Pre-packaged Computer Software 5% 8% No (remains 13%)
Books (including Audio Books) 5% No RST No (remains 5%)
Newspapers 5% No RST No (remains 5%)
Magazines Purchased at Retail 5% 8% No (remains 13%)
Office Supplies, Stationary 5% 8% No (remains 13%)
Landscaping Materials 5% 8% No (remains 13%)
Including Sod, Seeds, Plants
Linens (e.g., Blankets, Towels, Sheets) 5% 8% No (remains 13%)
114](https://image.slidesharecdn.com/canadataxation2012-120731035232-phpapp02/85/Canada-taxation-2012-114-320.jpg)
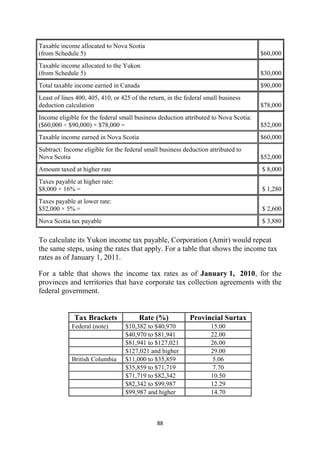
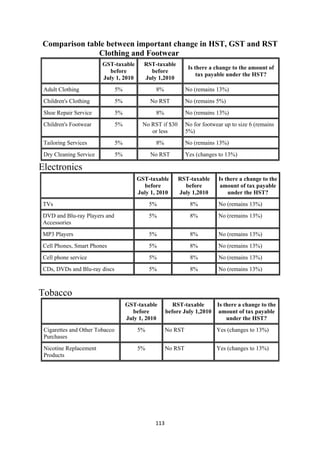
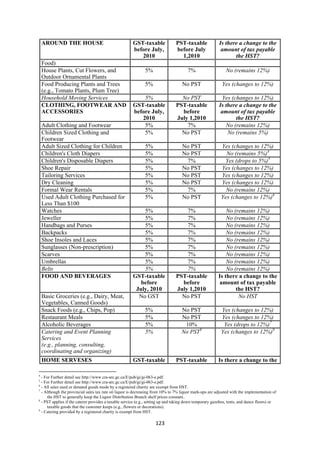
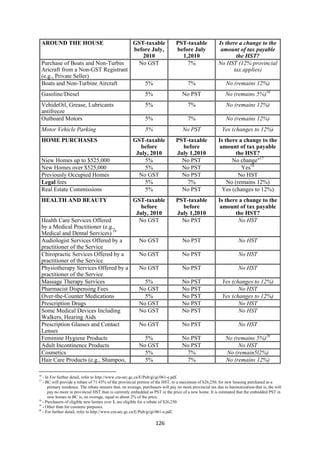
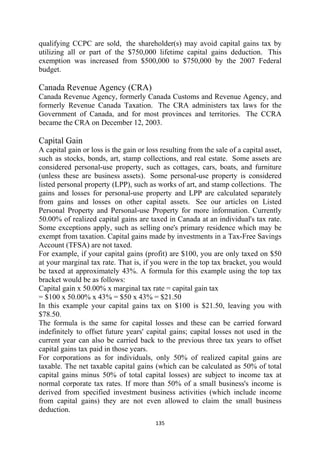
![Home Services
GST-taxable RST-taxable Is there a change
before before to the amount of
July 1, 2010 July 1,2010 tax payable under
the HST?
Cable Television Services 5% 8% No (remains 13%)
Cell Phone Services 5% 8% No (remains 13%)
Municipal Water No GST No RST No HST
Home Maintenance Equipment 5% 8% No (remains 13%)
Home Phone Services 5% 8% No (remains 13%)
Home Service Calls to Repair Free- 5% 8% No (remains 13%)
Standing Appliances such as Stoves,
Refrigerators, Washers, Dryers, and
Televisions
Home Insurance No GST 8% No (remains 8%)
Electricity and Heating (e.g., Natural 5% No RST Yes (changes to
Gas/Oil for Home) 13%)
Internet Access Services 5% No RST Yes (changes to
13%)
Home Service Calls by 5% No RST Yes (changes to
Electrician/Plumber/Carpenter to 13%)
Maintain or Repair Furnace, Leaky
Faucets, Bathtub, Toilet, Electrical
Wiring, etc.
Landscaping, Lawn-Care and Private 5% No RST Yes (changes to
Snow Removal 13%)
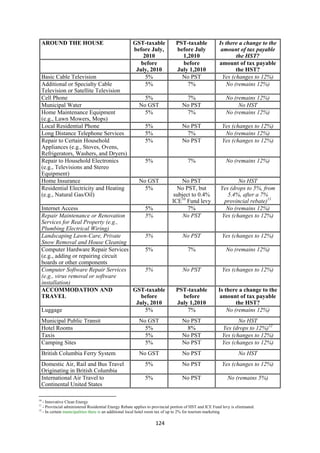
Accommodation and Travel
GST-taxable RST-taxable Is there a change to
before before the amount of tax
July 1, 2010 July 1,2010 payable under the
HST?
Luggage, Briefcases, Bags, etc. 5% 8% No (remains 13%)
Municipal Public Transit No GST No RST No HST
GO Transit No GST No RST No HST
Air travel originating in Ontario and 5% No RST No (remains 5%)
terminating in the U.S.[2]
Air travel originating in Ontario and No GST No RST No HST
terminating outside of Canada and
the U.S.[3]
115](https://image.slidesharecdn.com/canadataxation2012-120731035232-phpapp02/85/Canada-taxation-2012-115-320.jpg)
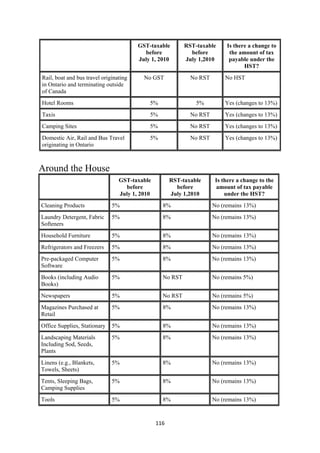
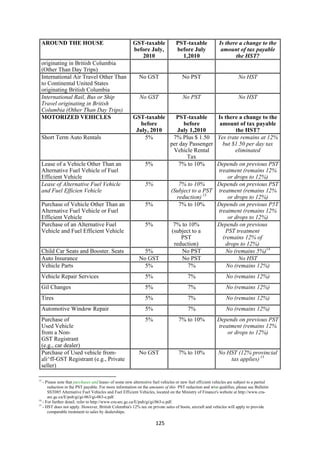
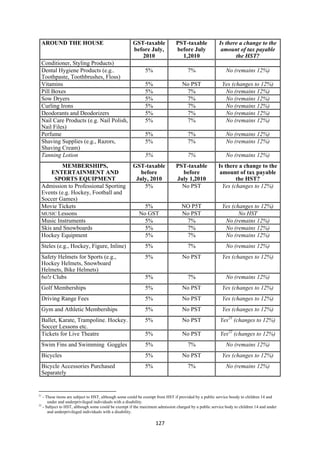
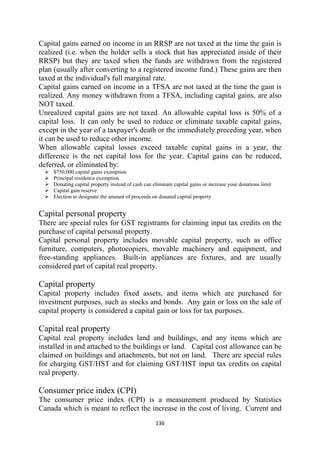
![GST-taxable RST-taxable Is there a change to the
before July 1, 2010 before July 1,2010 amount of tax payable
under the HST?
Recreational Vehicles 5% 8% No (remains 13%)
Private Resale of No GST 8% Yes[4] (changes to 13%)
Vehicles
Gasoline/Diesel 5% No RST Yes (changes to 13%)
Health Products and Services
GST-taxable RST-taxable Is there a change
before before to the amount of
July 1, 2010 July 1,2010 tax payable under
the HST?
Audiologist Services No GST No RST No HST if offered
by a practitioner of
the service.
Chiropractor Services No GST No RST No HST if offered
by a practitioner of
the service.
Physiotherapist Services No GST No RST No HST if offered
by a practitioner of
the service.
Pharmacist Dispensing Fees No GST No RST No HST
Over-the-Counter 5% 8% No (remains 13%)
Medications
Prescription Drugs No GST No RST No HST
Some Medical Devices No GST No RST No HST
Includes walkers, hearing
aids
Prescription glasses/contact No GST No RST No HST
lenses
Feminine Hygiene Products 5% No RST No (remains 5%)
Adult Incontinence Products No GST No RST No HST
Diapers 5% No RST No (remains 5%)
Cosmetics 5% 8% No (remains 13%)
118](https://image.slidesharecdn.com/canadataxation2012-120731035232-phpapp02/85/Canada-taxation-2012-118-320.jpg)
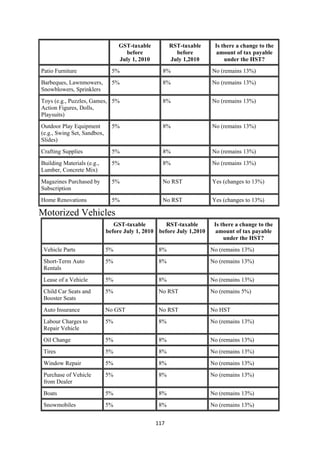
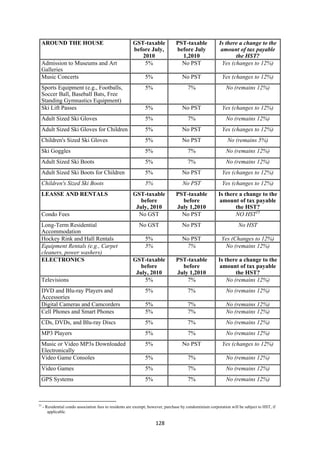
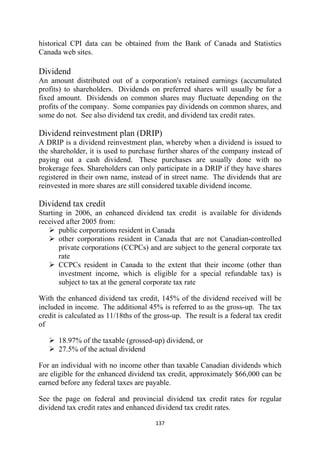
![Hair Care Products (e.g., 5% 8% No (remains 13%)
Shampoo, Conditioner,
Styling Products)
Dental Hygiene Products 5% 8% No (remains 13%)
(e.g., Toothpaste,
Toothbrushes)
Massage Therapy Services 5% No RST Yes (changes to
13%)
Vitamins 5% No RST Yes (changes to
13%)
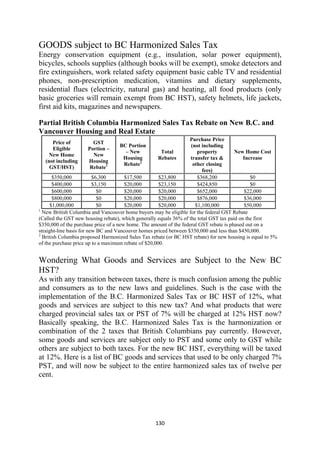
Home Purchases
GST-taxable before RST-taxable Is there a change to the
July 1, 2010 before July 1,2010 amount of tax payable
under the HST?
New Homes up to 5% No RST No change[5]
$400,000
New Homes over 5% No RST Yes[5A]
$400,000
Resale Homes No GST No RST No HST
Real Estate 5% No RST Yes (changes to 13%)
Commissions
Professional and Personal Services
GST-taxable RST-taxable Is there a change to the
before before amount of tax payable
July 1, 2010 July 1,2010 under the HST?
Child Care Services No GST No RST No HST
Legal Aid No GST No RST No HST
Coffins and Urns Purchased 5% 8% No (remains 13%)
Separately from a Package of
Funeral Services
Fitness Trainer 5% No RST Yes (changes to 13%)
Hair Stylist/Barber 5% No RST Yes (changes to 13%)
Aesthetician Services (e.g. 5% No RST Yes (changes to 13%)
Manicures, Pedicures,
Facials)
Funeral Services 5% No RST Yes (changes to 13%)
119](https://image.slidesharecdn.com/canadataxation2012-120731035232-phpapp02/85/Canada-taxation-2012-119-320.jpg)
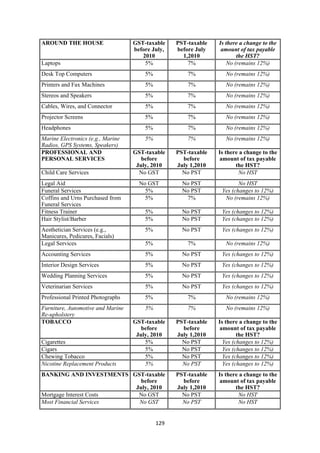
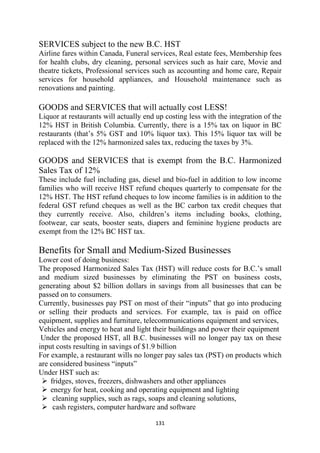
![GST-taxable RST-taxable Is there a change to the
before before amount of tax payable
July 1, 2010 July 1,2010 under the HST?
Legal Fees 5% No RST Yes (changes to 13%)
Memberships, Entertainment and Sports Equipment
GST-taxable RST-taxable Is there a change to the
before before amount of tax payable
July 1, 2010 July 1,2010 under the HST?
Admissions to 5% 10% Combined rate going down
Professional Sporting to 13% from current 15%
Events
Movie Tickets 5% 10% Combined rate going down
to 13% from current 15%
Music Lessons No GST No RST No HST
Skis and Snowboards 5% 8% No (remains 13%)
Hockey Equipment 5% 8% No (remains 13%)
Golf Clubs 5% 8% No (remains 13%)
Green Fees for Golf 5% No RST Yes (changes to 13%)
Gym and Athletic 5% No RST Yes (changes to 13%)
Membership Fees
Ballet, Karaté, 5% No RST Yes[6] (changes to 13%)
Trampoline, Hockey,
Soccer Lessons, etc.
Tickets for Live Theatre 5% No RST Yes[7] (changes to 13%)
with 3,200 Seats or Less
Leases and Rentals
GST-taxable RST-taxable Is there a change to the
before before amount of tax payable
July 1, 2010 July 1,2010 under the HST?
Condo Fees No GST[8] No RST[8] No HST[8]
Residential Rents No GST No RST No HST
Hockey Rink and 5% No RST Yes (changes to 13%)
Hall Rental Fees
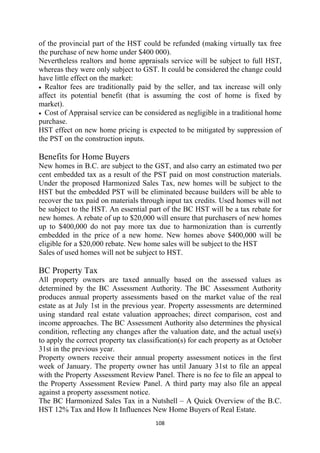
Footnotes:
[1] Although sales tax on alcohol is decreasing, other alcohol fees and taxes are changing to continue to support
social responsibility.
[2] Includes air travel terminating in the French islands of St. Pierre and Miquelon but does not include air travel
terminating in Hawaii.
120](https://image.slidesharecdn.com/canadataxation2012-120731035232-phpapp02/85/Canada-taxation-2012-120-320.jpg)
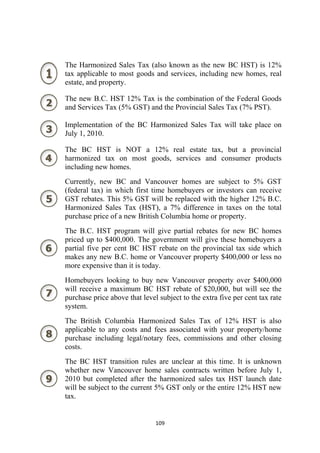
![[3] Includes air travel terminating in Hawaii but does not include air travel terminating in the French islands of
St. Pierre and Miquelon.
[4] HST does not apply; however, Ontario will maintain the RST on private transfers of used vehicles at a rate
of 13 per cent to help ensure a level-playing field between sales by dealerships and private sales.
[5] The new housing rebate will be 75 per cent of the Ontario component of the HST, up to a maximum of
$24,000. The rebate will ensure that buyers of homes priced up to $400,000 will, on average, pay no more tax
than under the RST system. However, applicable RST on building supplies is embedded in the price of the
home.
[5A] New homes purchased as primary residences, valued at $400,000 or more will be eligible for the maximum
new housing rebate of $24,000.
[6] HST taxable, although some could be HST-exempt if provided by a public service body to children 14 and
under and underprivileged individuals with a disability.
[7] HST taxable, although some could be exempt if maximum admission charged by a public service body is $1
or less, if the admissions are made in the course of the fundraising events where charitable receipts for income
tax purposes may be issued, or admissions are to amateur performances.
[8] Residential condo fees charged to residents are exempt; however, purchases by condominium corporations
will be subject to HST, if applicable.
121](https://image.slidesharecdn.com/canadataxation2012-120731035232-phpapp02/85/Canada-taxation-2012-121-320.jpg)
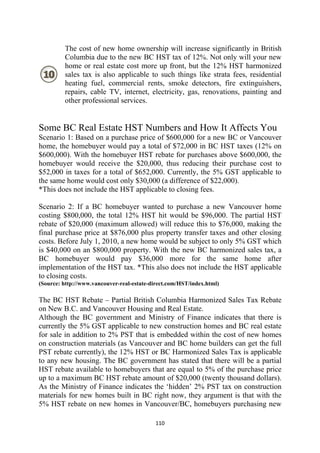
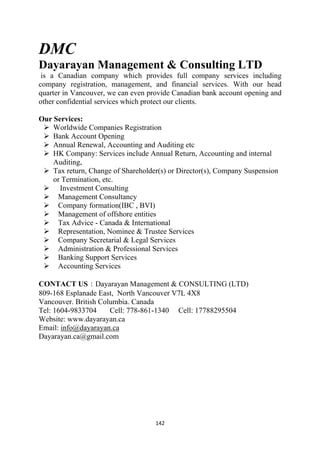
![plans (DB), and defined contribution pension plans (DC). Defined contribution
plans are also known as money purchase RPPs.
Registered retirement income fund (RRIF)
Registered retirement savings plans (RRSPs) must cashed out (taxable) or
converted to RRIFs (tax-free) no later than the year in which the RRSP holder
turns 71. The 2007 Federal budget revised this age from 69 to 71, for both
RRSPs and RPPs. See the article on conversion of RRSP to RRIF, on the
RRSPs/RRIFs page, for special rules for RRIF holders who turn 70 or 71 in
2007. Once the RRSP is converted to a RRIF, the holder must withdraw a
minimum amount each year, except in the first year. These withdrawals are
taxable to the holder. The withdrawals qualify as pension income for purposes
of the pension income tax credit for taxpayers 65 and over. Starting in 2007 the
withdrawals may be split with a spouse (pension splitting). It may be beneficial
to convert at least a portion of an RRSP to a RRIF when the taxpayer turns 65,
in order to generate income eligible for the pension tax credit, and for pension
splitting. The holder of the RRIF controls what investments are held in the
account.
Registered Retirement Savings Plan (RRSP)
An RRSP, or Registered Retirement Savings Plan, is a savings or investment
account which allows you to defer paying tax on funds deposited to it. When
you make a contribution to your RRSP, you get a tax deduction for the amount
contributed. The deduction reduces taxable income, so the higher your marginal
tax rate, the greater the tax savings will be.
References:
1. BC budget 2012,2011,2010
http://www.bcbudget.gov.bc.ca/2010/highlights/2010_Highlights.pdf
2. BC Budget 2009 http://www.bcbudget.gov.bc.ca/2009/estimates/2009_Estimates.pdf
3. http://www.fin.gov.bc.ca/Fed_Prov_MOU_english_July23.pdf
4. Taxation and Economic Efficiency: Results from a Canadian CGE Model, par
Maximilian Baylor et Louis Beauséjour, Canadian federal Finance Minister 2004
5. Vaughn Palmer Ambitious reforms by Liberal governments to be eclipsed by HST,
Vancouver Sun, July 28th, 2009
6. from [[2][Public account of Canada]], stating at $29.9 billions the 5% GST revenue
for whole Canada for the exercise 2007/2008, and considering the contributively part
of the British Columbia is of 15.4% in 2003 according to
http://www.parl.gc.ca/information/library/PRBpubs/prb0610-e.htm, , 29.9*(15.7%)=
$4.6Billions not including the BC GDP growth
7. http://www2.news.gov.bc.ca/news_releases_2009-2013/2009PREM0017-000141.htm
8. Taxation and Economic Efficiency: Results from a Canadian CGE Model, par
Maximilian Baylor et Louis Beauséjour, Canadian federal Finance Minister 2004
9. http://www.fraserinstitute.org/Commerce.Web/product_files/JulAug06ffTaxCuts.pdf
140](https://image.slidesharecdn.com/canadataxation2012-120731035232-phpapp02/85/Canada-taxation-2012-140-320.jpg)


![St. Lucia - Trade Profile [UWI's Shridath Ramphal Centre]](https://cdn.slidesharecdn.com/ss_thumbnails/st-lucia-110615102813-phpapp01-thumbnail.jpg?width=640&height=640&fit=bounds)
![Trinidad & Tobago - Trade Profile [UWI's Shridath Ramphal Centre]](https://cdn.slidesharecdn.com/ss_thumbnails/trinidadtobago-110615102333-phpapp01-thumbnail.jpg?width=640&height=640&fit=bounds)

![Guyana -Trade Profile [UWI's Shridath Ramphal Centre]](https://cdn.slidesharecdn.com/ss_thumbnails/guyana-110615104617-phpapp01-thumbnail.jpg?width=640&height=640&fit=bounds)
![Suriname - Trade Profile [UWI's Shridath Ramphal Centre]](https://cdn.slidesharecdn.com/ss_thumbnails/suriname-110615102519-phpapp02-thumbnail.jpg?width=640&height=640&fit=bounds)

![St. Kitts & Nevis - Trade Profile [UWI's Shridath Ramphal Centre]](https://cdn.slidesharecdn.com/ss_thumbnails/st-kittsnevis-110615102835-phpapp01-thumbnail.jpg?width=640&height=640&fit=bounds)

![Haiti - Trade Profile [UWI's Shridath Ramphal Centre]](https://cdn.slidesharecdn.com/ss_thumbnails/haiti-110615103001-phpapp01-thumbnail.jpg?width=640&height=640&fit=bounds)


