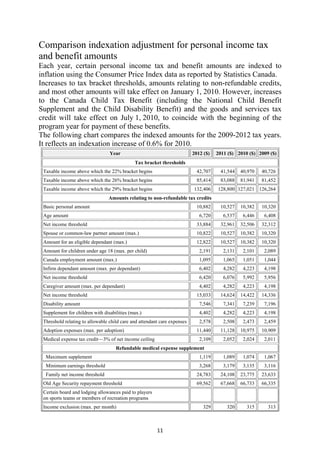
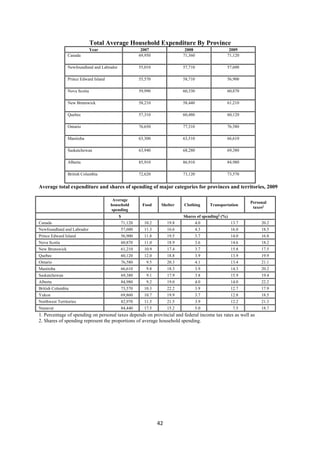
This booklet is intended to provide useful information to assist businesses in
Canada taxation and new harmonized sales tax (HST) in British Columbia, and
does not replace federal or provincial legislation and accompanying regulations.
It is strictly intended for reference purposes. As it may not completely address
your particular operation, you may wish to consult the appropriate legislation or
contact:
• Canada Revenue Agency at 1-800-959-5525 or www.cra-arc.gc.ca
• B.C. Ministry of Finance at 1-877-388-4440 or www.gov.bc.ca/fin/


                                       1
Canada at a glance
           Units                Scale       2000        2004        2007        2008          2010        2011        2012        2013        2014        2015
National currency              Billions    1,100.52    1,211.24    1,311.26    1,320.29      1,324.99    1,352.56    1,378.33    1,412.87    1,447.58    1,482.15
Index                                       97.825     106.577      116.65     121.444       122.613     126.287     128.741     131.506     134.295     137.104
National currency              Units      35,127.84   40,466.77   46,516.19   48,204.16     47,699.29   49,676.46   51,187.92   53,169.99   55,226.78   57,207.63
Current international dollar   Billions    888.552     1,065.76    1,263.63    1,300.55      1,334.14    1,391.11    1,432.61    1,477.94    1,527.17    1,582.35
Percent of GDP                               20.23      20.723      23.241      23.238        22.204       23.25      24.011       24.17      24.227      24.177
Percent of GDP                              23.623      23.036      24.077      23.569        19.072      19.916      20.196      20.655      21.042      21.596
Index                                       95.383     104.633      111.45     114.108       116.475     119.858     122.338      124.78      127.26     129.821
Percent change                               8.172      16.342      11.852          2.143     25.541      13.394       4.507       3.674       3.707       3.544
Percent change                               8.645      16.826      11.452          1.964     26.439      13.698       4.445       3.845       4.083       3.976
Percent change                               9.207      13.285       7.032       -4.629       18.649       9.563       3.677       4.759       4.959       5.084
Percent of GDP                              43.533      40.589      40.741      39.661        38.261      38.037      38.683      39.532      39.999      40.604
Percent of GDP                              40.588      39.726      39.158      39.535        43.815      42.304      41.876      41.441      41.047      40.808
Percent of GDP                              46.227      35.213      22.917      22.306        32.224      34.916      36.802      37.056      36.465      35.088
Percent of GDP                              82.127      72.601      66.518      71.114        83.953      84.117      84.163      82.287      79.694      76.444
Percent of GDP                               2.719       2.311       0.835          0.329      -3.131      -3.334      -3.814      -3.515      -3.185       -2.58


                                                                                2
Welcome to the City of Vancouver
Bordered by the Coast Mountain Range and the Pacific Ocean, Vancouver is
recognized as one of the world's most livable cities. Archaeological evidence
shows that the Coast Salish people had settled the Vancouver area by 500 BC.
The City of Vancouver is renowned for its innovative programs in the areas of
sustainability, accessibility and inclusivity. In 2010, Vancouver will host the
world at the 2010 Olympic and Paralympics Winter Games.


Facts about Vancouver
Population/ Climate
Vancouver is the eighth largest city in Canada with a population of 578,000
(2006 census) and has one of the mildest climates in Canada with temperatures
averaging around 3 degrees Celsius in January and 18 degrees Celsius in July. It
covers 114.7 sq km (44.3 sq miles), and is part of Metro Vancouver, the third
largest metropolitan area in Canada, with a population of 2.1 million (2006
census).

Business/ Economy
Vancouver has Canada's largest and most diversified port, trading $75 billion in
goods annually. It is home to a variety of different industries, including the
mining, forest, biotech, film and software industries.


                                       3
History
Archaeological evidence shows that the Coast Salish people had settled the
Vancouver area by 500 BC. In the 1870s, Vancouver was founded as a sawmill
settlement called Granville. And in 1886, the city was incorporated and renamed
Vancouver after Captain George Vancouver, a British naval captain who
explored the area in 1792.
    Source: http://vancouver.ca/aboutvan.htm


Canada at a Glance
Population Table:
                                                      1995          2005               2010         2011
                        Year                                                number

Canada                                              29,302,311    32,245,209         34,605,346   34,605,346

Newfoundland and Labrador                            567,397       514,363            511,272      511,272

Prince Edward Island                                 134,415       138,055            146,152      146,152

Nova Scotia                                          928,120       937,941            946,378      946,378

New Brunswick                                        750,943       747,960            755,810      755,810

Quebec                                              7,219,219     7,581,911          8,002,098    8,002,098

Ontario                                             10,950,119    12,528,480         13,422,912   13,422,912

Manitoba                                            1,129,150     1,178,301          1,254,658    1,254,658

Saskatchewan                                        1,014,187      993,579           1,063,535    1,063,535
Alberta                                             2,734,519     3,322,200          3,798,791    3,798,791

British Columbia                                    3,777,390     4,196,788          4,592,034    4,592,034

Yukon                                                30,442        31,904             34,891       34,891
Northwest Territories                                41,432        43,399             43,485       43,485

Nunavut                                                                               33,330       33,330
                                                     24,978        30,328

Source: Statistics Canada, CANSIM table 051-0005.


                                                              4
Canadian federal marginal tax rates of taxable income 1998-2012
       $0 - $10,527   $10,527 - $42,707   $42,707- $85,414    $85,414-132,406         over $132,406
2012                                                             $128,800
           0%               %15                 %22                 %22                   %29

       $0 - $10,527   $10,527 - $41,544   $41,544 - $83,088   $81,941 $128,800        over $128,800
2011
           0%               %15                 %22                 %22                   %29

       $0 - $10,382   $10,382 - $40,970   $40,970 - $81,941   $81,941 $127,021        over $127,021
2010
           0%               %15                 %22                 %22                   %29
2009   $0 - $10,320   $10,321 - $40,726   $40,727 - $81,452   $81,453 - $126,264      over $126,264
           0%               15%                 22%                 26%                   29%
        $0 - $9,600    $9,601 - $37,885   $37,886 - $75,769   $75,770 - $123,184      over $123,184
2008
           0%               15%                 22%                 26%                   29%
        $0 - $9,600    $9,600 - $37,178   $37,178 - $74,357   $74,357 - $120,887      over $120,887
2007
           0%               15%                 22%                 26%                   29%
        $0 - $8,839    $8,839 - $36,378   $36,378 - $72,756   $72,756 - $118,285      over $118,285
2006
           0%              15.25%               22%                 26%                   29%
        $0 - $8,648    $8,648 - $35,595   $35,595 - $71,190   $71,190 - $115,739      over $115,739
2005
           0%               15%                 22%                 26%                   29%
        $0 - $8,012    $8,012 - $35,000   $35,000 - $70,000   $70,000 - $113,804      over $113,804
2004
           0%               16%                 22%                 26%                   29%
        $0 - $7,756    $7,756 - $32,183   $32,183 - $64,368   $64,368 - $104,648      over $104,648
2003
           0%               16%                 22%                 26%                   29%
        $0 - $7,634    $7,634 - $31,677   $31,677 - $63,354   $63,354 - $103,000      over $103,000
2002
           0%               16%                 22%                 26%                   29%
        $0 - $7,412    $7,412 - $30,754   $30,754 - $61,509   $61,509 - $100,000      over $100,000
2001
           0%               16%                 22%                 26%                   29%
        $0 - $7,231    $7,231 - $30,004   $30,004 - $60,009            over $60,009
2000
           0%               17%                 25%                    29%
        $0 - $6,794    $6,794 - $29,590   $29,590 - $59,180            over $59,180
1999
           0%               17%                 26%                    29%
        $0 - $6,794    $6,794 - $29,590   $29,590 - $59,180            over $59,180
1998
           0%               17%                 26%                    29%


  Income not taxed
  The following types of income are not taxed in Canada (this list is not
  exhaustive):
       gifts and inheritances;
       lottery winnings;

                                                 5
Goods & Services Tax
The federal government's sales tax is a value-added tax.

Harmonized Sales Tax
The Harmonized Sales Tax (HST) is used in certain provinces to combine the
federal Goods and Services Tax (GST) and the Provincial Sales Tax (PST) into
a single, blended, sales tax. Currently, there is a 13% HST in the provinces of
New Brunswick, Newfoundland, and Nova Scotia. The HST is collected by the
Canada Revenue Agency, which then remits the appropriate amounts to the
participating provinces. Like the GST, the HST is value-added. Effective July 1,
2010 British Columbia and Ontario will adopt HST replacing their current PST
at 12% and 13% respectively.

                         Annual revenue from taxable sales
                                $1.5M or less:         report annually
                       More than $1.5M up to $6M: report quarterly
                              More than $6M:           report monthly
If you wish to change your reporting period, perhaps because your business uses accounting
periods that are not monthly or quarterly, you must notify the Canada Revenue Agency.


Provincial Sales Taxes
Separate Provincial Sales Taxes (PST) are collected in the provinces of British
Columbia, Saskatchewan, Manitoba, Ontario, Quebec (called QST for Quebec
Sales Tax, in French TVQ, Taxes des Ventes du Québec), and Prince Edward
Island. Goods to which the tax is applied varies by province, as does the rate.
Moreover, for those provinces whose provincial sales tax is applied to the
combined cost and GST, provincial revenues decline or increase with respective
changes in the GST. Of the provincial sales taxes, only the QST (and the HST)
are value-added; the rest are cascading taxes.


                                             6
Rate Combined fed.
         Province                                                      Note
                       (%) /prov. rate (%)
                                             • food, fuel, children's sized clothes and footwear as
                                             well as some other items and service are exempted (see
                                             Sales taxes in British Columbia for more detail)
    British Columbia   7     12              • Alcohol is taxed at 10%.
                                             • Passenger vehicles are taxed at between 7% to 10%
                                             based on purchase price.
                                             • Harmonized Sales Tax takes effect on July 1, 2010.
                                             • Alberta has no provincial sales tax. There is a 4% tax
    Alberta            0     5               on lodging.
                                             • Reduced from 7% on 28 October 2006
    Saskatchewan       5     10              • There is a separate 10% liquor consumption tax. The
                                             non-alcoholic portion of a restaurant meal is not taxed.
    Manitoba           7     12
                                             • PST is usually 8%, but is 5% on lodging, 10% on
                                             entertainment and alcohol at restaurants and 12% on
    Ontario            8     13              alcohol at retail stores on top of the flat LCBO liquor
                                             mark-ups.
                                             • Harmonized Sales Tax takes effect on July 1, 2010.
                                             • Provincial rate is nominally 7.5%, but also applied to
    Quebec             7.5   12.875          federal 5% GST. Effectively 7.875%
    Prince Edward                            • Provincial rate is nominally 10%, but also applied to
                       10    15.5
    Island                                   federal 5% GST. Effectively 10.5%
    New Brunswick      13
    Nova Scotia        13                    • Harmonized Sales Tax includes provincial tax and
                                             GST
    Newfoundland and
    Labrador
                       13


GST/HST rates
The GST is a tax that applies on most supplies of goods and services made in
Canada. The GST also applies to supplies of real property (for example, land,
buildings and interests in such property) and intangible property such as
trademarks, rights to use a patent, and digitized products downloaded from the
Internet and paid for individually.
The participating provinces (Nova Scotia, New Brunswick, and Newfoundland
and Labrador) harmonized their provincial sales tax with the GST to implement
the HST. Generally, the HST applies to the same base of goods and services as
the GST. As of July 1, 2010, Ontario harmonized its retail sales tax with the
GST to implement the HST and British Columbia harmonized its provincial
sales tax with the GST to implement the HST. Also, as of July 1, 2010, Nova
Scotia increased its HST rate from 13% to 15%. For information see Nova
Scotia HST rate increase.


                                                   7
In Quebec, Revenue Québec administers the GST/HST. If your business is
located in Quebec, visit the Revenu Québec Web site.

The HST breakdown:
•   The HST rate of 12% includes the 5% federal part and 7% provincial part.
•   The HST rate of 13% includes the 5% federal part and 8% provincial part.
•   The HST rate of 15%* includes the 5% federal part and 10% provincial part.
    (As of July 1, 2010)
•   The HST rate of 14% includes the 6% federal part and 8% provincial part.
    The HST rate of 15% includes the 7% federal part and 8% provincial part.


                                GST/HST Rates
                                               On or after       Before
                                                                               On or after
                                               January 1,     January 1,                       Before
                                On or after                                   April 1, 1997,
              Provincial                        2008, and      2008, and                       April 1,
                                July 1, 2010                                   and before
                                               before July   after June 30,                     1997
                                                                              July 1, 2006
                                                 1, 2010          2006
    Alberta                         5%             5%             6%               7%            7%

    British Columbia                12%            5%             6%               7%            7%

    Manitoba                        5%             5%             6%               7%            7%

    New Brunswick                   13%           13%             14%             15%            7%

    Newfoundland and Labrador       13%           13%             14%              15%           7%

    Northwest Territories           5%             5%             6%               7%            7%

    Nova Scotia                    15%*           13%             14%              15%           7%

    Nunavut                         5%             5%             6%               7%            7%

    Ontario                         13%            5%             6%               7%            7%

    Prince Edward Island            5%             5%             6%               7%            7%

    Saskatchewan                    5%             5%             6%               7%            7%

    Yukon                           5%             5%             6%               7%            7%


                                                        8
Non-Refundable Tax Credit Blocks BC / 2000-2012

                                                                                                                                                           Base Amount
                           Credit                                                                                                                                                                                                                            Subject to
                                                                2000            2001          2002           2003              2004            2005              2006           2007          2008          2009         2010          2011        2012      Indexing
Personal Credits
Basic Personal Amount                                             $7,231          $8,000        $8,168         $8,307            $8,523           $8,676           $8,858         $9,027        $9,189        $9,373      $11,000     $11,088     $11,355       yes
Spousal                                                           $6,140          $6,850        $6,994         $7,113            $7,298           $7,429           $7,585         $7,729        $7,868        $8,026       $9,653      $9,730      $9,964       yes
Reduced when spousal income exceeds                               ($614)          ($685)        ($699)         ($711)            ($730)           ($743)           ($759)         ($773)        ($787)        ($803)       ($965)      $ (973)     ($996)
Eligible Dependant                                                $6,140          $6,850        $6,994         $7,113            $7,298           $7,429           $7,585         $7,729        $7,868        $8,026       $9,653      $9,730      $9,964       yes
Reduced when dependant income exceeds                             ($614)          ($685)        ($699)         ($711)            ($730)           ($743)           ($759)         ($773)        ($787)        ($803)       ($965)      $(973)      ($996)
Infirm Dependant Credit                                           $2,386          $2,424        $3,574         $3,635            $3,730           $3,797           $3,876         $3,949        $4,021        $4,101       $4,118      $4,151      $4,250       yes
Reduced when dependant income exceeds                           ($11,661)       ($5,576)       ($5,693)      ($5,790)           ($5,940)        ($6,047)          ($6,174)      ($6,292)      ($6,405)      ($6,533)      ($6,559)    $(6,611)    ($6,770)
In-home care of relative                                          $2,386          $2,424        $3,574         $3,634            $3,730           $3,796           $3,877         $3,949        $4,021        $4,101       $4,118      $4,150      $4,250       yes
Reduced when relative's income exceeds                           ($4,845)      ($11,848)      ($12,096)     ($12,302)          ($12,621)       ($12,849)         ($13,118)     ($13,368)     ($13,608)     ($13,881)     ($13,936)   ($14,048)   ($12,385)
Age (65 or older by end of taxation year)                         $3,531          $3,587        $3,663         $3,725            $3,822           $3,891           $3,972         $4,048        $4,121        $4,203       $4,220      $4,254      $4.250       yes
Reduced when income exceeds                                     ($26,284)      ($26,705)      ($27,265)     ($27,729)          ($28,450)       ($28,962)         ($29,570)     ($30,132)     ($30,674)                               $(31,664)   ($32,424
Pension Credit                                                    $1,000          $1,000        $1,000         $1,000            $1,000           $1,000           $1,000         $1,000        $1,000        $1,000       $1,000      $1,000      $1,000       no
Adoption Expense Credit
Based on actual adoption expenses to a maximum of '1'             -              -              -             -                  -               -                 -           Actual        Actual        Actual       Actual        Actual      Actual        no
(based on federal indexed maximum amount)
Charitable and other gifts
                                                               Actual          Actual        Actual         Actual            Actual           Actual           Actual         Actual        Actual        Actual       Actual        Actual      Actual        no
Lowest tax rate on first $200; highest tax rate on excess
Medical Expense Credit
                                                               Actual          Actual        Actual         Actual            Actual           Actual           Actual         Actual        Actual        Actual       Actual        Actual      Actual        yes
Reduced by lesser of '2' or 3% of net income
Credit for Mental or Physical Impairment                          $4,293          $4,362        $6,126         $6,230            $6,392           $6,507           $6,644         $6,770        $6,892        $7,030       $7,058      $7,114      $7,285       yes
Credit for Mental or Physical Impairment for child
                                                                  $2,941          $2,988        $3,574         $3,635            $3,729           $3,796           $3,876         $3,950        $4,021        $4,101       $4,118      $4,151      $4,250       yes
under 18
Reduced by attendant care and child care expenses in
                                                                  $2,000          $2,032        $2,075         $2,110            $2,165           $2,204           $2,250         $2,293        $2,334        $2,381       $2,391      $2,410      $2,468
excess of '3' claimed in respect of the impaired child
Tuition Credit                                                 Actual          Actual        Actual         Actual            Actual           Actual           Actual         Actual        Actual        Actual       Actual        Actual      Actual        no
Education
Full-time student                                            $200/month      $200/month    $200/month     $200/month        $200/month     $200/month         $200/month     $200/month    $200/month    $200/month    $200/month        $200        $200
Part-time student                                             $60/month      $60/month      $60/month     $60/month         $60/month       $60/month          $60/month     $60/month     $60/month     $60/month     $60/month          $60         $60       no
Student Loan Interest                                          Actual          Actual        Actual         Actual            Actual           Actual           Actual         Actual        Actual        Actual       Actual        Actual      Actual        no
EI and CPP Credit                                              Actual          Actual        Actual         Actual            Actual           Actual           Actual         Actual        Actual        Actual       Actual        Actual      Actual        no


                                          2000              2001            2002           2003           2004              2005               2006             2007           2008           2009            2010         2011            2012
                                1           -                 -               -              -              -                 -                  -             $10,445        $10,643        $10,909         $10,975      $11,128          11,440
                                2         $1,637            $1,633          $1,698         $1,727         $1,772            $1,804             $1,842           $1,877         $1,911         $1,949          $1,957       $1,972          $2,020
                                3         $2,000            $2,032          $2,075         $2,110         $2,165            $2,204             $2,250           $2,293         $2,334         $2,381          $2,391       $2,410          $2,468


                                                                                                                                           9
Tax Credits - Low Income Climate Action Tax Credit
Effective July 2008, individuals may be eligible for the B.C. refundable Low
Income Climate Action Tax Credit.
You are eligible for the Low Income Climate Action Tax Credit if you are a
resident of British Columbia, and
   • you are 19 years of age or older or
   • you have a spouse or common-law partner or
   • you are a parent who resides with your child
For payments commencing in 2008 the maximum credit is $100 for yourself,
$100 for your spouse or common-law partner and $30 for each qualified
dependant.
If you are a single parent the maximum credit is $100 for yourself, $100 for
your first child and $30 for each additional child.
For payments starting in July 2009 and July 2010 the maximum credits are
increased to $105 and $31.50.
For payments starting July 2011 the maximum credits are increased to $115.50
and $34.50
The Low Income Climate Action Tax Credit is reduced by 2% of net family
income over the income threshold. The income thresholds are indexed to the
Consumer Price Index for British Columbia.
    Tax Year                                Net Income Threshold   Net Income Threshold Married or
                    Payment Dates
                                                    Single                  Single Parent
      2012     For July 2011 to June 2012          $30,968                     $36,130
      2011     For July 2010 to June 2011          $30,722                     $35,843
      2010     For July 2009 to June 2010          $30,600                     $35,700
      2009     For July 2008 to June 2009          $30,000                     $35,000


Claiming the Credit
The tax credit will be paid quarterly together with the federal Goods and
Services Tax Credit in July, October, January and April.
You cannot claim this credit if you were confined to a prison or similar
institution for a period of at least 90 days that includes the first day of that
quarter.


                                                     10
Comparison indexation adjustment for personal income tax
and benefit amounts
Each year, certain personal income tax and benefit amounts are indexed to
inflation using the Consumer Price Index data as reported by Statistics Canada.
Increases to tax bracket thresholds, amounts relating to non-refundable credits,
and most other amounts will take effect on January 1, 2010. However, increases
to the Canada Child Tax Benefit (including the National Child Benefit
Supplement and the Child Disability Benefit) and the goods and services tax
credit will take effect on July 1, 2010, to coincide with the beginning of the
program year for payment of these benefits.
The following chart compares the indexed amounts for the 2009-2012 tax years.
It reflects an indexation increase of 0.6% for 2010.
                                    Year                                     2012 ($)   2011 ($) 2010 ($) 2009 ($)
                                                Tax bracket thresholds
    Taxable income above which the 22% bracket begins                          42,707    41,544    40,970   40,726
    Taxable income above which the 26% bracket begins                          85,414    83,088    81,941   81,452
    Taxable income above which the 29% bracket begins                        132,406    128,800 127,021 126,264
                                   Amounts relating to non-refundable tax credits
    Basic personal amount                                                      10,882    10,527    10,382   10,320
    Age amount                                                                  6,720      6,537    6,446    6,408
    Net income threshold                                                       33,884    32,961    32,506   32,312
    Spouse or common-law partner amount (max.)                                 10,822    10,527    10,382   10,320
    Amount for an eligible dependant (max.)                                    12,822    10,527    10,382   10,320
    Amount for children under age 18 (max. per child)                           2,191      2,131    2,101    2,089
    Canada employment amount (max.)                                             1,095      1,065    1,051    1,044
    Infirm dependant amount (max. per dependant)                                6,402      4,282    4,223    4,198
    Net income threshold                                                        6,420      6,076    5,992    5,956
    Caregiver amount (max. per dependant)                                       4,402      4,282    4,223    4,198
    Net income threshold                                                       15,033    14,624    14,422   14,336
    Disability amount                                                           7,546      7,341    7,239    7,196
    Supplement for children with disabilities (max.)                            4,402      4,282    4,223    4,198
    Threshold relating to allowable child care and attendant care expenses      2,578      2,508    2,473    2,459
    Adoption expenses (max. per adoption)                                      11,440    11,128    10,975   10,909
    Medical expense tax credit—3% of net income ceiling                         2,109      2,052    2,024    2,011
                                       Refundable medical expense supplement
     Maximum supplement                                                         1,119      1,089    1,074    1,067
     Minimum earnings threshold                                                 3,268      3,179    3,135    3,116
     Family net income threshold                                               24,783    24,108    23,775   23,633
    Old Age Security repayment threshold                                       69,562    67,668    66,733   66,335
    Certain board and lodging allowances paid to players
    on sports teams or members of recreation programs
    Income exclusion (max. per month)                                            329        320      315      313


                                                           11
Year                                  2012 ($)     2011 ($) 2010 ($) 2009 ($)
    Tradesperson’s tools deduction
    Threshold amount relating to cost of eligible tools                         1,095      1,065    1,051    1,044
    Goods and services tax credit
    Adult maximum                                                                260        253      250      248
    Child maximum                                                                137        133      131      130
    Single supplement                                                            137        133      131      130
    Phase-in threshold for the single supplement                                8,439      8,209    8,096    8,047
    Family net income at which credit begins to phase out                      33,884    32,961    32,506   32,312
                                                Canada Child Tax Benefit
    Base benefit                                                                1,405      1,367    1,348    1,340
    Additional benefit for third child                                            98         95       94       93
    Family net income at which base benefit begins to phase out                42,707    41,544    40,970   40,726
                                         National Child Benefit (NCB) supplement
    First child                                                                 2,177      2,118    2,088    2,076
    Second child                                                                1,926      1,873    1,848    1,837
    Third child                                                                 1,832      1,782    1,758    1,747
    Family net income at which NCB supplement begins to phase out              24,863    24,183    23,855   23,710
    Family net income at which NCB supplement phase-out is complete            42,707    41,544    40,970   40,726
                                             Canada Disability Benefit (CDB)
    Maximum benefit                                                             2,575      2,504    2,470    2,455
    Family net income at which CDB supplement begins to phase out              42,707    41,544    40,970   40,726
                                           Children’s Special Allowances (CSA)
    CSA Base Amount                                                             3,582      3,485    3,436    3,416


                                                            12
Indexation adjustment for personal income tax and benefit amounts / 2005-2012 
                                                                             2005        2006         2007          2008        2009         2010        2011            2012
                                                                              ($)         ($)          ($)           ($)         ($)          ($)         ($)             ($)
Taxable income above which the 22% bracket begins                           35,595      36,378       37,178          37,885       40,726      40,970      41,544         42,707
Taxable income above which the 26% bracket begins                           71,190      72,756       74,357          75,769       81,452      81,941      83,088         85,414
Taxable income above which the 29% bracket begins                          115,739      118,285      120,887        123,184     126,264      127,021     128,800     132,406
                                                                    Amounts relating to non-refundable tax credit
Basic personal amount                                                       8,648        9,039        9,600           9,600       10,320      10,382      10,527         10,822
Age amount                                                                  3,979        4,066        5,177           5,276        6,408       6,446       6,537          6,720
Net income threshold                                                        29,619      30,270       30,936          31,524      32,312       32,506      32,961         33,884
Spouse or common-law partner amount (max.)                                  7,344        7,675         9,600          9,600       10,320      10,382      10,527         10,822
Amount for an eligible dependant (max.)                                        -         7,505         9,600          9,600       10,320      10,382      10,527         12,822
Amount for children under age 18 (max. per child)                              -           -          2,000           2,038       2,089        2,101       2,131          2,191
Canada employment amount (max.)                                                -           -          1,000           1,019       1,044        1,051       1,065          1,095
Infirm dependant amount (max. per dependant)                                3,848        3,933        4,019           4,095       4,198        4,223       4,282          6,402
Net income threshold                                                        5,460        5,580        5,702           5,811       5,956        5,992       6,076          6,420
Caregiver amount (max. per dependant)                                       3,848        3,933        4,019           4,095       4,198        4,223       4,282          4,402
Net income threshold                                                        13,141      13,430       13,726          13,986      14,336       14,422      14,624         15,033
Disability amount                                                           6,596        6,741        6,890           7,021       7,196        7,239       7,341          7,546
Supplement for children with disabilities (max.)                            3,848        3,933        4,019           4,095       4,198        4,223       4,282          4,402
Threshold relating to allowable child care and attendant care expenses      2,254        2,303        2,354           2,399       2,459        2,473       2,508          2,578
Adoption expenses (max. per adoption)                                       10,000      10,220       10,445          10,643      10,909       10,975      11,128         11,440
Medical expense tax credit—3% of net income ceiling                         1,844        1,884        1,926           1,962       2,011        2,024       2,052          2,109
Certain board & loading
Maximum supplement                                                           750         1,000        1,022           1,041       1,067        1,074       1,089          1,119
Minimum earnings threshold                                                  2,857        2,919        2,984           3,040       3,116        3,135       3,179          3,268
Family net income threshold                                                 21,663      22,140       22,627          23,057      23,633       23,775      24,108         24,783
Old Age Security repayment threshold                                        60,806      62,144       63,511          64,718      66,335       66,733      67,668         69,562


Income exclusion (max. per month)                                              -           -            -             -                313         315         320         329


Threshold amount relating to cost of eligible tools                            -           -            -             -           1,044        1,051       1,065          1,095


Adult maximum                                                                227          232          237                242          248         250         253   260
Child maximum                                                                120          122          125                127          130         131         133   137
Single supplement                                                            120          122          125                127          130         131         133   137
Phase-in threshold for the single supplement                                7,377        7,539        7,705           7,851       8,047        8,096       8,209     8,439
Family net income at which credit begins to phase out                       29,618      30,270       30,936          31,524      32,312       32,506      32,961     33,884


Base benefit                                                                1,228        1,255        1,283           1,307       1,340        1,348       1,367     405
Additional benefit for third child                                            86          88           90                  91           93          94          95   98

                                                                             243          249           -             -                  -     -           -         -
Additional benefit for children under 7 years
Family net income at which base benefit begins to phase out                 35,595      36,378       37,178          37,885       40,726      40,970      41,544     42,707


First child                                                                 1,722        1,945        1,988           2,025       2,076        2,088       2,118     2,177
Second child                                                                1,502        1,720        1,758           1,792       1,837        1,848       1,873     1,926
Third child                                                                 1,420        1,637        1,673           1,704       1,747        1,758       1,782     1,832
Family net income at which NCB supplement begins to phase out                  -           -         20,883          21,287       23,710      23,855      24,183     24,863
Family net income at which NCB supplement phase-out is complete             35,595      36,378       37,178          37,885       40,726      40,970      41,544     42,707


Maximum benefit                                                             2,000        2,300        2,351           2,395       2,455        2,470       2,504     2,575
Family net income at which CDB supplement begins to phase out               35,595      36,378       37,178          37,885       40,726      40,970      41,544     42,707


CSA Base Amount                                                                -           -          3,271           3,332       3,416        3,436       3,485     3,582


                                                                                        13
Canadian Pension Plan (CPP)
Since January 1, 2012, you may have to deduct CPP contributions from the
pensionable earnings you pay an employee who is 60 to 70 years of age, even if
the employee is receiving a CPP or QPP retirement pension.
Under the new rules, an employee who works and receives a CPP or QPP
retirement pension now has to contribute to the CPP if he or she is:
• 60 to 65 years of age;
• 65 to 70 years of age, unless the employee has filed an election with you or
another employer to stop paying CPP contributions (the election will take effect
on the first day of the month following the month the employee provides you
with a completed and signed election form);
• 65 to 70 years of age, if the employee revoked his or her election to stop
paying CPP contributions in 2013 or later.

Notes
These legislative amendments do not affect the salary or wages of an employee
who is considered to be disabled under the CPP or QPP, nor do they affect the
salary and wages of a person who has reached 70 years of age. Do not deduct
CPP contributions from the salary and wages that you pay these employees.
Employees working in Quebec and other workers not subject to the CPP are not
affected by these changes.
You have to deduct CPP contributions from an employee who is employed in
pensionable employment and is receiving pensionable earnings, and meets one
of these conditions:
•    Who is currently receiving a CPP or QPP retirement pension and is 60 to 65
years of age, even if it means deducting from someone who was not
contributing in a previous year because he or she was receiving a CPP/QPP
retirement pension;
OR
•    Who is currently receiving a CPP or QPP retirement pension and is 65 to 70
years of age, and who has not given you a copy of a signed and completed Form
CPT30, Election to Stop Contributing to the Canada Pension Plan, or
Revocation of a Prior Election.

Note
The CRA can assess you for failing to deduct CPP contributions or for failing to
remit the CPP contributions to the CRA as required. The assessment may also
include penalty and interest charges. For more information, go to Penalties,
interest, and other consequences.


                                       14
Canada Pension Plan Payment Rates
                                                                  Average benefit
                                                                                       Maximum monthly
                          Type of benefit                          (September
                                                                                        benefit (2011)
                                                                      2010)
Disability benefit                                                $810.46           $1,153.37
Retirement pension (at age 65)                                    $504.50           $960.00
Survivors benefit (under age 65)                                  $364.85           $529.09
Survivors benefit (age 65 and over)                               $297.72           $576.00
Children of disabled contributors benefit                         $214.85           $218.50
Children of deceased contributors benefit                         $214.85           $218.50
Combined survivors & retirement benefit (pension at age 65)       $682.21           $960.00
Combined survivors & disability benefit                           $940.78           $1,153.37
                                                                                    Maximum
Death benefit                                                                       one-time payment
                                                                  $2,252.93         $2,500.00


    EI premium rates and maximums
Year    Max. Annual Insurable           Rate (%)      Max. Annual Employee          Max. Annual Employer
              Earnings                                      Premium                       Premium

                                   Federal Quebec      Federal         Quebec        Federal       Quebec
2012            $45,900               1.83    1.47    $839.97          $674.96      $1,176.96      $944.62
2011            $44,200               1.78    1.41    $786.76          $623.22      $1,101.46      $872.51
2010            $43,200               1.73    1.36    $747.36          $587.52      $1,046.30      $822.53
2009            $42,300               1.73    1.38    $731.79          $583.74      $1,024.51      $817.24
2008            $41,100               1.73    1.39    $711.03          $571.29       $995.44       $799.81
2007            $40,000               1.80    1.46    $720.00          $584.00      $1,008.00      $817.60
2006            $39,000               1.87    1.53    $729.30          $596.70      $1,021.02      $835.38
2005            $39,000               1.95    N/A     $760.50           N/A         $1,064.70          N/A
2004            $39,000               1.98    N/A     $772.20           N/A         $1,081.08          N/A
2003            $39,000               2.10    N/A     $819.00           N/A         $1,146.60          N/A
2002            $39,000               2.20    N/A     $858.00           N/A         $1,201.20          N/A
2001            $39,000               2.25    N/A     $877.50           N/A         $1,228.50          N/A
2000            $39,000               2.40    N/A     $936.00           N/A         $1,310.49          N/A
1999            $39,000               2.55    N/A     $994.50           N/A         $1,392.30          N/A
1998            $39,000               2.70    N/A     $1,053.00         N/A         $1,474.20          N/A
1997            $39,000               2.90    N/A     $1,131.00         N/A         $1,583.40          N/A

       Important Note
       Quebec offers its own parental benefits. For more information, visit
       the Revenu Québec site.


                                                     15
CPP contribution rates, maximums and exemptions 1997-2012
Year   Max. Annual Pensionable     Basic     Maximum Contributory     Employee Contribution   Max. Annual Employee    Max. Annual Self -
              Earnings           Exemption        Earnings                  Rate (%)              Contribution       Employed Contribution
2012          $50,100             $3,500           $46,600                    4.95                 $2,306.70               $4,613.40
2011          $48,300             $3,500           $44,800                    4.95                 $2,217.60               $4,435.20
2010          $47,200             $3,500           $43,700                    4.95                 $2,163.15               $4,326.30
2009          $46,300             $3,500           $42,800                    4.95                 $2,118.60               $4,237.20
2008          $44,900             $3,500           $41,400                    4.95                 $2,049.30               $4,098.60
2007          $43,700             $3,500           $40,200                    4.95                 $1,989.90               $3,979.80
2006          $42,100             $3,500           $38,600                    4.95                 $1,910.70               $3,821.40
2005          $41,100             $3,500           $37,600                    4.95                 $1,861.20               $3,722.40
2004          $40,500             $3,500           $37,000                    4.95                 $1,831.50               $3,663.00
2003          $39,900             $3,500           $36,400                    4.95                 $1,801.80               $3,603.60
2002          $39,100             $3,500           $35,600                    4.70                 $1,673.20               $3,346.40
2001          $38,300             $3,500           $34,800                    4.30                 $1,496.40               $2,992.80
2000          $37,600             $3,500           $34,100                    3.90                 $1,329.90               $2,373.00
1999          $37,400             $3,500           $33,900                    3.50                 $1,186.50               $2,373.00
1998          $36,900             $3,500           $33,400                    3.20                 $1,068.80               $2,137.60
1997          $35,800             $3,500           $32,300                   2.925*                 $944.78                $1,889.55


                                                                      16
Basic exemption chart
Employee's CPP basic exemption for various 2012 pay periods.

                                                                                           Basic
                                                 Pay period
                                                                                         exemption
                              Annually (1)                                               $3,500.00
                              Semi-annually (2)                                          $1,750.00
                              Quarterly (4)                                                $875.00
                              Monthly (12)                                                 $291.66
                              Semi-monthly (24)                                            $145.83
                              Bi-weekly (26)                                               $134.61
                              Bi-weekly (27)                                               $129.62
                              Weekly (52)                                                   $67.30
                              Weekly (53)                                                   $66.03
                              22 pay periods                                               $159.09
                              13 pay periods                                               $269.23
                              10 pay periods                                               $350.00
                              Daily (240)                                                   $14.58
                              Hourly (2000)                                                     $1.75

* For 1997, the CPP rate was adjusted to 3.0% with a payment on filing the T1 tax return max.


                                                                   17
EI premium rate and maximum
Each year, CRA provide the maximum insurable earnings and rate for
employer to calculate the amount of EI to deduct from your employees.
Employer has to deduct EI premiums from insurable earnings their pay to their
employees. In addition, employer must pay 1.4 times the amount of the
employee's premiums. Employer may qualify to reduce your 1.4 times employer
contribution if employer provides their employees a short-term disability plan.

Example
              EI premiums you deducted from your employees for the month   $195.50

              Your share of EI ($195.50 × 1.4 )                            $273.70

              Total amount you remit for EI premiums                       $469.20

You stop deducting EI premiums when you reach the employee's maximum
insurable earnings ($45,900 for 2012) or the maximum employee premium
for the year ($839.97 for 2012). The maximum for Quebec is $647.73 for
2012.

Note
The annual maximum insurable earnings ($45,900 for 2012) applies to each job
the employee holds with different employers (different business numbers). If
an employee leaves one employer during the year to start work with another
employer, the new employer also has to deduct EI premiums without taking into
account what was paid by the previous employer. This is the case even if the
employee has paid the maximum premium amount during the previous
employment.
CRA will credit or refund any overpayments to employees when they file their
income tax and benefit return. There is no provision that provides a credit or
refund to the employer in such circumstances.

Note
Different EI rates apply for employees working in Quebec as a result of the
establishment of the Quebec Parental Insurance Plan (QPIP).
Old Age Security (OAS) Payment Rates- January - March 2011
The following chart shows the maximum and average monthly rates for Old
Age Security (OAS), Guaranteed Income Supplement and the Allowance, as
well as the maximum annual income to be eligible for these benefits.
For detailed monthly rates, please refer to the Tables of Rates for Old Age
Security, Guaranteed Income Supplement and the Allowance.
Old Age Security benefit rates are reviewed in January, April, July and October
to reflect increases in the cost of living as measured by the Consumer Price
Index.

                                                  18
The term "spouse" includes a common-law partner.
Pensioners are not eligible for benefits if their income, or the combined income
of them and their spouse, is more than the maximum income shown on the
chart.

Canada Pension Plan - Payment Rates Jan - Dec 2012
Canada Pension Plan (CPP) rates are adjusted every January if there are
increases in the cost of living as measured by the Consumer Price Index (CPI).
The table below lists the maximum and average monthly rates for CPP benefits,
except for the death benefit which is a one-time payment.

                                  Canada Pension Plan Payment Rates
                                                      Average benefit Maximum amount
                         Type of benefit
                                                      (October 2011)       (2012)
            Retirement (at age 65)                    $512.64         $986.67
            Disability                                $820.96         $1,185.50
            Survivor – younger than 65                $383.56         $543.82
            Survivor – 65 and older                   $301.15         $592.00
            Children of disabled contributors         $218.50         $224.62
            Children of deceased contributors         $218.50         $224.62
            Death (maximum one-time payment)          $2,276.62       $2,500.00
            Combined benefits
            Survivor/retirement (retirement at 65) $701.46            $986.67
            Survivor/disability                       $949.22         $1,185.50


Meal and vehicle rates used to calculate travel expenses for
2012
Meal expenses
If you choose the detailed method to calculate meal expenses, you must keep
your receipts and claim the actual amount that you spent.
If you choose the simplified method, you may claim a flat rate of $17/meal, to
a maximum of $51/day (Canadian or US funds) per person. Although you do
not need to keep detailed receipts for actual expenses if you choose to use this
method, we may still ask you to provide some documentation to support your
claim.


                                                 19
Meal expenses Prior table of simplified method 2001-2012
                   Year     $ Meal per person    $ Maximum Per day
                   2012            17                   51
                   2011             17                    51
                   2010             17                    51
                   2009             17                    51
                   2008             17                    51
                   2007             11                    33
                   2006             15                    45
                   2005             15                    45
                   2004             15                    45
                   2003             15                    45
                   2002             11                    33
                   2001             17                    51


Vehicle expenses
If you choose the detailed method to calculate vehicle expenses, you must keep
all receipts and records for the vehicle expenses you incurred for moving
expenses or for northern residents deductions during the tax year; or during the
12-month period you choose for medical expenses.
Vehicle expenses include:
• Operating expenses such as fuel, oil, tires, licence fees, insurance,
    maintenance, and repairs.
• Ownership expenses such as depreciation, provincial tax, and finance
    charges.
You also have to keep track of the number of kilometers you drove in that time
period, as well as the number of kilometers you drove specifically for the
purpose of moving or medical expenses, or for the northern residents
deductions. Your claim for vehicle expenses is the percentage of your total
vehicle expenses that relate to the kilometers driven for moving or medical
expenses, or for northern residents deductions.
For example, if you drove 10,000 km during the year, and half of that was
related to your move, you can claim half of the total vehicle expenses on your
tax return.
Although you do not need to keep detailed receipts for actual expenses if you
choose to use the simplified method, we may still ask you to provide some
documentation to support your claim. You must keep track of the number of
kilometers driven during the tax year for your trips relating to northern residents
deductions and moving expenses, or the 12-month period you choose for
medical expenses. To determine the amount you can claim for vehicle expenses,
multiply the number of kilometers by the cents/km rate from the chart below for
the province or territory in which the travel begins.

                                          20
Motor vehicle leasing costs - employees
You can deduct amounts you paid to lease a motor vehicle you used to earn
employment income. Include the leasing costs you paid when you calculate
your allowable motor vehicle expenses. If you use a passenger vehicle to earn
employment income, there is a limit on the amount of the leasing costs you can
deduct. If you leased a passenger vehicle before January 1, 2001, you will need
to refer to the applicable chart in the 2008 version of the Guide T4044,
Employment expenses to assist you in calculating the eligible leasing costs. You
can use the Chart, Eligible leasing costs for passenger vehicles leased after
December 31, 2000 to calculate your eligible leasing costs for a passenger
vehicle leased after 2000 as follow:

Chart - Eligible leasing costs for passenger vehicles leased after December
31, 2000
    1. Enter the total lease charges paid for the vehicle in
       2011                                                                   $________
    2. Enter the total lease payments deducted for the vehicle
       before 2011                                                            $________
    3. Enter the total number of days the vehicle was leased in
       2011 and previous years                                                $________
    4. Enter the manufacturer's list price                                    $________
    5. $35,294 + GST and PST, or HST on $35,294                               $________
    6. Enter the amount from line 4 or line 5, whichever is       $______ ×
       more                                                       85%         $________
    7. ($800 + GST and PST, or HST on            $______ ÷ 30     $______ −
       $800) × line 3 =                          =                line 2      $________
    8. ($30,000 + GST and PST, or HST                             $______ ÷
       on $30,000) × line 1 =                                     line 6      $________
Your eligible leasing cost is the lower of the amounts on line 7 and line 8.


                                                 21
Comparison table of Vehicle expenses 2001-2012
    Province or territory        2012   2011   2010   2009    2008   2007   2006   2005   2004   2003   2002   2001
    Alberta                       53     53    51.5   51.5     53     48    47.5   45.5   43.5   41.5   39.5   39.5
    British Columbia              52     52     52     52      54     48    47.5   45.5    43    41.5    42     42
    Manitoba                      49     49    47.5    49     50.5   46.5   45.5    44    40.5   40.5   41.5    41
    New Brunswick                 52     52    49.5    50      52     47    47.5   45.5   43.5    44    41.5    42
    Newfoundland and Labrador     55     55     53    53.5    55.5   50.5   50.5    49    47.5    45    43.5   43.5
    Northwest Territories        61.5   61.5    58     58      64    56.5   54.5   52.5    49    48.5   48.5    47
    Nova Scotia                   53     53     51     50     52.5    48    47.5    46     44     44    41.5    42
    Nunavut                      61.5   61.5    58     58      64    56.5   54.5   52.5    49    48.5   48.5    47
    Ontario                       57     57     55     54     55.5   49.5   48.5    47    45.5   43.5   43.5   42.5
    Prince Edward Island          52     52     50     50     52.5    47    47.5   45.5    44     42    40.5    41
    Quebec                        59     59    56.5    57      58    52.5   51.5    50    47.5    46     45     46
    Saskatchewan                 47.5   47.5    46    47.5    49.5    46    44.5    43     40     39     40    38.5
    Yukon                        63.5   63.5   60.5    61      66     58     57     55    50.5   48.5    48    48.5


Example
In 2011, you provided your employee with an automobile. She drove 30,000
kilometres during the year, with 10,000 kilometres for personal use.
You paid $3,000 in costs associated with maintenance, licenses, and insurance.
Calculate the part of the operating expenses that relates to her personal use of
the automobile as follows:
10,000 km ÷ 30,000 km × $3,000 = $1,000
If she reimbursed you for the total amount of $1,000 in the year or no later
than 45 days after the end of the year, you do not have to calculate an operating
expense benefit for her.
However, if she reimbursed you for only $800 of the expenses you paid in the
year or no later than 45 days after the end of the year, the operating expense
benefit is $1,600, calculated as follows:
10,000 km × 24¢ = $2,400
$2,400 - $800 = $1,600

Flat-rate allowance
If you pay your employee an allowance based on a flat rate that is not related to
the number of kilometers driven, it is a taxable benefit and has to be included in
the employee's income.

Combination of flat-rate and reasonable per-kilometre allowances
If you pay your employee an allowance that is a combination of flat-rate and
reasonable per-kilometre allowances that cover the same use for the vehicle, the
total combined allowance is a taxable benefit and has to be included in the
employee's income.

Example 1
You pay an allowance to your employee as follows:


                                                             22
•   a flat per-diem rate to offset the employee's fixed expenses for each day the
    vehicle is required; and
•   A reasonable per-kilometer rate for each kilometre driven to offset the operating
    expenses.
    The flat per-diem rate compensates the employee for some of the “same use” on
    which the reasonable per-kilometre allowance is based, that is, the fixed
    expenses incurred by the employee to operate the vehicle.
    The combined amount is considered one allowance and therefore taxable, since
    it is not based solely on the number of kilometres the vehicle is used for
    employment purposes.

    Example 2
    You pay an allowance to your employee as follows:
•   a flat-rate per month for travel inside the employment district; and
•   a reasonable per-kilometre rate for employment-related travel outside the
    employment district.
    Since the flat-rate allowance does not cover any of the same use of the vehicle
    on which the reasonable per-kilometre allowance is based, the allowances are
    considered separately.
    The reasonable per-kilometer allowance paid for travel outside the district is
    not included in income. The amount based on a flat-rate paid for travel inside
    the district is taxable, since it is not based solely on the number of kilometres
    for which the vehicle is used in connection with the employment.
    Only the total of the monthly flat-rate allowance has to be reported in box 14,
    “Employment income”, and in the “Other information” area under code 40 at
    the bottom of the employee's T4 slip.

    Example of calculating the taxable benefit
    Farzaneh is your employee. He borrowed $150,000 from you at the beginning
    of the year. The prescribed rate of interest for the loan is 3% for the first quarter,
    4% for the second and third quarters, and 5% for the fourth quarter. Farzaneh
    paid you $2,000 interest on the loan no later than 30 days after the end of the
    year. During the year, a company related to you paid $1,000 interest on the loan
    for Farzaneh. Before the end of the same year, Farzaneh repaid the $1,000 to the
    company.


                                             23
Calculate the benefit to include in his income as follows:
1) Prescribed rate × loan amount for the year:
    3% × $150,000 × 1/4 = $1,125
    4% × $150,000 × 2/4 = $3,000
    5% × $150,000 × 1/4 = $1,875                                                              $6,000
Plus
2) Amount paid by a third party                                                                1,000
                                                                                              $7,000
Minus
3) Interest paid ($2,000 + $1,000) =                                         ($3,000)
4) Amount Joshua repaid                                                       (1,000)         (4,000)
Farzaneh's taxable benefit                                                                    $3,000


                   Prescribed Interest Rates for Leasing Rules
        Year         2002   2003   2004   2005   2006   2007   2008   2009   2010   2011   2012

        January     6.66    6.55   6.24   5.87   5.20   5.03   5.22   5.00   4.84   4.60   3.61

        February    6.75    6.37   6.14   5.86   5.04   5.11   5.18   4.45   5.08   4.51   3.42

        March       6.72    6.45   6.15   5.69   5.22   5.23   5.17   4.74   4.92   4.71

        April       6.68    6.39   5.98   5.71   5.17   5.10   5.14   4.70   4.98   4.69

        May         7.00    6.52   5.94   5.75   5.26   5.21   4.91   4.63   4.99   4.66

        June        6.89    6.34   6.23   5.55   5.59   5.21   5.02   4.72   4.99   4.67

        July        6.76    6.01   6.23   5.41   5.51   5.43   5.07   5.11   4.58   4.41

        August      6.73    5.98   6.30   5.27   5.69   5.59   5.07   4.96   4.59   4.47

        September 6.70      6.35   6.29   5.31   5.46   5.52   5.18   5.10   4.71   4.28

        October     6.55    6.40   6.14   5.11   5.22   5.44   5.02   4.96   4.39   4.00

        November    6.38    6.19   6.02   5.21   5.08   5.50   5.14   4.87   4.25   3.74

        December    6.61    6.33   5.96   5.38   5.25   5.39   5.31   4.98   4.38   3.91


                                                  24
Comparison Federal Personal Income Tax Rates
                                                 2011 Marginal Tax Rates                                                  2012 Marginal Tax Rates
                                                             Canadian Dividends                                                          Canadian Dividends
       2012 Taxable Income              Other Capital                                   2011 Taxable Income       Other      Capital
                                       Income Gains         Eligible Non-Eligible                                Income      Gains      Eligible Non-Eligible
                                                           Dividends Dividends                                                         Dividends Dividends

first $42,707                           15.00%     7.50%     -2.02%          2.08% first $41,544                    15.00%     7.50%        -3.03%      2.08%
over $42,707 up to $85,414              22.00%    11.00%      7.85%         10.83% over $41,544 up to $83,088       22.00%    11.00%        9.63%       10.83%
over $85,414 up to $132,406             26.00%    13.00%     13.49%         15.83% over $83,088 up to $128,800      26.00%    13.00%       15.15%       15.83%
over $132,406                           29.00%    14.50%     17.72%         19.58% over $128,800                    29.00%    14.50%       19.29%       19.58%
Marginal tax rate for dividends is a % of actual dividends received (not grossed-up amount).
Federal Basic Personal Amount
                 2012                                   Tax Rate                                 2011                              Tax Rate
                $10,822                                    15.00%                               $10,527                             15.00%


                          Comparison Federal Personal Income Tax Rates
                                                    2010 Marginal Tax Rates                                           2009 Marginal Tax Rates


                                                               Canadian Dividends                                                 Canadian Dividends
                2010 Taxable Income                                                      2009 Taxable Income
                                             Other Capital                                                        Other Capital
                                            Income Gains                                                         Income Gains
                                                                          Small                                                               Small
                                                               Eligible                                                            Eligible
                                                                        Business                                                            Business
                                                              Dividends                                                           Dividends
                                                                        Dividends                                                           Dividends


          first $40,970                     15.00% 7.50%        -4.28%      2.08%              first $40,726     15.00% 7.50%      -5.75%      2.08%


          over $40,970 up to $81,941        22.00% 11.00%       5.80%      10.83%      over $40,726 up to $81,452 22.00% 11.00%    4.40%       10.83%


          over $81,941 up to $127,021       26.00% 13.00%       11.56%     15.83%     over $81,452 up to $126,264 26.00% 13.00% 10.20%         15.83%


          over $127,021                     29.00% 14.50%       15.88%     19.58%              over $126,264     29.00% 14.50% 14.55%          19.58%


          Marginal tax rate for dividends is a % of actual dividends received (not grossed-up amount).

                                   Federal Basic Personal Amount

                          2010                               Tax Rate                              2009                       Tax Rate

                        $10,382                              15.00%                              $10,320                       15.00%

                Source: www. taxtip.ca


                                                                                25 
   
Canada Pension Plan (CPP) and Québec Pension Plan (QPP) contribution rates
                      Year                        2012              2011          2010              2009          2008        2007         2006            2005             2004


    maximum pensionable earnings                   $50,100           $48,300       $47,200          $46,300      $44,900     $43,700      $42,100          $41,100         $40,500


    basic exemption                                  $3,500           $3,500          $3,500         $3,500       $3,500      $3,500       $3,500           $3,500          $3,500


    rate                                              %4.95            4.95%          4.95%          4.95%         4.95%       4.95%        4.95%            4.95%           4.95%


    employee/employer maximum                    $2,306.70          $2,217.60     $2,163.15     $2,118.60       $2,049.30   $1,989.90    $1,910.70      $1,861.20         $1,831.50


    self-employed maximum                        $4,613.40          $4,435.20     $4,326.30     $4,237.20       $4,098.60   $3,979.80    $3,821.40      $3,722.40         $3,663.00


Source: www. taxtip.ca

Canada Revenue Agency (CRA) information:
      T4032 Payroll Deduction Tables - for calculating payroll deductions
      CPP contribution rates, maximums and exemptions for rates from earlier years.
      Online payroll calculator, which employers can use for calculating payroll
      deductions, and employees can use to check their payroll deductions.
Revenue Québec information:
               Source deductions of Québec income tax - for calculating payroll deductions
               TP-1015.G-V - Guide for Employers: Source Deductions and Contributions


                                  Federal & Provincial/Territorial enhanced dividend tax credit rates
                                            2007 to 2012 Enhanced Dividend Tax Credit Rates as a % of Grossed-up Taxable Dividends

Year       Gross up     Federal     AB          BC            MB        NB       NL            NS          NT        NU       ON         PE           QC             SK            YT


2012           38%      15.02%      10%        9.76%          11%     10.65%    8.65%       7.85%       10.20%      5.51%    6.4%       9.32%        11.9%         11%         9.76%


2011           41%      16.44%      10%        10.31%         11%     11.24%    9.14%       8.29%       10.78%      5.82%    6.4%       9.84%        11.9%         11%         10.31%

2010           44%      17.97%      10%        10.83%         11%     11.82%    9.60%       8.71%       11.32%      6.11%    6.4%       10.34%       11.9%         11%         10.83%

2009           45%      18.97%      10%         11%           11%       12%     9.75%       8.85%       11.5%       6.21%    7.4%       10.5%        11.9%         11%          11%

2008           45%      18.97%      9.0%        12%           11%       12%     6.65%       8.85%       11.5%       6.20%    7.0%       10.5%        11.9%         11%          11%

2007           45%      18.97%      8.0%        12%           11%       12%     6.65%       8.85%       11.5%       6.20%    6.7%       10.5%        11.9%         11%          11%

2007 to 2012 Enhanced Dividend Tax Credit Rates as a % of Actual Dividends

Year       Gross up     Federal     AB          BC            MB        NB       NL            NS          NT        NU       ON         PE           QC             SK            YT

2012           38%      20.73%     13.8%       13.47%     15.18%      14.69%    11.94%     10.84%       14.08%      7.60%    8.83%      12.86%       16.42%       15.18%       13.47%

2011           41%      23.17%     14.1%       14.53%     15.51%      15.85%    12.88%     11.69%       15.19%      8.20%    9.02%      13.87%       16.78%       15.51%       14.53%

2010           44%      25.88%     14.4%       15.60%     15.84%      17.01%    13.82%     12.55%       16.30%      8.80%    9.22%      14.89%       17.14%       15.84%       15.60%

2009           45%      27.50%     14.5%       15.95%     15.95%      17.40%    14.14%     12.83%       16.68%      9.00%   10.73%      15.23%       17.26%       15.95%       15.95%

2008           45%      27.50%     13.05%      17.40%     15.95%      17.40%    9.64%      12.83%       16.68%      8.99%   10.15%      15.23%       17.26%       15.95%       15.95%


2007           45%      27.50%     11.60%      17.40%     15.95%      17.40%    9.64%      12.83%       16.68%      8.99%    9.72%      15.23%       17.26%       15.95%       15.95%


Rates are as known at December 22, 2009. (Source: taxtip.ca)


                                                                                      26 
 
Rates for Money Purchase limits, RRSP limits, YMPE, DPSP limits
and Defined Benefits limits
Outlined in the following tables are data on Rates for Money Purchase limits,
RRSP limits, YMPE, DPSP limits and Defined Benefits limits used to calculate
PA, PSPA and PAR.
Rates for Money Purchase limits, RRSP limits, YMPE, DPSP limits
and Defined Benefits limits
Outlined in the following tables are data on Rates for Money Purchase limits,
RRSP limits, YMPE, DPSP limits and Defined Benefits limits used to calculate
PA, PSPA and PAR.
             Year   MP limit   RRSP $ limit         YMPE         DPSP limit
                                                               (1/2 MP limit)

             1990    $11,500     (Old limits)        $28,900               $5,750
             1991    $12,500        $11,500          $30,500               $6,250
             1992    $12,500        $12,500          $32,200               $6,250
             1993    $13,500        $12,500          $33,400               $6,750
             1994    $14,500        $13,500          $34,400               $7,250
             1995    $15,500        $14,500          $34,900               $7,750
             1996    $13,500        $13,500          $35,400               $6,750
             1997    $13,500        $13,500          $35,800               $6,750
             1998    $13,500        $13,500          $36,900               $6,750
             1999    $13,500        $13,500          $37,400               $6,750
             2000    $13,500        $13,500          $37,600               $6,750
             2001    $13,500        $13,500          $38,300               $6,750
             2002    $13,500        $13,500          $39,100               $6,750
             2003    $15,500        $14,500          $39,900               $7,750
             2004    $16,500        $15,500          $40,500               $8,250
             2005    $18,000        $16,500          $41,100               $9,000
             2006    $19,000        $18,000          $42,100               $9,500
             2007    $20,000        $19,000          $43,700              $10,000
             2008    $21,000        $20,000          $44,900              $10,500
             2009    $22,000        $21,000          $46,300              $11,000
             2010    $22,450        $22,000          $47,200              $11,225
             2011    $22,970        $22,450          $48,300              $11,485
             2012    $23,820        $22,970          $50,100              $11,910
             2013                   $23,820


                                              27 
 
Please note that the MP limit and DPSP limit above for PA purposes are also
restricted to 18% of compensation.
                                  Defined Benefit limits
                   1990 to 2003                    $1,722.22
                      2004                         $1,833.33
                      2005                         $2,000.00
                      2006                         $2,111.11
                      2007                         $2,222.22
                      2008                         $2,333.33
                      2009                         $2,444.44
                      2010                         $2,494.44
                      2011                         $2,552.22
                      2012                         $2,646.67
                      2013                1/9 the money purchase limit


What are the income tax rates in Canada for 2012?
These are the rates that an individual will use when completing their 2012
income tax and benefit return. The information may change during the year to
reflect updates to the law.
    • Federal tax rates for 2012
    • Provincial/territorial tax rates for 2012


Federal tax rates for 2012
    • 15% on the first $42,707 of taxable income, +
   • 22% on the next $42,707 of taxable income (on the portion of taxable
      income over $42,707 up to $85,414), +
   • 26% on the next $46,992 of taxable income (on the portion of taxable
      income over $85,414 up to $132,406), +
   • 29% of taxable income over $132,406.
The chart below reproduces the first calculation that has to be made on page 2
of Schedule 1 of the tax package to calculate net federal tax. Page 1 is used to
calculate federal non-refundable tax credits.


                                           28 
 
Federal tax on taxable income manual calculation chart

                     Use this column   Use this column if your   Use this column if your   Use this column if
                     if your taxable   taxable income is more    taxable income is more    your taxable
                     income is         than $42,707, but not     than $85,414, but not     income is more
                     $42,707 or less   more than $85,414         more than $132,406        than $132,406

Enter your                                                                                                      1
taxable income
from line 260 of
your return

Base amount          −0                − 42,707                  − 85,414                  − 132,406            2

Line 1 minus line    =                 =                         =                         =                    3
2 (this amount
cannot be
negative)

Federal tax rate     × 15%             × 22%                     × 26%                     × 29%                4

Multiply the         =                 =                         =                         =                    5
amount on line 3
by the tax rate on
line 4

Tax on the           +0                + 6,406                   + 15,802                  + 28,020             6
amount from line
2

Add lines 5 and 6    =                 =                         =                         =                    7


Provincial/territorial tax rates for 2012
Under the current tax on income method, tax for all provinces (except Quebec)
and territories is calculated the same way as federal tax.
Form 428 is used to calculate this provincial or territorial tax. Provincial or
territorial specific non-refundable tax credits are also calculated on Form 428.

For complete details, see the provincial or territorial information and forms in
your 2012 tax package.


                                                       29 
 
Provincial/territorial tax rates (combined chart)
       Provinces/territories                           Rate(s)
    Newfoundland and             7.7% on the first $32,893 of taxable income, +
    Labrador                     12.5% on the next $32,892, +
                                 13.3% on the amount over $65,785
    Prince Edward Island         9.8% on the first $31,984 of taxable income, +
                                 13.8% on the next $31,985, +
                                 16.7% on the amount over $63,969
    Nova Scotia                  8.79% on the first $29,590 of taxable income, +
                                 14.95% on the next $29,590, +
                                 16.67% on the next $33,820, +
                                 17.5% on the next $57,000, +
                                 21% on the amount over $150,000
    New Brunswick                9.1% on the first $38,190 of taxable income, +
                                 12.1% on the next $38,190, +
                                 12.4% on the next $47,798, +
                                 14.3% on the amount over $124,178
    Quebec                       See Income tax rates (Revenu Québec Web site).

    Ontario                      5.05% on the first $39,020 of taxable income, +
                                 9.15% on the next $39,023, +
                                 11.16% on the amount over $78,043

    Manitoba                     10.8% on the first $31,000 of taxable income, +
                                 12.75% on the next $36,000, +
                                 17.4% on the amount over $67,000
    Saskatchewan                 11% on the first $42,065 of taxable income, +
                                 13% on the next $78,120, +
                                 15% on the amount over $120,185
    Alberta                      10% of taxable income

    British Columbia             5.06% on the first $37,013 of taxable income, +
                                 7.7% on the next $37,015, +
                                 10.5% on the next $10,965, +
                                 12.29% on the next $18,212, +
                                 14.7% on the amount over $103,205

    Yukon                        7.04% on the first $42,707 of taxable income, +
                                 9.68% on the next $42,707, +
                                 11.44% on the next $46,992, +
                                 12.76% on the amount over$132,406
    Northwest Territories        5.9% on the first $38,679 of taxable income, +
                                 8.6% on the next $38,681, +
                                 12.2% on the next $48,411, +
                                 14.05% on the amount over $125,771

    Nunavut                      4% on the first $40,721 of taxable income, +
                                 7% on the next $40,721, +
                                 9% on the next $50,964, +
                                 11.5% on the amount over $132,406


                                           30 
 
British Columbia - Provincial corporation tax
Federal rates
The basic rate of Part I tax is 38% of your taxable income, 28% after federal tax
abatement.
For Canadian-controlled private corporations claiming the small business
deduction, the net tax rate is 11%.
For the other corporations, the net tax rate is decreased as follows:
• 19% effective January 1, 2009
• 18% effective January 1, 2010
• 16.5% effective January 1, 2011
• 15% effective January 1, 2012
Provincial or territorial rates
Generally, provinces and territories have two rates of income tax - a lower rate
and a higher rate.
Lower rate-The lower rate applies to the income eligible for the federal small
business deduction. One component of the small business deduction is the
business limit. Some provinces or territories choose to use the federal business
limit. Others establish their own business limit.
Higher rate-The higher rate applies to all other income.
Provincial and territorial tax rates (except Quebec and Alberta)
The following table shows the income tax rates for provinces and territories
(except Quebec and Alberta, which do not have corporation tax collection
agreements with the CRA).


                                       31 
 
These rates are in effect on January 1, 2011, and may change during 2011.
                   Province or territory         Lower rate Higher rate
               Newfoundland and Labrador            4%          14%
               Nova Scotia                         4.5%         16%
               Prince Edward Island                 1%          16%
               New Brunswick                        5%         11%*
               Ontario                             4.5%       12%**
               Manitoba                             nil         12%
               Saskatchewan                      4.5%***        12%
               British Columbia                    2.5%         10%
               Yukon                                4%          15%
               Northwest Territories                4%        11.5%
               Nunavut                              4%          12%
            * 10% effective July 1, 2011
            ** 11.5% effective July 1, 2011
            *** 2% effective July 1, 2011


Reporting the tax
You can use Schedule 427, British Columbia Corporation Tax Calculation, to
help you calculate your British Columbia tax before the application of credits.
You do not have to file it with the return. See the schedule for more details.

Generally, provinces and territories have two rates of income tax: the lower rate
and the higher rate.
The lower rate applies to either:
   •    The income eligible for the federal small business deduction; or
   •    The income based on limits established by the particular province or
       territory.
The higher rate applies to all other income
Corporation (Ronak) earned all of its income for 2010 from its permanent
establishment in Newfoundland and Labrador. Corporation (Ronak) claimed the
small business deduction when it calculated its federal tax payable. The income
from active business carried on in Canada was $78,000.
The Newfoundland and Labrador lower rate of tax is 4.5%. The higher rate of
tax is 12%.


                                           32 
 
Dual tax rates
Generally, provinces and territories have two rates of income tax: the lower rate
and the higher rate. The lower rate applies to the income eligible for the federal
small business deduction. One component of the small business deduction is the
business limit. Some provinces or territories choose to use the federal business
limit. Others establish their own business limit. The higher rate applies to all
other income.
Example: Corporation (Ronak) earned all of its income for 2010 from its
permanent establishment in Saskatchewan. Corporation X claimed the small
business deduction when it calculated its federal tax payable. The income from
active business carried on in Canada was $78,000. The Saskatchewan lower rate
of tax is 4.5%. The higher rate of tax is 12%. Corporation (Ronak) calculates its
Saskatchewan tax payable as follows:
    Taxable income                                                        $90,000
    Subtract amount taxed at lower rate:
    Least of lines 400, 405, 410, or 425 of the return, in the small
    business deduction calculation                                        $78,000
    Amount taxed at higher rate                                           $12,000
    Taxes payable at the lower rate:
    $78,000 × 4.5% =                                                      $ 3,510
    Taxes payable at the higher rate:
    $12,000 × 12% =                                                       $ 1,440
    Saskatchewan tax payable                                              $ 4,950

When you allocate taxable income to more than one province or territory, you
also have to allocate proportionally any income eligible for the federal small
business deduction.

Example 2- Corporation (Amir) has permanent establishments in both Nova
Scotia and the Yukon. Its tax year runs from September 1, 2009, to August 31,
2010. Corporation (Amir) claimed the small business deduction when it
calculated its federal tax payable. The lower rate of tax for Nova Scotia is 5%,
and the higher rate of tax is 16%. To calculate its Nova Scotia income tax,
Corporation (Amir) does the following calculations:


                                           33 
 
Taxable income allocated to Nova Scotia
(from Schedule 5)                                                                     $60,000
Taxable income allocated to the Yukon
(from Schedule 5)                                                                     $30,000
Total taxable income earned in Canada                                                 $90,000
Least of lines 400, 405, 410, or 425 of the return, in the federal small business
deduction calculation                                                                 $78,000
Income eligible for the federal small business deduction attributed to Nova Scotia:
($60,000 ÷ $90,000) × $78,000 =                                                       $52,000
Taxable income earned in Nova Scotia                                                  $60,000
Subtract: Income eligible for the federal small business deduction attributed to
Nova Scotia                                                                           $52,000
Amount taxed at higher rate                                                           $ 8,000
Taxes payable at higher rate:
$8,000 × 16% =                                                                        $ 1,280
Taxes payable at lower rate:
$52,000 × 5% =                                                                        $ 2,600
Nova Scotia tax payable                                                               $ 3,880

To calculate its Yukon income tax payable, Corporation (Amir) would repeat
the same steps, using the rates that apply. For a table that shows the income tax
rates as of January 1, 2011.

For a table that shows the income tax rates as of January 1, 2010, for the
provinces and territories that have corporate tax collection agreements with the
federal government.


              Tax Brackets              Rate (%)            Provincial Surtax
             Federal (note)       $10,382 to $40,970                 15.00
                                  $40,970 to $81,941                 22.00
                                  $81,941 to $127,021                26.00
                                  $127,021 and higher                29.00
             British Columbia     $11,000 to $35,859                  5.06
                                  $35,859 to $71,719                  7.70
                                  $71,719 to $82,342                 10.50
                                  $82,342 to $99,987                 12.29
                                  $99,987 and higher                 14.70


                                               34 
 
British Columbia (BC) combined federal & provincial tax rates / 2004-2010
                                                                                                                                                                                 Marginal Tax Rates
                                          Taxable Income                                                                                                                        Canadian Dividends
                                                                                                                    Capital Gains                                                                                                                             Other Income
                                                                                                                                                   Small Business Dividends                               Eligible Dividends

      2006             2007       2008             2009        2010          2011            2012       2004-                          2008-                               2010-                                                                     2004-                      2008-
                                                                                                                    2006        2007            2007     2008     2009               2007       2008        2009       2010       2011      2012              2006     2007
                                                                                                        2005                           2012                                2012                                                                      2005                       2010
    first         first          first        first           first        first        first
    $33,755       $34,397        $35,016      $35,716         $35,859      $36,146      $37,013         11.03%     10.65%   10.35%     10.03%   2.83%    2.03%    3.16%    4.16%    (14.89%)   (15.81%)    (14.36%)   (12.59%)   (9.42%)   (6.51%)   22.05%   21.30%   20.70%   20.06%

    over          over           over         over            over         over         over
    $33,755       $34,397        $35,016      $35,716         $35,859      $36,146      $37,013
    up to         up to          up to        up to           up to        up to        up to           12.58%     12.20%   11.83%     11.35%   6.52%    5.33%    6.46%    7.46%    (10.61%)   (11.99%)    (10.54%)   (8.79%)    (5.70%)   (2.87%)   25.15%   24.40%   23.65%   22.70%
    $36,378       $37,178        $37,885      $40,726         $40,970      $41,544      $42,707
    over          over           over         over            over         over         over
    $36,378       $37,178        $37,885      $40,726         $40,970      $41,544      $42,707
    up to         up to          up to        up to           up to        up to        up to           15.58%     15.58%   15.33%     14.85%   15.27%   14.08%   15.21%   16.21%   (0.46%)    (1.84%)     (0.38%)     1.29%     (4.17%)    6.79     31.15%   31.15%   30.65%   29.70%
    $67,511       $68,794        $70,033      $71,433         $71,719      $72,293      $74,028
    over          over           over         over            over         over         over
    $67,511       $68,794        $70,033      $71,433         $71,719      $72,293      $74,028
    up to         up to          up to        up to           up to        up to        up to           16.85%     16.85%   16.55%     16.25%   18.33%   17.58%   18.71%   19.71%    3.10%      2.23%       3.68%      5.32%     8.12%     10.65%    33.70%   33.70%   33.10%   32.50%
    $72,756       $74,357        $75,769      $81,452         $81,941      $83,001      $84,993
    over          over           over         over            over         over         over
    $72,756       $74,357        $75,769      $81,452         $81,941      $83,001      $84,993
                                                                                                        18.85%     18.85%   18.55%     18.25%   23.33%   22.58%   23.71%   24.71%    8.90%      8.03%       9.48%     11.08%     10.64%    13.12%    37.70%   37.70%   37.10%   36.50%
    up to         up to          up to        up to           up to        up to        up to
    $77,511       $78,984        $80,406      $82,014         $82,342      $83,088      $85,414
    over          over           over         over            over         over         over
    $77,511       $78,984        $80,406      $82,014         $82,342      $83,088      $85,414
    up to         up to          up to        up to           up to        up to        up to           19.85%     19.85%   19.50%     19.15%   25.71%   24.82%   25.95%   26.95%   11.65%     10.62%      12.07%     13.66%     16.28%    18.64%    39.70%   39.70%   39.00%   38.29%
    $94,121       $95,909        $97,636      $99,588         $99,987      $100,787     $103,205
    over          over           over         over            over         over         over
    $94,121       $95,909        $97,636      $99,588         $99,987      $100,787     $103,205
    up to         up to          up to        up to           up to        up to        up to           20.35%     20.35%   20.35%     20.35%   27.83%   27.83%   28.96%   29.96%   14.11%     14.11%      15.56%     17.13%     19.68%    21.97%    40.70%   40.70%   40.70%   40.70%
    $118,285      $120,887       $123,184     $126,264        $127,021     $128,800     $132,406
    over          over           over         over            over         over         over
    $118,285      $120,887       $123,184     $126,264        $127,021     $128,800     $132,406        21.85%     21.85%   21.85%     21.85%   31.58%   31.58%   32.71%   33.71%   18.46%     18.46%      19.91%     21.45%     23.91%    26.11%    43.70%   43.70%   43.70%   43.70%


    Marginal tax rate for dividends is a % of actual dividends received (not
    grossed-up amount).
                                  BC Basic Personal Amount                                                 Tax Rate
    2004      2005       2006     2007      2008     2009      2010       2011       2012     2004-2006     2007      2008-2012

    $8,523    $8,676    $8,858   $9,027    $9,189    $9,373   $11,000    $11,088   $11,354      6.05%      5.70%        5.06%

Source: Dayarayan centre of tax research


                                                                                                                                                         35 
 
Ontario (ON) combined federal & provincial tax rates including surtaxes / 2004-2010
                                                                                                                                                                                                     Marginal Tax Rates
                                                         Taxable Income                                                                                                                              Canadian Dividends

                                                                                                                                        Capital Gains           Small Business Dividends                          Eligible Dividends                          Other Income
         2006             2007            2008            2009                 2010                2011                  2012
                                                                                                                                                                       2004-2009           2007         2008       2009        2010     2011       2012
                                                                                                                                           2006      10.65%            2006        3.55%                                                                       2006     21.30%
    first $34,758     first $35,488   first $36,020   first $36,848     first $37,106        first $37,774        first $39,020                                                            (6.69%)      (7.13%)   (7.71%)     (6.23%)   (3.93%)   (1.089%)
                                                                                                                                         2007-09     10.53%             2007       3.23%                                                                     2007-09    21.05%
                                                                                                                                       2010-2012     10.03%          2008-09       3.88%                                                                        2010    20.05%
    over $34,758 up   over $35,488    over $36,020    over $36,848      over $37,106 up to   over $37,774 up to   over $39,020 up to     2004-05     12.58%          2004-05       8.36%                                                                     2004-05    25.15%
    to $36,378        up to $37,178   up to $37,885   up to $40,726     $40,970              $41,543              $42,707                   2006     12.20%             2006       7.42%   (2.2%)       (2.63%)   (3.21%)     (0.32%)   1.85%      3.77%        2006    24.40%
                                                                                                                                         2007-12     12.08%          2007-09       7.11%                                                                     2007-10    24.15%
    over $36,378 up   over $37,178    over $37,885    over $40,726      over $40,970 up to   over $41,543 up to   over $42,707 up to
    to $61,206        up to $62,485   up to $63,428   up to $64,882     $65,345              $66,514              $68,719
                                                                                                                                            15.58%                       15.86%            7.95%        7.52%      6.94%       9.76%    11.72%    13.43%           31.15%


    over $61,206 up   over $62,485    over $63,428    over $64,882      over $65,345 up to   over $66,514 up to   over $68,719up to
    to $69,517        up to $70,976   up to $72,041   up to $73,698     $74,214              $75,550              $78,043
                                                                                                                                            16.49%                       16.86%            8.66%        8.14%      7.44%      10.55%    12.5%     14.19%           32.98%


    over $69,517 up   over $70,976    over $72,041    over $73,698      over $74,214 up to   over $75,550 up to   over $78,043 up to
    to $72,102        up to $73,625   up to $74,720   up to $76,440     $76,986              $78,361              $80,963
                                                                                                                                            17.70%                       19.88%            12.16%       11.64%     10.94%     14.02%    15.90%    17.52%           35.39%


    over $72,102 up   over $73,625    over $74,720    over $76,440      over $76,986 up to   over $78,361 up to   over $80,963 up to
    to $72,756        up to $74,357   up to $75,769   up to $81,452     $81,941              $83,880              $85,414
                                                                                                                                            19.70%                       22.59%            14.49%       13.81%     12.91%     16.49%    18.32%    19.88%           39.41%


    over $72,756 up   over $74,357    over $75,769    over $81,452      over $81,941 up to   over $83,880 up to   over $85,414 up to
    to $118,285       up to           up to           up to             $127,021             $128,800             $132,406
                                                                                                                                            21.70%                       27.59%            20.29%       19.61%     18.71%     22.25%    23.96%    25.40%           43.41%
                      $120,887        $123,184        $126,264

    over $118,285     over $120,887   over $123,184   over $126,264     over $127,021        over $128,800        over $132,406
                                                                                                                                            23.20%                       31.34%            24.64%       23.96%     23.06%     26.57%    28.19%    29.54%           46.41%


Marginal tax rate for dividends is a % of actual dividends received (not grossed-up amount).
                                ON Basic Personal Amount                                          Tax Rate
 2004      2005       2006        2007     2008      2009      2010       2011     2012     2004-2009   2010-12
$8,044    $8,196      $8,377     $8,553 $8,681 $8,881         $8,943     $9,104   $9,405      6.05%      5.05%
 Source: Dayarayan centre of tax research


                                                                                                                                                          36 
 
Federal Income Tax Rates for Income Earned by a Canadian-Controlled Private Corporation (CCPC) 2009-2012
                                                                                  Active Business Income between $400,000
                                       Small Business Income up to $400,000                                                        General Active Business Income                    Investment Income
              Description                                                                       and $500,000
                                      2009       2010       2011       2012       2009       2010       2011        2012      2009        2010       2011       2012        2009      2010      2011       2012

 General corporate rate                  38.0      38.0       38.0       38.0       38.0       38.0          38.0      38.0     38.0        38.0       38.0         38.0      38.0      38.0      38.0       38.0

 Federal abatement                     (10.0)     (10.0)     (10.0)     (10.0)     (10.0)     (10.0)     (10.0)     (10.0)    (10.0)       (10.0)     (10.0)    (10.0)      (10.0)     (10.0)    (10.0)     (10.0)

                                         28.0      28.0       28.0       28.0       28.0       28.0          28.0      28.0     28.0        28.0       28.0         28.0      28.0      28.0      28.0       28.0

 Small business deduction              (17.0)     (17.0)     (17.0)     (17.0)     (17.0)     (17.0)     (17.0)     (17.0)         0.0       0.0        0.0          0.0       0.0       0.0       0.0        0.0

 Rate reduction                           0.0       0.0        0.0        0.0        0.0        0.0           0.0       0.0    (1.3)       (10.0)     (11.5)        (1.3)      0.0       0.0       0.0        0.0

 Refundable tax                           0.0       0.0        0.0        0.0        0.0        0.0           0.0       0.0        0.0       0.0        0.0          0.0       6.7       6.7       6.7        6.7

                                         11.0      11.0       11.0       11.0       11.0       11.0          11.0      11.0     28.0        28.0       28.0         15.0      34.7      34.7      34.7       34.7


                     Comparison of Canada Corporate income tax rates- Federal and BC –(2003-2012)
                                                    2003                         2004     2005                 2006        2007             2008               2009         2010         2011             2012
                             General/M&P/Investment 24.12                        22.12       22.12             22.12       22.12                  19.50        19.00         18.00        16.50             15.00
Federal(1)                   Small business         13.12                        13.12       13.12             13.12       13.12                  11.00        11.00         11.00        11.00             11.00
                             Investment - CCPC      35.79                        35.79       35.79             35.79       35.79                  34.67        34.67         34.67        34.67             34.67
                             General/M&P/Investment 13.50                        13.50 13.50/12.00             12.00       12.00            12.00/11.00        11.00         10.50        10.00             10.00
British Columbia(2)
                             Small business          4.50                         4.50        4.50              4.50        4.50         4.50/3.50/2.50         2.50          2.50         2.50              2.50

(1) Federal: The income limit for the purposes of the small business deduction (SBD limit) has been $300,000 since 2005. The May 2, 2006 federal budget provided for a rise in the SBD limit to
$400,000 effective January 1, 2007. The January 27, 2009 federal budget provides for an increase in the SBD limit to $500,000, effective January 1, 2009. The business limit must be allocated
between associated corporations. The SBD is reduced progressively on a straight-line basis for CCPCs when their taxable capital used in Canada varies between $10 million and $15 million.

(2) British Columbia: SBD limit: increased to $400,000 for taxation years ending after December 31, 2004. As announced in the February 19, 2008 budget, the General/M&P/Investment rate
was reduced to 11% effective July 1, 2008, to 10.5% effective January 1, 2010 and to 10% effective January 1, 2011. In addition, the rate for small businesses was reduced to 3.5% effective July
1, 2008, to 3% effective January 1, 2010 and to 2.5% effective January 1, 2011. On October 23, 2008, the government brought down its Economic Update which proposed a further decrease in
the rate for small businesses, from 3.5% to 2.5% effective December 1, 2008. The February 17, 2009 budget confirmed the previously announced rate reductions. In a news release dated April 7,
2009, the B. C. government announced that the SBD limit would be increased from $400,000 to $500,000 on January 1, 2010.


                                                                                                       37 
 
Comparison of Corporate Tax Rates 2003-2012
                                             Federal                       British Columbia          Top marginal rate
          year                                           Investments                               Capital               Other Income
                        General      SBD       M&P                       General/M&P       SBD               Dividends
                                                           (CCPC)                                   Gain
          2003           24.12       13.12     22.12        35.79            13.50         4.50     21.85      31.58        43.70
          2004           22.12       13.12     22.12        35.79            13.50         4.50     21.85      31.58        43.70
          2005           22.12       13.12     22.12        35.79            13.50         4.50     21.85      31.58        43.70
          2006           22.12       13.12     22.12        35.79            12.00         4.50     21.85         -         43.70
          2007           22.12       13.12     22.12        35.79            12.00         4.50     18.47      31.58        43.70
          2008           21.00       11.50     19.50        34.67            11.00         4.50     21.85      31.58        43.70
          2009           19.50       11.00     19.00        34.67            12.00         3.50     21.85      32.71        43.70
          2010           18.00       11.00     18.00        34.67            10.50         2.50
          2011           16.50       11.00     16.50        34.67            10.00         2.50
          2012           15.00       11.00      15          34.67            10.00         2.50

    Federal SBD limite 2005($&300,000),2006($400,000) and 2009 ( $500,000)
    BC –SBD Limite 2005 ($400,000) and 2009 and after ( $500,000)
    Deferred Income Plans - Maximum Contributions
        Year           RRSP(1)                                                RPP(2)
        1995           $14,500                                               $15,500
     1996-2002         $13,500                                               $13,500
        2003           $14,500                                               $15,500
        2004           $15,500                                               $16,500
        2005           $16,500                                               $18,000
        2006           $18,000                                               $19,000
        2007           $19,000                                               $20,000
        2008           $20,000                                               $21,000
        2009           $21,000                                               $22,000
        2010           $22,000                                               $22,450
        2011           $22,450                                               $22,970
        2012           $22,970                                               indexed
    (1) RRSP: Registered Retirement Savings Plan
    (2) RPP: Registered Pension Plan


                                                                               38 
 
Table of Canadian Federal Tax Rates for the years 2003- 2012
             Portion                   2003        2004            2005          2006             2007        2008           2009         2010           2011        2012
 1st portion of taxable income       $32,183     $35,000         $35,595       $36,378          $37,178     $37,885        $40,726      $40,970        $41,544     $42,707
 Applicable Rate                     16.00%       16.00%          15.00%        15.25%           15.00%      15.00%         15.00%       15.00%         15.00%      15.00%
 Next portion of taxable income      $32,185     $35,000         $35,595       $36,378          $37,179     $37,884        $40,726      $40,971        $41,535     $42,706
 Applicable Rate                     22.00%       22.00%          22.00%        22.00%           22.00%      22.00%         22.00%       22.00%         22.00%      22.00%
 Next portion of taxable income      $40,280     $43,804         $44,549       $45,529          $46,530     $47,415        $44,812      $45,080        $45,791     $46,992
 Applicable Rate                     26.00%       26.00%          26.00%        26.00%           26.00%      26.00%         26.00%       26.00%         26.00%      26.00%
 On the amount over                 $104,648     $113,804        $115,739      $118,285         $120,887    $123,184       $126,264     $127,021       $128,800    $132,406
 Applicable Rate                     29.00%       29.00%          29.00%        29.00%           29.00%      29.00%         29.00%       29.00%         29.00%      29.00%
Source: Dayarayan centre of tax research

                                         Table of Individual Income Tax Rates for the Province of British Columbia / 2003- 2012
                    Portion                    2003         2004        2005          2006         2007         2008         2009       2010          2011       2012
         st
        1 portion of taxable income          $31,653      $32,476     $33,061       $33,755      $34,397      $35,016      $35,716    $35,859      $36,146    $37,013
        Applicable Rate                       6.05%        6.05%       6.05%         6.05%        5.70%        5.06%        5.06%      5.06%         5.06%       5,06
        Next portion of taxable income       $31,655      $32,478     $33,062       $33,756      $34,397      $35,017      $35,717    $35,860      $36,147    $37,015
        Applicable Rate                       9.15%        9.15%       9.15%         9.15%        8.65%        7.70%        7.70%      7.70%         7.70%      7.70%
        Next portion of taxable income       $9,377       $9,621      $9,794        $10,000      $10,190      $10,373      $10,581    $10,623      $10,707    $10,965
        Applicable Rate                      11.70%       11.70%      11.70%        11.70%       11.10%       10.50%       10.50%     10.50%        10.50%     10.50%
        Next portion of taxable income       $15,575      $15,980     $16,268       $16,610      $16,925      $17,230      $17,574    $17645       $17,786    $18,212
        Applicable Rate                      13.70%       13.70%      13.70%        13.70%       13.00%       12.29%       12.29%     12.29%        12.29%     12.29%
        On the amount over                   $88,260      $90,555     $92,185       $94,121      $95,909      $97,636      $99,588    $99,987      $100,787   $103,205
        Applicable Rate                      14.70%       14.70%      14.70%        14.70%       14.70%       14.70%       14.70%     14.70%        14.70%     14.70%
        Source: Dayarayan centre of tax research


                                                                                          39 
 
BC Combined Federal and Provincial Income Tax Rates for Income Earned by a Canadian-Controlled Private Corporation(CCPC)
                                                                                                   General Active
                         Small Business Income up to          Active Business Income between
      Effective date                                                                                  Business              Investment Income
                                  $400,000                         $400,000 and $500,000
                                                                                                      Income
        01-Jan-08              15.5/14.5/13.5%                                -                      31.5/30.5%                 46.7/45.7%
        01-Jan-09                  13.50%                                  22.00%                      30.00%                     45.70%
        01-Jan-10                  13.50%                                  21.50%                      28.50%                     45.20%
        01-Jan-11                  13.50%                                  21.00%                      26.50%                     26.50%
        01-Jan-12                    15%                                    25%                         25%                        25%

                         BC Provincial Income Tax Rates for Income Earned by a Canadian-Controlled Private Corporation(CCPC)
                                                                                                 General Active
                         Small Business Income up to         Active Business Income between
      Effective date                                                                                Business             Investment Income
                                  $400,000                        $400,000 and $500,000
                                                                                                    Income
        01-Jan-08                4.5/3.5/2.5%                               -                         12/11%                    12/11%
        01-Jan-09                   2.50%                                 11%                          11%                       11%
        01-Jan-10                   2.50%                                10.50%                       10.50%                    10.50%
        01-Jan-11                   2.50%                                 10%                          10%                       10%
        01-Jan-12                   2.50%                                 10%                          10%                       10%

                          Small Business Income (SBI) Thresholds for Canadian-Controlled Private Corporations (CCPCs) 2008-2012
       Description                   2008                                  2009                         2010                    2011-2012
    Federal                        $400,000                              $500,000                     $500,000                   $500,000
    British Columbia               $400,000                              $400,000                     $400,000                   $500,000


                                                                           40 
 
Federal Personal Income Tax Rates / 2004-2012
                                                                                                                                                                                             Marginal Tax Rates
                                                             Taxable Income                                                                                                                        Canadian Dividends
                                                                                                                                                   Capital Gains       Small Business                                                                     Other Income
                                                                                                                                                                                                                  Eligible Dividends
                                                                                                                                                                         Dividends
     2005                2006              2007              2008              2009              2010            2011            2012                                                     2005-                                                                  2005-
                                                                                                                                               2004      2005-2012   2004     2005-2012                2007-2009          2010         2011      2012     2004
                                                                                                                                                                                          2006                                                                   2012

first $35,595       first $36,378     first $37,178     first $37,885     first $40,726     first $40,970     First $41,544   First $427.7     8.00%        7.50%    3.33%      2.08%     2.08%         (5.75%)          (4.28%)       (2.02%)   (0.03)   16%    15.00%


                                                                                                                              Over
over $35,595 up     over $36,378 up   over $37,178 up   over $37,885 up   over $40,726 up   over $40,970 up   Over 41,544
                                                                                                                              427,7to          11.00%      11.00%    10.83%     10.83%    10.83%         4.40%            5.80%        7.78%     9.65     22%    22.00%
to $71,190          to $72,756        to $74,357        to $75,769        to $81,452        to $81,941        to 83,088
                                                                                                                              85,414


                                                                                                                              Over
over $71,190 up     over $72,756 up   over $74,357 up   over $75,769 up   over $81,452 up   over $81,941 up   Over 83,088
                                                                                                                              85,414 to        13.00%      13.00%    15.83%     15.83%    15.83%        10.20%           11.56%        13.49%    15.15    26%    26.00%
to $115,739         to $118,285       to $120,887       to $123,184       to $126,264       to $127,021       to 128,800
                                                                                                                              132,406

                                                                                                                              Over
over $115,739       over $118,285     over $120,887     over $123,184     over $126,264     over $127,021     Over 128,800                     14.50%      14.50%    19.58%     19.58%    19.58%        14.55%           15.88%        17.72%    19.29    29%    29.00%
                                                                                                                              132,406


                                Marginal tax rate for dividends is a % of actual dividends received (not grossed-up amount).
                                                           Federal Basic Personal Amount                                                                                                              Tax Rate
                                 2004     2005       2006     2007      2008       2009      2010       2011      2012     2004                                                                      2005 & 2012                    2006
                                $8,012 $8,648 $9,039 $9,600 $9,600 $10,320 $10,382 $10,527 $10,822 16.00%                                                                                              15.00%                      15.25%
                             Source: Dayarayan centre of tax research


                                                                                                                                             41 
 
Total Average Household Expenditure By Province
                              Year                        2007                  2008                   2009
                Canada                                   69,950                71,360                 71,120

                Newfoundland and Labrador                55,010                57,710                 57,600

                Prince Edward Island                     55,570                58,710                 56,900

                Nova Scotia                              59,990                60,330                 60,870

                New Brunswick                            58,210                58,440                 61,210

                Quebec                                   57,310                60,480                 60,120

                Ontario                                  76,650                77,310                 76,580

                Manitoba                                 63,300                63,510                 66,610

                Saskatchewan                             63,940                68,280                 69,380

                Alberta                                  85,910                86,910                 84,980

                British Columbia                         72,620                73,120                 73,570


Average total expenditure and shares of spending of major categories for provinces and territories, 2009

                                        Average
                                                                                                                Personal
                                       household          Food     Shelter     Clothing       Transportation
                                                                                                                 taxes1
                                       spending
                                            $                                  Shares of spending2 (%)
Canada                                      71,120         10.2         19.8            4.0              13.7        20.2
Newfoundland and Labrador                   57,600         11.3         16.6            4.3              16.0        18.5
Prince Edward Island                        56,900         11.8         19.5            3.7              14.0        16.8
Nova Scotia                                     60,870     11.0         18.9            3.6              14.6        18.2
New Brunswick                               61,210         10.9         17.4            3.7              15.8        17.5
Quebec                                      60,120         12.0         18.8            3.9              13.9        19.9
Ontario                                     76,580          9.5         20.3            4.1              13.4        21.1
Manitoba                                    66,610          9.8         18.3            3.9              14.3        20.2
Saskatchewan                                    69,380      9.1         17.9            3.8              15.9        19.4
Alberta                                     84,980          9.2         19.0            4.0              14.0        22.2
British Columbia                            73,570         10.3         22.2            3.9              12.7        17.9
Yukon                                       69,860         10.7         19.9            3.7              12.8        18.5
Northwest Territories                           82,970     11.5         21.5            3.9              12.2        21.3
Nunavut                                     84,440         17.5         15.2            5.0               7.5        18.7
1. Percentage of spending on personal taxes depends on provincial and federal income tax rates as well as
2. Shares of spending represent the proportions of average household spending.


                                                                  42 
 
What's Taxable under the HST and What's Not in British Columbia?1
    AROUND THE HOUSE                     GST-taxable                          PST-taxable              Is there a change to the
                                         before July,                         before July               amount of tax payable
                                            2010                                1,2010                        the HST?
    Cleaning Products                        5%                                   7%                      No (remains 12%)
    Laundry Detergent, Fabric Softeners      5%                                   7%                      No (remains 12%)
    Household Furniture                      5%                                   7%                      No (remains 12%)
    Household Appliances                     5%                                   7%                      No (remains 12%)
    (Refrigerators, Stoves, Washers,
    Dryers, Freezers, Dishwashers)
    Pre-packaged Computer Software           5%                                    7%2                    No (remains 12%)
    Books (Including Audio Books)            5%                                   No PST                   No (remains 5%)
    Newspapers                               5%                                   No PST                 Yes (changes to 12%)
    Certain School Supplies                  5%                                   No PST                 Yes (changes to 12%)
    Magazines                                5%                                   No PST                 Yes (changes to 12%)
    Office Supplies and Stationery           5%                                    7%                     No (remains 12%)
    Landscaping Material (Sod, Topsoil,      5%                                    7%                     No (remains 12%)
    Rockery)
    Linens (e.g., Blankets, Towels,          5%                                      7%                    No (remains 12%)
    Sheets)
    Tens, Sleeping Bags, Camping             5%                                      7%                    No (remains 12%)
    Equipment
    Tools                                    5%                                      7%                    No (remains 12%)
    Patio Furniture                          5%                                      7%                    No (remains 12%)
    Rugs and Mats                            5%                                      7%                    No (remains 12%)
    Works of Art, Vases, and Carvings        5%                                      7%                    No (remains 12%)
    Sewing Machines                          5%                                      7%                    No (remains 12%)
    Vacuum Cleaners                          5%                                      7%                    No (remains 12%)
    Barbeques, Lawnmowers, Snow              5%                                      7%                    No (remains 12%)
    Blowers, Sprinklers
    Toys (e.g., Puzzles, Games, Action       5%                                      7%                    No (remains 12%)
    Figures, Dolls, Playsets)
    Outdoor Play Equipment (e.g.,            5%                                      7%                    No (remains 12%)
    Swing Sets, Sandboxes, Slides)
    Arts and Craft Supplies (e.g., Glue,     5%                                      7%                    No (remains 12%
    Paper, etc)
    Building Materials (e.g., Lumber,        5%                                      7%                    No (remains 12%
    Concrete Mix, Nails)
    Energy Star Windows                      5%                                  No PST3                 Yes (changes to 12%)
    Thermal Insulation, Weather              5%                                  NoPST                   Yes (changes to 12%)
    Stripping and Caulking
    Exterior and Interior Paint              5%                                    7%                     No (remains 12%)
    Kitchen Utensils                         5%                                    7%                     No (remains 12%)
    Cookware                                 5%                                    7%                     No (remains 12%)
    First Aid Kits                           5%                                   No PST                 Yes (changes to 12%)
    Smoke Detectors Valued less Than         5%                                   No PST                 Yes (changes to 12%)
    $2502 for Residential Use
    Other Smoke Detectors                    5%                                      7%                    No (remains 12%)
                                                            
1
 - Assumes sales by GST/HST registrants that are not non-profit organization or registered charities, unless otherwise specified.
2
  - The Energy Star exemption for residential refrigerators, freezers and clothes washers ended on March 31, 2010. All major household
     appliances are now subject to PST.
3
  - Exemption was scheduled to expire April 2011.

                                                                   43 
 
AROUND THE HOUSE                                           GST-taxable     PST-taxable              Is there a change to the
                                                               before July,    before July               amount of tax payable
                                                                  2010           1,2010                        the HST?
    Household Pets (Including Pet                                  5%              7%                      No (remains 12%)
    Food)
    House Plants, Cut Flowers, and                                 5%                7%                     No (remains 12%)
    Outdoor Ornamental Plants
    Food Producing Plants and Trees                                5%             No PST                 Yes (changes to 12%)
    (e.g., Tomato Plants, Plum Tree)
    Household Moving Services                                      5%            No PST                   Yes (changes to 12%)
    CLOTHING, FOOTWEAR AND                                     GST-taxable     PST-taxable              Is there a change to the
    ACCESSORIES                                                before July,      before                  amount of tax payable
                                                                  2010         July 1,2010                      the HST?
    Adult Clothing and Footwear                                    5%              7%                      No (remains 12%)
    Children Sized Clothing and                                    5%            No PST                     No (remains 5%)
    Footwear
    Adult Sized Clothing for Children                              5%             No PST                 Yes (changes to 12%)
    Children's Cloth Diapers                                       5%             No PST                   No (remains 5%)4
    Children's Disposable Diapers                                  5%              7%                     Yes (drops to 5%)5
    Shoe Repair                                                    5%             No PST                 Yes (changes to 12%)
    Tailoring Services                                             5%             No PST                 Yes (changes to 12%)
    Dry Cleaning                                                   5%             No PST                 Yes (changes to 12%)
    Formal Wear Rentals                                            5%              7%                      No (remains 12%)
    Used Adult Clothing Purchased for                              5%             No PST                 Yes (changes to 12%)6
    Less Than $100
    Watches                                                        5%              7%                      No (remains 12%)
    Jeweller                                                       5%              7%                      No (remains 12%)
    Handbags and Purses                                            5%              7%                      No (remains 12%)
    Backpacks                                                      5%              7%                      No (remains 12%)
    Shoe Insoles and Laces                                         5%              7%                      No (remains 12%)
    Sunglasses (Non-prescription)                                  5%              7%                      No (remains 12%)
    Scarves                                                        5%              7%                      No (remains 12%)
    Umbrellas                                                      5%              7%                      No (remains 12%)
    Belts                                                          5%              7%                      No (remains 12%)
    FOOD AND BEVERAGES                                         GST-taxable     PST-taxable             Is there a change to the
                                                                  before         before                amount of tax payable
                                                                July, 2010     July 1,2010                     the HST?
    Basic Groceries (e.g., Dairy, Meat,                          No GST          No PST                         No HST
    Vegetables, Canned Goods)
    Snack Foods (e.g., Chips, Pop)                                 5%             No PST                 Yes (changes to 12%)
    Restaurant Meals                                               5%             No PST                 Yes (changes to 12%)
    Alcoholic Beverages                                            5%              10%                    Yes (drops to 12%)7


4
  - For Further detail see http://www.cra-arc.gc.ca/E/pub/gi/gi-063-e.pdf.
5
  - For Further detail see http://www.cra-arc.gc.ca/E/pub/gi/gi-063-e.pdf.
6
  - All sales used or donated goods mode by a registered charity are exempt from HST.
7
  - Although the provincial sales tax rate on liquor is decreasing from 10% to 7% liquor mark-ups are adjusted with the implementation of
      the HST to generally keep the Liquor Distribution Branch shelf prices constant..


                                                                        44 
 
AROUND THE HOUSE                                           GST-taxable       PST-taxable               Is there a change to the
                                                               before July,      before July                amount of tax payable
                                                                  2010             1,2010                         the HST?
    Catering and Event Planning                                    5%              No PST8                  Yes (changes to 12%)9
    Services
    (e.g., planning, consulting,
    coordinating and organizing)
    HOME SERVESES                                              GST-taxable       PST-taxable              Is there a change to the
                                                                  before           before                 amount of tax payable
                                                                July, 2010       July 1,2010                      the HST?
    Basic Cable Television                                         5%              No PST                   Yes (changes to 12%)
    Additional or Specialty Cable                                  5%                7%                       No (remains 12%)
    Television or Satellite Television
    Cell Phone                                                     5%                 7%                       No (remains 12%)
    Municipal Water                                              No GST              No PST                         No HST
    Home Maintenance Equipment                                     5%                 7%                       No (remains 12%)
    (e.g., Lawn Mowers, Mops)
    Local Residential Phone                                        5%                No PST                 Yes (changes to 12%)
    Long Distance Telephone Services                               5%                 7%                     No (remains 12%)
    Repair to Certain Household                                    5%                No PST                 Yes (changes to 12%)
    Appliances (e.g., Stoves, Ovens,
    Refrigerators, Washers, and Dryers)
    Repair to Household Electronics                                5%                   7%                     No (remains 12%)
    (e.g., Televisions and Stereo
    Equipment)
    Home Insurance                                               No GST            No PST                          No HST
    Residential Electricity and Heating                            5%            No PST, but                Yes (drops to 5%, from
    (e.g., Natural Gas/Oil)                                                     subject to 0.4%                5.4%, after a 7%
                                                                               ICE10 Fund levy               provincial rebate)11
    Internet Access                        5%                                         7%                      No (remains 12%)
    Repair Maintenance or Renovation       5%                                       No PST                  Yes (changes to 12%)
    Services for Real Property (e.g.,
    Plumbing Electrical Wiring)
    Landscaping Lawn-Care, Private         5%                                        No PST                 Yes (changes to 12%)
    Snow Removal and House Cleaning
    Computer Hardware Repair Services      5%                                           7%                     No (remains 12%)
    (e.g., adding or repairing circuit
    boards or other components
    Computer Software Repair Services      5%                                        No PST                 Yes (changes to 12%)
    (e.g., virus removal or software
    installation)
    ACCOMMODATION AND                  GST-taxable                               PST-taxable              Is there a change to the
    TRAVEL                                before                                   before                 amount of tax payable
                                        July, 2010                               July 1,2010                      the HST?
    Luggage                                5%                                        7%                       No (remains 12%)
    Municipal Public Transit                                     No GST              No PST                        No HST
    Hotel Rooms                                                    5%                 8%                     Yes (drops to 12%)12
                                                            
8
  - PST applies if the caterer provides a taxable service (e.g., setting up and taking down temporary gazebos, tents, and dance floors) or
      taxable goods that the customer keeps (e.g., flowers or decorations).
9
  - Catering provided by a registered charity is exempt from HST.
10
   - Innovative Clean Energy
11
   - Provincial administered Residential Energy Rebate applies to provincial portion of HST and ICE Fund levy is eliminated.
12
   - In certain municipalities there is an additional local hotel room tax of up to 2% for tourism marketing

                                                                        45 
 
AROUND THE HOUSE                                           GST-taxable       PST-taxable              Is there a change to the
                                                               before July,      before July               amount of tax payable
                                                                  2010             1,2010                         the HST?
    Taxis                                                          5%              No PST                   Yes (changes to 12%)
    Camping Sites                                                  5%              No PST                   Yes (changes to 12%)
    British Columbia Ferry System                                No GST             No PST                            No HST
    Domestic Air, Rail and Bus Travel                              5%               No PST                  Yes (changes to 12%)
    Originating in British Columbia
    International Air Travel to                                    5%               No PST                     No (remains 5%)
    Continental United States
    originating in British Columbia
    (Other Than Day Trips)
    International Air Travel Other Than                          No GST             No PST                            No HST
    to Continental United States
    originating British Columbia
    International Rail, Bus or Ship                              No GST              No PST                           No HST
    Travel originating in British
    Columbia (Other Than Day Trips)
    MOTORIZED VEHICLES                                         GST-taxable       PST-taxable    Is there a change to the
                                                                  before            before       amount of tax payable
                                                                July, 2010       July 1,2010            the HST?
    Short Term Auto Rentals                                        5%           7% Plus $ 1.50 Yes (rate remains at 12%
                                                                              per day Passenger   but $1.50 per day tax
                                                                                Vehicle Rental         eliminated
                                                                                     Tax
    Lease of a Vehicle Other Than an                               5%             7% to 10%     Depends on previous PST
    Alternative Fuel Vehicle of Fuel                                                            treatment (remains 12%
    Efficient Vehicle                                                                               or drops to 12%)
    Lease of Alternative Fuel Vehicle                              5%             7% to 10%     Depends on previous PST
    and Fuel Efficien Vehicle                                                 (Subject to a PST treatment (remains 12%
                                                                                 reduction) 13      or drops to 12%)
    Purchase of Vehicle Other Than an                              5%             7% to 10%     Depends on previous P5T
    Alternative Fuel Vehicle or Fuel                                                            treatment (remains 12%
    Efficient Vehicle                                                                               or drops to 12%)
    Purchase of an Alternative Fuel                                5%           7% to 10%       Depends on previous
    Vehicle and Fuel Efficient Vehicle                                         (subject to a       PST treatment
                                                                                   PST            (remains 12% of
                                                                                reduction)         drops to 12%)
    Child Car Seats and Booster. Seats                             5%              No PST          No (remains 5%)14
    Auto Insurance                                               No GST            No PST                No HST
    Vehicle Parts                                                  5%                 7%            No (remains 12%)
    Vehicle Repair Services                                        5%                   7%                    No (remains 12%)
    Gil Changes                                                    5%                   7%                    No (remains 12%)
    Tires                                                          5%                   7%                    No (remains 12%)
    Automotive Window Repair                                       5%                   7%                    No (remains 12%)

                                                            
13
   - Please note that purchases and leases of some new alternative fuel vehicles or new fuel efficient vehicles are subject to a partial
      reduction in the PST payable. For more information on the amounts of this PST reduction and who qualifies, please see Bulletin
      SST085 Alternative Fuel Vehicles and Fuel Efficient Vehicles, located on the Ministry of Finance's website at http://www.cra-
      arc.gc.ca/E/pub/gi/gi-063/gi-063-e.pdf.
14
   - For further detail, refer to http://www.cra-arc.gc.ca/E/pub/gi/gi/063-e.pdf.

                                                                        46 
 
AROUND THE HOUSE                                           GST-taxable      PST-taxable              Is there a change to the
                                                               before July,     before July               amount of tax payable
                                                                  2010            1,2010                         the HST?
    Purchase of                                                    5%            7% to 10%               Depends on previous PST
    Used Vehicle                                                                                         treatment (remains 12%
    from a Non-                                                                                              or drops to 12%)
    GST Registrant
    (e.g., car dealer)
    Purchase of Used vehicle from-                               No GST           7% to 10%              No HST (12% provincial
    ali^ff-GST Registrant (e.g., Private                                                                     tax applies) 15
    seller)
    Purchase of Boats and Non-Turbin                             No GST                7%                No HST (12% provincial
    Aricraft from a Non-GST Registrant                                                                        tax applies)
    (e.g., Private Seller)
    Boats and Non-Turbine Aircraft                                 5%                  7%                     No (remains 12%)
    Gasoline/Diesel                                                5%               No PST                    No (remains 5%)16
    VehideOil, Grease, Lubricants                                  5%                  7%                     No (remains 12%)
    antifreeze
    Outboard Motors                                                5%                  7%                     No (remains 12%)
    Motor Vehicle Parking                                          5%               No PST                  Yes (changes to 12%)
    HOME PURCHASES                                             GST-taxable      PST-taxable              Is there a change to the
                                                                  before          before                 amount of tax payable
                                                                July, 2010      July 1,2010                      the HST?
    Niew Homes up to $525,000                                      5%             No PST                       No change"17
    New Homes over $525,000                                        5%             No PST                           Yes18
    Previously Occupied Homes                                    No GST           No PST                          No HST
    Legal fees                                                     5%               7%                       No (remains 12%)
    Real Estate Commissions                                        5%             No PST                  Yes (changes to 12%)
    HEALTH AND BEAUTY                                          GST-taxable      PST-taxable              Is there a change to the
                                                                  before          before                 amount of tax payable
                                                                July, 2010      July 1,2010                     the HST?
    Health Care Services Offered                                 No GST           No PST                         No HST
    by a Medical Practitioner (e.g.,
    Medical and Dental Services) 19
    Audiologist Services Offered by a                            No GST             No P5T                           No HST
    practitioner of the Service
    Chiropractic Services Offered by a                           No GST             No PST                           No HST
    practitioner of the Service
    Physiotherapy Services Offered by a                          No GST             No PST                           No HST
    practitioner of the Service
    Massage Therapy Services                                       5%               No PST                  Yes (changes to 12%)
    Pharmacist Dispensing Fees                                   No GST             No PST                         No HST
    Over-the-Counter Medications                                   5%               No PST                  Yes (changes to 12%)
                                                            
15
   - HST does not apply. However, British Columbia's 12% tax on private sales of boots, aircraft and vehicles will apply to provide
      comparable treatment to sales by dealerships.
16
   - In For further detail, refer to http://www.cra-arc.gc.ca/E/Pub/gi/gi/061-e.pdf.
17
   - BC will provide a rebate of 71.43% of the provincial portion of the HST, to a maximum of $26,250, for new housing purchased as a
      primary residence. The rebate ensures that, on average, purchasers will pay no more provincial tax due to harmonization-that is, the will
      pay no more in provincial HST than is currently embedded as PST in the price of a new home. It is estimated that the embedded PST in
      new homes in BC is, on overage, equal to about 2% of the price.
18
   - Purchasers of eligible new homes over $, are eligible for a rebate of $26,250
19
   - Other than for cosmetic purposes.

                                                                        47 
 
AROUND THE HOUSE                                           GST-taxable            PST-taxable   Is there a change to the
                                                               before July,           before July    amount of tax payable
                                                                  2010                  1,2010             the HST?
    Prescription Drugs                                           No GST                 No PST              No HST
    Some Medical Devices Including                               No GST                 No PST              No HST
    Walkers, Hearing Aids
    Prescription Glasses and Contact                             No GST                 No PST              No HST
    Lenses
    Feminine Hygiene Products                                      5%                   No PST        No (remains 5%)20
    Adult Incontinence Products                                  No GST                 No PST             No HST
    Cosmetics                                                      5%                    7%           No (remain5l2%)
    Hair Care Products (e.g., Shampoo,                             5%                    7%           No (remains 12%)
    Conditioner, Styling Products)
    Dental Hygiene Products (e.g..                                 5%                     7%           No (remains 12%)
    Toothpaste, Toothbrushes, Floss)
    Vitamins                                                       5%                   No PST       Yes (changes to 12%)
    Pill Boxes                                                     5%                    7%           No (remains 12%)
    Sow Dryers                                                     5%                    7%           No (remains 12%)
    Curling Irons                                                  5%                    7%           No (remains 12%)
    Deodorants and Deodorizers                                     5%                    7%           No (remains 12%)
    Nail Care Products (e.g. Nail Polish,                          5%                    7%           No (remains 12%)
    Nail Files)
    Perfume                                                        5%                     7%           No (remains 12%)
    Shaving Supplies (e.g., Razors,                                5%                     7%           No (remains 12%)
    Shaving Cream)
    Tanning Lotion                                                 5%                     7%           No (remains 12%)
            MEMBERSHIPS,                                       GST-taxable            PST-taxable   Is there a change to the
        ENTERTAINMENT AND                                         before                before      amount of tax payable
          SPORTS EQUIPMENT                                      July, 2010            July 1,2010           the HST?
    Admission to Professional Sporting                             5%                   No PST        Yes (changes to 12%)
    Events (e.g. Hockey, Football and
    Soccer Games)
    Movie Tickets                                                  5%                  NO P5T        Yes (changes to 12%)
    MUSIC Lessons                                                No GST                No PST               No HST
    Music Instruments                                              5%                   7%            No (remains 12%)
    Skis and Snowboards                                            5%                   7%            No (remains 12%)
    Hockey Equipment                                               5%                   7%            No (remains 12%)
    Steles (e.g., Hockey, Figure, Inline)                          5%                     7%           No (remains 12%)
    Safety Helmets for Sports (e.g.,                               5%                   No PST       Yes (changes to 12%)
    Hockey Helmets, Snowboard
    Helmets, Bike Helmets)
    6o!r Clubs                                                     5%                     7%           No (remains 12%)
    Golf Memberships                                               5%                   No PST       Yes (changes to 12%)
    Driving Range Fees                                             5%                   No PST       Yes (changes to 12%)
    Gym and Athletic Memberships                                   5%                   No PST       Yes (changes to 12%)


20
     - For further detail, refer to http://www.cra-arc.gc.ca/E/Pub/gi/gi/061-e.pdf.

                                                                         48 
 
AROUND THE HOUSE                    GST-taxable                           PST-taxable              Is there a change to the
                                        before July,                          before July               amount of tax payable
                                           2010                                 1,2010                        the HST?
    Ballet, Karate, Trampoline. Hockey.     5%                                  No PST                     21
                                                                                                       Yes (changes to 12%)
    Soccer Lessons etc.
    Tickets for Live Theatre                5%                                    No PST               Yes22 (changes to 12%)
    Swim Fins and Swimming Goggles                                 5%                7%                    No (remains 12%)
    Bicycles                                                       5%             No PST                Yes (changes to 12%)
    Bicycle Accessories Purchased                                  5%                7%                    No (remains 12%)
    Separately
    Admission to Museums and Art                                   5%             No PST                Yes (changes to 12%)
    Galleries
    Music Concerts                                                 5%             No PST                Yes (changes to 12%)
    Sports Equipment (e.g., Footballs,                             5%                7%                    No (remains 12%)
    Soccer Ball, Baseball Bats, Free
    Standing Gymnastics Equipment)
    Ski Lift Passes                                                5%             No PST                Yes (changes to 12%)
    Adult Sized Ski Gloves                                         5%                7%                    No (remains 12%)
    Adult Sized Ski Gloves for Children                            5%             No PST                Yes (changes to 12%)
    Children's Sized Ski Gloves                                    5%             No PST                   No (remains 5%)
    Ski Goggles                                                    5%                7%                    No (remains 12%)
    Adult Sized Ski Boots                                          5%                7%                    No (remains 12%)
    Adult Sized Ski Boots for Children                             5%             No PST                Yes (changes to 12%)
    Children's Sized Ski Boots                                     5%             No PST                Yes (changes to 12%)
    LEASSE AND RENTALS                                         GST-taxable    PST-taxable             Is there a change to the
                                                                  before        before                amount of tax payable
                                                                July, 2010    July 1,2010                    the HST?
    Condo Fees                                                   No GST         No PST                       NO HST23
    Long-Term Residential                                        No GST           No PST                          No HST
    Accommodation
    Hockey Rink and Hall Rentals                                   5%             No PST                Yes (Changes to 12%)
    Equipment Rentals (e.g., Carpet                                5%              7%                    No (remains 12%)
    cleaners, power washers)
    ELECTRONICS                                                GST-taxable    PST-taxable             Is there a change to the
                                                                  before        before                amount of tax payable
                                                                July, 2010    July 1,2010                     the HST?
    Televisions                                                    5%             7%                      No (remains 12%)
    DVD and Blu-ray Players and                                    5%                7%                    No (remains 12%)
    Accessories
    Digital Cameras and Camcorders                                 5%                7%                    No (remains 12%)
                                                            
21
   - These items are subject to HST, although some could be exempt from HST if provided by a public service boody to children 14 and
      under and underprivileged individuals with a disability.
22
   - Subject to HST, although some could be exempt if the maximum admission charged by a public service body to children 14 and under
      and underprivileged individuals with a disability.
23
   - Residential condo association fees to residents are exempt; however, purchase by condominium corporation will be subject to HST, if
      applicable.

                                                                        49 
 
AROUND THE HOUSE                   GST-taxable    PST-taxable   Is there a change to the
                                       before July,   before July    amount of tax payable
                                          2010          1,2010             the HST?
    Cell Phones and Smart Phones           5%             7%           No (remains 12%)
    CDs, DVDs, and Blu-ray Discs           5%             7%           No (remains 12%)
    MP3 Players                            5%             7%           No (remains 12%)
    Music or Video MP3s Downloaded         5%           No PST       Yes (changes to 12%)
    Electronically
    Video Game Consoles                    5%             7%           No (remains 12%)
    Video Games                            5%             7%           No (remains 12%)
    GPS Systems                            5%             7%           No (remains 12%)
    Laptops                                5%             7%           No (remains 12%)
    Desk Top Computers                     5%             7%           No (remains 12%)
    Printers and Fax Machines              5%             7%           No (remains 12%)
    Stereos and Speakers                   5%             7%           No (remains 12%)
    Cables, Wires, and Connector           5%             7%           No (remains 12%)
    Projector Screens                      5%             7%           No (remains 12%)
    Headphones                             5%             7%           No (remains 12%)
    Marine Electronics (e.g., Marine       5%             7%           No (remains 12%)
    Radios, GPS Systems, Speakers)
    PROFESSIONAL AND                   GST-taxable    PST-taxable   Is there a change to the
    PERSONAL SERVICES                     before        before      amount of tax payable
                                        July, 2010    July 1,2010          the HST?
    Child Care Services                  No GST         No PST              No HST
    Legal Aid                            No GST         No PST              No HST
    Funeral Services                       5%           No PST       Yes (changes to 12%)
    Coffins and Urns Purchased from        5%            7%           No (remains 12%)
    Funeral Services
    Fitness Trainer                        5%           No PST       Yes (changes to 12%)
    Hair Stylist/Barber                    5%           No PST       Yes (changes to 12%)
    Aesthetician Services (e.g.,           5%           No PST       Yes (changes to 12%)
    Manicures, Pedicures, Facials)
    Legal Services                         5%             7%           No (remains 12%)
    Accounting Services                    5%           No PST       Yes (changes to 12%)
    Interior Design Services               5%           No PST       Yes (changes to 12%)
    Wedding Planning Services              5%           No PST       Yes (changes to 12%)
    Veterinarian Services                  5%           No PST       Yes (changes to 12%)
    Professional Printed Photographs       5%             7%           No (remains 12%)
    Furniture, Automotive and Marine       5%             7%           No (remains 12%)
    Re-upholstery
    TOBACCO                            GST-taxable    PST-taxable   Is there a change to the
                                         before         before      amount of tax payable

                                                50 
 
AROUND THE HOUSE                GST-taxable    PST-taxable   Is there a change to the
                                    before July,   before July    amount of tax payable
                                       2010          1,2010             the HST?
                                     July, 2010    July 1,2010          the HST?
    Cigarettes                          5%           No PST       Yes (changes to 12%)
    Cigars                              5%           No PST       Yes (changes to 12%)
    Chewing Tobacco                     5%           No PST       Yes (changes to 12%)
    Nicotine Replacement Products       5%           No PST       Yes (changes to 12%)
    BANKING AND INVESTMENTS GST-taxable            PST-taxable   Is there a change to the
                               before                before      amount of tax payable
                             July, 2010            July 1,2010          the HST?
    Mortgage Interest Costs   No GST                 No PST              No HST
    Most Financial Services   No GST                 No PST              No HST


                                             51 
 
References:
    1. BC budget 2012,2011,2010
    http://www.bcbudget.gov.bc.ca/2010/highlights/2010_Highlights.pdf
    2. BC Budget 2009 http://www.bcbudget.gov.bc.ca/2009/estimates/2009_Estimates.pdf
    3. http://www.fin.gov.bc.ca/Fed_Prov_MOU_english_July23.pdf
    4. Taxation and Economic Efficiency: Results from a Canadian CGE Model, par
        Maximilian Baylor et Louis Beauséjour, Canadian federal Finance Minister 2004
    5. Vaughn Palmer Ambitious reforms by Liberal governments to be eclipsed by HST,
        Vancouver Sun, July 28th, 2009
    6. from [[2][Public account of Canada]], stating at $29.9 billions the 5% GST revenue
        for whole Canada for the exercise 2007/2008, and considering the contributively part
        of the British Columbia is of 15.4% in 2003 according to
    http://www.parl.gc.ca/information/library/PRBpubs/prb0610-e.htm, , 29.9*(15.7%)=
    $4.6Billions not including the BC GDP growth
    7. http://www2.news.gov.bc.ca/news_releases_2009-2013/2009PREM0017-000141.htm
    8. Taxation and Economic Efficiency: Results from a Canadian CGE Model, par
        Maximilian Baylor et Louis Beauséjour, Canadian federal Finance Minister 2004
    9. http://www.fraserinstitute.org/Commerce.Web/product_files/JulAug06ffTaxCuts.pdf
    10. http://www.vancouversun.com/business/good+business+business+should+tell/187258
        2/story.html
    11. http://www.theprovince.com/news/Revenue+neutral+levy+could+pull+200m/186476
        6/story.html
    12. http://www.strategicthoughts.com/record2009/HSTbase.html
    13. Alberta Budget Eliminates Health-Care Premiums
    14. Canada Revenue Agency
    15. http://www.vancouver-real-estate-direct.com/HST/index.html)
    16. http://vancouver.ca/aboutvan.htm
    17. OECD, 2005 data
    18. Deloitte country guide Canada tax
    19. PMG Canada tax
    20. http://www.Taxtips.ca
    21. https://hst.blog.gov.bc.ca/wp-content/uploads/2010/05/GST_PST_HST_List_v04.pdf


                                             52 
 
DMC
Dayarayan Management & Consulting LTD
 is a Canadian company which provides full company services including
company registration, management, and financial services. With our head
quarter in Vancouver, we can even provide Canadian bank account opening and
other confidential services which protect our clients.

Our Services:
    Worldwide Companies Registration
    Bank Account Opening
    Annual Renewal, Accounting and Auditing etc
    HK Company: Services include Annual Return, Accounting and internal
    Auditing,
    Tax return, Change of Shareholder(s) or Director(s), Company Suspension
    or Termination, etc.
      Investment Consulting
     Management Consultancy
     Company formation(IBC , BVI)
     Management of offshore entities
     Tax Advice - Canada & International
     Representation, Nominee & Trustee Services
     Company Secretarial & Legal Services
     Administration & Professional Services
     Banking Support Services
     Accounting Services

CONTACT US:Dayarayan Management & CONSULTING (LTD)
809-168 Esplanade East, North Vancouver V7L 4X8
Vancouver. British Columbia. Canada
Tel: 1604-9833704     Cell: 778-861-1340 Cell: 17788295504
Website: www.dayarayan.ca
Email: info@dayarayan.ca
Dayarayan.ca@gmail.com


                                     53 
 
Dayarayans’ publication in English:
1-   Canada Taxation 2012
2-   Canada Taxation 2011
3-   Canada Taxation 2010
4-   Canada Taxation 2009
5-   Doing business in Iran
6-   Canada Tax Guide 2008
7-   World Economy Index 2007

Find US:
1. www.dayarayan.net
2. www.dayarayan.ca/portal
3. www.dayarayan.info
4. icaew.com/index.cfm/route/156616/icaew_ga/en/Library/...
5. dayarayanmanagementconsultingltd.blogspot.com
6. www.estandardsforum.org/iran/.../international-standards-on-auditing
7. www.docstoc.com/docs/11040469/tax-guide-in-Canada
8. dayarayanmanagementconsultingltd.blogspot.com/.../canada-tax-revenue.html
9. www.iadvisory.gov.sg/upload/Doing_Business_in_Iran.pdf
10. http://www.taxtips.ca/busdir/businessconsulting/bc.htm
11. http://tarazaccounting.blogspot.com/
12. www.worldwide-tax.com/iran/iran_tax.asp
13. http://dayarayanias.blogfa.com/
14. http://dayarayanmanagementconsultingltd.blogspot.com/2010/03/hst-in-british-
colunmbia-2010.html
15. http://dayarayanvancouver.blogspot.com/2009/11/bc-property-tax.html
16. www.linkedin.com/pub/dayarayan-auditing-dayarayan/4/a5a/782
17. finance.groups.yahoo.com/group/Daya-accountants
18. iadvisory.gov.sg/upload/Establishing_a_Joint_Stock_Compan
19. ifac.org/PAIB/relevant_links.php?sort=title&...+Standards
20. totallytax.com/.../Middle_East_Tax_Advisers
21. www.prweb.com/releases/2006/05/prweb383409.htm
22. http://www.iacpa.ir/tabid/160/articleType/ArticleView/articleId/333/Doing-Business-in-
Iran.aspx
23. cnv.org/c/DATA/2/19/2010 BUSINESS LICENCES ISSUED – ALPHA
24. http://www.cnv.org/c/DATA/2/19/2010%20BUSINESS%20LICENCES%20ISSUED%2
0-%20ALPHABETICAL.PDF
25. www.doingbusiness.org/LocalPartners/SearchResults.aspx?economyid=91


                                            54 
 

Canada tax sumury 2012

  • 1.
    This booklet isintended to provide useful information to assist businesses in Canada taxation and new harmonized sales tax (HST) in British Columbia, and does not replace federal or provincial legislation and accompanying regulations. It is strictly intended for reference purposes. As it may not completely address your particular operation, you may wish to consult the appropriate legislation or contact: • Canada Revenue Agency at 1-800-959-5525 or www.cra-arc.gc.ca • B.C. Ministry of Finance at 1-877-388-4440 or www.gov.bc.ca/fin/   1
  • 2.
    Canada at aglance Units Scale 2000 2004 2007 2008 2010 2011 2012 2013 2014 2015 National currency Billions 1,100.52 1,211.24 1,311.26 1,320.29 1,324.99 1,352.56 1,378.33 1,412.87 1,447.58 1,482.15 Index 97.825 106.577 116.65 121.444 122.613 126.287 128.741 131.506 134.295 137.104 National currency Units 35,127.84 40,466.77 46,516.19 48,204.16 47,699.29 49,676.46 51,187.92 53,169.99 55,226.78 57,207.63 Current international dollar Billions 888.552 1,065.76 1,263.63 1,300.55 1,334.14 1,391.11 1,432.61 1,477.94 1,527.17 1,582.35 Percent of GDP 20.23 20.723 23.241 23.238 22.204 23.25 24.011 24.17 24.227 24.177 Percent of GDP 23.623 23.036 24.077 23.569 19.072 19.916 20.196 20.655 21.042 21.596 Index 95.383 104.633 111.45 114.108 116.475 119.858 122.338 124.78 127.26 129.821 Percent change 8.172 16.342 11.852 2.143 25.541 13.394 4.507 3.674 3.707 3.544 Percent change 8.645 16.826 11.452 1.964 26.439 13.698 4.445 3.845 4.083 3.976 Percent change 9.207 13.285 7.032 -4.629 18.649 9.563 3.677 4.759 4.959 5.084 Percent of GDP 43.533 40.589 40.741 39.661 38.261 38.037 38.683 39.532 39.999 40.604 Percent of GDP 40.588 39.726 39.158 39.535 43.815 42.304 41.876 41.441 41.047 40.808 Percent of GDP 46.227 35.213 22.917 22.306 32.224 34.916 36.802 37.056 36.465 35.088 Percent of GDP 82.127 72.601 66.518 71.114 83.953 84.117 84.163 82.287 79.694 76.444 Percent of GDP 2.719 2.311 0.835 0.329 -3.131 -3.334 -3.814 -3.515 -3.185 -2.58   2
  • 3.
    Welcome to theCity of Vancouver Bordered by the Coast Mountain Range and the Pacific Ocean, Vancouver is recognized as one of the world's most livable cities. Archaeological evidence shows that the Coast Salish people had settled the Vancouver area by 500 BC. The City of Vancouver is renowned for its innovative programs in the areas of sustainability, accessibility and inclusivity. In 2010, Vancouver will host the world at the 2010 Olympic and Paralympics Winter Games. Facts about Vancouver Population/ Climate Vancouver is the eighth largest city in Canada with a population of 578,000 (2006 census) and has one of the mildest climates in Canada with temperatures averaging around 3 degrees Celsius in January and 18 degrees Celsius in July. It covers 114.7 sq km (44.3 sq miles), and is part of Metro Vancouver, the third largest metropolitan area in Canada, with a population of 2.1 million (2006 census). Business/ Economy Vancouver has Canada's largest and most diversified port, trading $75 billion in goods annually. It is home to a variety of different industries, including the mining, forest, biotech, film and software industries.   3
  • 4.
    History Archaeological evidence showsthat the Coast Salish people had settled the Vancouver area by 500 BC. In the 1870s, Vancouver was founded as a sawmill settlement called Granville. And in 1886, the city was incorporated and renamed Vancouver after Captain George Vancouver, a British naval captain who explored the area in 1792. Source: http://vancouver.ca/aboutvan.htm Canada at a Glance Population Table: 1995 2005 2010 2011 Year number Canada 29,302,311 32,245,209 34,605,346 34,605,346 Newfoundland and Labrador 567,397 514,363 511,272 511,272 Prince Edward Island 134,415 138,055 146,152 146,152 Nova Scotia 928,120 937,941 946,378 946,378 New Brunswick 750,943 747,960 755,810 755,810 Quebec 7,219,219 7,581,911 8,002,098 8,002,098 Ontario 10,950,119 12,528,480 13,422,912 13,422,912 Manitoba 1,129,150 1,178,301 1,254,658 1,254,658 Saskatchewan 1,014,187 993,579 1,063,535 1,063,535 Alberta 2,734,519 3,322,200 3,798,791 3,798,791 British Columbia 3,777,390 4,196,788 4,592,034 4,592,034 Yukon 30,442 31,904 34,891 34,891 Northwest Territories 41,432 43,399 43,485 43,485 Nunavut 33,330 33,330 24,978 30,328 Source: Statistics Canada, CANSIM table 051-0005.     4
  • 5.
    Canadian federal marginaltax rates of taxable income 1998-2012 $0 - $10,527 $10,527 - $42,707 $42,707- $85,414 $85,414-132,406 over $132,406 2012 $128,800 0% %15 %22 %22 %29 $0 - $10,527 $10,527 - $41,544 $41,544 - $83,088 $81,941 $128,800 over $128,800 2011 0% %15 %22 %22 %29 $0 - $10,382 $10,382 - $40,970 $40,970 - $81,941 $81,941 $127,021 over $127,021 2010 0% %15 %22 %22 %29 2009 $0 - $10,320 $10,321 - $40,726 $40,727 - $81,452 $81,453 - $126,264 over $126,264 0% 15% 22% 26% 29% $0 - $9,600 $9,601 - $37,885 $37,886 - $75,769 $75,770 - $123,184 over $123,184 2008 0% 15% 22% 26% 29% $0 - $9,600 $9,600 - $37,178 $37,178 - $74,357 $74,357 - $120,887 over $120,887 2007 0% 15% 22% 26% 29% $0 - $8,839 $8,839 - $36,378 $36,378 - $72,756 $72,756 - $118,285 over $118,285 2006 0% 15.25% 22% 26% 29% $0 - $8,648 $8,648 - $35,595 $35,595 - $71,190 $71,190 - $115,739 over $115,739 2005 0% 15% 22% 26% 29% $0 - $8,012 $8,012 - $35,000 $35,000 - $70,000 $70,000 - $113,804 over $113,804 2004 0% 16% 22% 26% 29% $0 - $7,756 $7,756 - $32,183 $32,183 - $64,368 $64,368 - $104,648 over $104,648 2003 0% 16% 22% 26% 29% $0 - $7,634 $7,634 - $31,677 $31,677 - $63,354 $63,354 - $103,000 over $103,000 2002 0% 16% 22% 26% 29% $0 - $7,412 $7,412 - $30,754 $30,754 - $61,509 $61,509 - $100,000 over $100,000 2001 0% 16% 22% 26% 29% $0 - $7,231 $7,231 - $30,004 $30,004 - $60,009 over $60,009 2000 0% 17% 25% 29% $0 - $6,794 $6,794 - $29,590 $29,590 - $59,180 over $59,180 1999 0% 17% 26% 29% $0 - $6,794 $6,794 - $29,590 $29,590 - $59,180 over $59,180 1998 0% 17% 26% 29% Income not taxed The following types of income are not taxed in Canada (this list is not exhaustive): gifts and inheritances; lottery winnings;   5
  • 6.
    Goods & ServicesTax The federal government's sales tax is a value-added tax. Harmonized Sales Tax The Harmonized Sales Tax (HST) is used in certain provinces to combine the federal Goods and Services Tax (GST) and the Provincial Sales Tax (PST) into a single, blended, sales tax. Currently, there is a 13% HST in the provinces of New Brunswick, Newfoundland, and Nova Scotia. The HST is collected by the Canada Revenue Agency, which then remits the appropriate amounts to the participating provinces. Like the GST, the HST is value-added. Effective July 1, 2010 British Columbia and Ontario will adopt HST replacing their current PST at 12% and 13% respectively. Annual revenue from taxable sales $1.5M or less: report annually More than $1.5M up to $6M: report quarterly More than $6M: report monthly If you wish to change your reporting period, perhaps because your business uses accounting periods that are not monthly or quarterly, you must notify the Canada Revenue Agency. Provincial Sales Taxes Separate Provincial Sales Taxes (PST) are collected in the provinces of British Columbia, Saskatchewan, Manitoba, Ontario, Quebec (called QST for Quebec Sales Tax, in French TVQ, Taxes des Ventes du Québec), and Prince Edward Island. Goods to which the tax is applied varies by province, as does the rate. Moreover, for those provinces whose provincial sales tax is applied to the combined cost and GST, provincial revenues decline or increase with respective changes in the GST. Of the provincial sales taxes, only the QST (and the HST) are value-added; the rest are cascading taxes.   6
  • 7.
    Rate Combined fed. Province Note (%) /prov. rate (%) • food, fuel, children's sized clothes and footwear as well as some other items and service are exempted (see Sales taxes in British Columbia for more detail) British Columbia 7 12 • Alcohol is taxed at 10%. • Passenger vehicles are taxed at between 7% to 10% based on purchase price. • Harmonized Sales Tax takes effect on July 1, 2010. • Alberta has no provincial sales tax. There is a 4% tax Alberta 0 5 on lodging. • Reduced from 7% on 28 October 2006 Saskatchewan 5 10 • There is a separate 10% liquor consumption tax. The non-alcoholic portion of a restaurant meal is not taxed. Manitoba 7 12 • PST is usually 8%, but is 5% on lodging, 10% on entertainment and alcohol at restaurants and 12% on Ontario 8 13 alcohol at retail stores on top of the flat LCBO liquor mark-ups. • Harmonized Sales Tax takes effect on July 1, 2010. • Provincial rate is nominally 7.5%, but also applied to Quebec 7.5 12.875 federal 5% GST. Effectively 7.875% Prince Edward • Provincial rate is nominally 10%, but also applied to 10 15.5 Island federal 5% GST. Effectively 10.5% New Brunswick 13 Nova Scotia 13 • Harmonized Sales Tax includes provincial tax and GST Newfoundland and Labrador 13 GST/HST rates The GST is a tax that applies on most supplies of goods and services made in Canada. The GST also applies to supplies of real property (for example, land, buildings and interests in such property) and intangible property such as trademarks, rights to use a patent, and digitized products downloaded from the Internet and paid for individually. The participating provinces (Nova Scotia, New Brunswick, and Newfoundland and Labrador) harmonized their provincial sales tax with the GST to implement the HST. Generally, the HST applies to the same base of goods and services as the GST. As of July 1, 2010, Ontario harmonized its retail sales tax with the GST to implement the HST and British Columbia harmonized its provincial sales tax with the GST to implement the HST. Also, as of July 1, 2010, Nova Scotia increased its HST rate from 13% to 15%. For information see Nova Scotia HST rate increase.   7
  • 8.
    In Quebec, RevenueQuébec administers the GST/HST. If your business is located in Quebec, visit the Revenu Québec Web site. The HST breakdown: • The HST rate of 12% includes the 5% federal part and 7% provincial part. • The HST rate of 13% includes the 5% federal part and 8% provincial part. • The HST rate of 15%* includes the 5% federal part and 10% provincial part. (As of July 1, 2010) • The HST rate of 14% includes the 6% federal part and 8% provincial part. The HST rate of 15% includes the 7% federal part and 8% provincial part. GST/HST Rates On or after Before On or after January 1, January 1, Before On or after April 1, 1997, Provincial 2008, and 2008, and April 1, July 1, 2010 and before before July after June 30, 1997 July 1, 2006 1, 2010 2006 Alberta 5% 5% 6% 7% 7% British Columbia 12% 5% 6% 7% 7% Manitoba 5% 5% 6% 7% 7% New Brunswick 13% 13% 14% 15% 7% Newfoundland and Labrador 13% 13% 14% 15% 7% Northwest Territories 5% 5% 6% 7% 7% Nova Scotia 15%* 13% 14% 15% 7% Nunavut 5% 5% 6% 7% 7% Ontario 13% 5% 6% 7% 7% Prince Edward Island 5% 5% 6% 7% 7% Saskatchewan 5% 5% 6% 7% 7% Yukon 5% 5% 6% 7% 7%   8
  • 9.
    Non-Refundable Tax CreditBlocks BC / 2000-2012 Base Amount Credit Subject to 2000 2001 2002 2003 2004 2005 2006 2007 2008 2009 2010 2011 2012 Indexing Personal Credits Basic Personal Amount $7,231 $8,000 $8,168 $8,307 $8,523 $8,676 $8,858 $9,027 $9,189 $9,373 $11,000 $11,088 $11,355 yes Spousal $6,140 $6,850 $6,994 $7,113 $7,298 $7,429 $7,585 $7,729 $7,868 $8,026 $9,653 $9,730 $9,964 yes Reduced when spousal income exceeds ($614) ($685) ($699) ($711) ($730) ($743) ($759) ($773) ($787) ($803) ($965) $ (973) ($996) Eligible Dependant $6,140 $6,850 $6,994 $7,113 $7,298 $7,429 $7,585 $7,729 $7,868 $8,026 $9,653 $9,730 $9,964 yes Reduced when dependant income exceeds ($614) ($685) ($699) ($711) ($730) ($743) ($759) ($773) ($787) ($803) ($965) $(973) ($996) Infirm Dependant Credit $2,386 $2,424 $3,574 $3,635 $3,730 $3,797 $3,876 $3,949 $4,021 $4,101 $4,118 $4,151 $4,250 yes Reduced when dependant income exceeds ($11,661) ($5,576) ($5,693) ($5,790) ($5,940) ($6,047) ($6,174) ($6,292) ($6,405) ($6,533) ($6,559) $(6,611) ($6,770) In-home care of relative $2,386 $2,424 $3,574 $3,634 $3,730 $3,796 $3,877 $3,949 $4,021 $4,101 $4,118 $4,150 $4,250 yes Reduced when relative's income exceeds ($4,845) ($11,848) ($12,096) ($12,302) ($12,621) ($12,849) ($13,118) ($13,368) ($13,608) ($13,881) ($13,936) ($14,048) ($12,385) Age (65 or older by end of taxation year) $3,531 $3,587 $3,663 $3,725 $3,822 $3,891 $3,972 $4,048 $4,121 $4,203 $4,220 $4,254 $4.250 yes Reduced when income exceeds ($26,284) ($26,705) ($27,265) ($27,729) ($28,450) ($28,962) ($29,570) ($30,132) ($30,674) $(31,664) ($32,424 Pension Credit $1,000 $1,000 $1,000 $1,000 $1,000 $1,000 $1,000 $1,000 $1,000 $1,000 $1,000 $1,000 $1,000 no Adoption Expense Credit Based on actual adoption expenses to a maximum of '1' - - - - - - - Actual Actual Actual Actual Actual Actual no (based on federal indexed maximum amount) Charitable and other gifts Actual Actual Actual Actual Actual Actual Actual Actual Actual Actual Actual Actual Actual no Lowest tax rate on first $200; highest tax rate on excess Medical Expense Credit Actual Actual Actual Actual Actual Actual Actual Actual Actual Actual Actual Actual Actual yes Reduced by lesser of '2' or 3% of net income Credit for Mental or Physical Impairment $4,293 $4,362 $6,126 $6,230 $6,392 $6,507 $6,644 $6,770 $6,892 $7,030 $7,058 $7,114 $7,285 yes Credit for Mental or Physical Impairment for child $2,941 $2,988 $3,574 $3,635 $3,729 $3,796 $3,876 $3,950 $4,021 $4,101 $4,118 $4,151 $4,250 yes under 18 Reduced by attendant care and child care expenses in $2,000 $2,032 $2,075 $2,110 $2,165 $2,204 $2,250 $2,293 $2,334 $2,381 $2,391 $2,410 $2,468 excess of '3' claimed in respect of the impaired child Tuition Credit Actual Actual Actual Actual Actual Actual Actual Actual Actual Actual Actual Actual Actual no Education Full-time student $200/month $200/month $200/month $200/month $200/month $200/month $200/month $200/month $200/month $200/month $200/month $200 $200 Part-time student $60/month $60/month $60/month $60/month $60/month $60/month $60/month $60/month $60/month $60/month $60/month $60 $60 no Student Loan Interest Actual Actual Actual Actual Actual Actual Actual Actual Actual Actual Actual Actual Actual no EI and CPP Credit Actual Actual Actual Actual Actual Actual Actual Actual Actual Actual Actual Actual Actual no 2000 2001 2002 2003 2004 2005 2006 2007 2008 2009 2010 2011 2012 1 - - - - - - - $10,445 $10,643 $10,909 $10,975 $11,128 11,440 2 $1,637 $1,633 $1,698 $1,727 $1,772 $1,804 $1,842 $1,877 $1,911 $1,949 $1,957 $1,972 $2,020 3 $2,000 $2,032 $2,075 $2,110 $2,165 $2,204 $2,250 $2,293 $2,334 $2,381 $2,391 $2,410 $2,468     9
  • 10.
    Tax Credits -Low Income Climate Action Tax Credit Effective July 2008, individuals may be eligible for the B.C. refundable Low Income Climate Action Tax Credit. You are eligible for the Low Income Climate Action Tax Credit if you are a resident of British Columbia, and • you are 19 years of age or older or • you have a spouse or common-law partner or • you are a parent who resides with your child For payments commencing in 2008 the maximum credit is $100 for yourself, $100 for your spouse or common-law partner and $30 for each qualified dependant. If you are a single parent the maximum credit is $100 for yourself, $100 for your first child and $30 for each additional child. For payments starting in July 2009 and July 2010 the maximum credits are increased to $105 and $31.50. For payments starting July 2011 the maximum credits are increased to $115.50 and $34.50 The Low Income Climate Action Tax Credit is reduced by 2% of net family income over the income threshold. The income thresholds are indexed to the Consumer Price Index for British Columbia. Tax Year Net Income Threshold Net Income Threshold Married or Payment Dates Single Single Parent 2012 For July 2011 to June 2012 $30,968 $36,130 2011 For July 2010 to June 2011 $30,722 $35,843 2010 For July 2009 to June 2010 $30,600 $35,700 2009 For July 2008 to June 2009 $30,000 $35,000 Claiming the Credit The tax credit will be paid quarterly together with the federal Goods and Services Tax Credit in July, October, January and April. You cannot claim this credit if you were confined to a prison or similar institution for a period of at least 90 days that includes the first day of that quarter.   10
  • 11.
    Comparison indexation adjustmentfor personal income tax and benefit amounts Each year, certain personal income tax and benefit amounts are indexed to inflation using the Consumer Price Index data as reported by Statistics Canada. Increases to tax bracket thresholds, amounts relating to non-refundable credits, and most other amounts will take effect on January 1, 2010. However, increases to the Canada Child Tax Benefit (including the National Child Benefit Supplement and the Child Disability Benefit) and the goods and services tax credit will take effect on July 1, 2010, to coincide with the beginning of the program year for payment of these benefits. The following chart compares the indexed amounts for the 2009-2012 tax years. It reflects an indexation increase of 0.6% for 2010. Year 2012 ($) 2011 ($) 2010 ($) 2009 ($) Tax bracket thresholds Taxable income above which the 22% bracket begins 42,707 41,544 40,970 40,726 Taxable income above which the 26% bracket begins 85,414 83,088 81,941 81,452 Taxable income above which the 29% bracket begins 132,406 128,800 127,021 126,264 Amounts relating to non-refundable tax credits Basic personal amount 10,882 10,527 10,382 10,320 Age amount 6,720 6,537 6,446 6,408 Net income threshold 33,884 32,961 32,506 32,312 Spouse or common-law partner amount (max.) 10,822 10,527 10,382 10,320 Amount for an eligible dependant (max.) 12,822 10,527 10,382 10,320 Amount for children under age 18 (max. per child) 2,191 2,131 2,101 2,089 Canada employment amount (max.) 1,095 1,065 1,051 1,044 Infirm dependant amount (max. per dependant) 6,402 4,282 4,223 4,198 Net income threshold 6,420 6,076 5,992 5,956 Caregiver amount (max. per dependant) 4,402 4,282 4,223 4,198 Net income threshold 15,033 14,624 14,422 14,336 Disability amount 7,546 7,341 7,239 7,196 Supplement for children with disabilities (max.) 4,402 4,282 4,223 4,198 Threshold relating to allowable child care and attendant care expenses 2,578 2,508 2,473 2,459 Adoption expenses (max. per adoption) 11,440 11,128 10,975 10,909 Medical expense tax credit—3% of net income ceiling 2,109 2,052 2,024 2,011 Refundable medical expense supplement Maximum supplement 1,119 1,089 1,074 1,067 Minimum earnings threshold 3,268 3,179 3,135 3,116 Family net income threshold 24,783 24,108 23,775 23,633 Old Age Security repayment threshold 69,562 67,668 66,733 66,335 Certain board and lodging allowances paid to players on sports teams or members of recreation programs Income exclusion (max. per month) 329 320 315 313   11
  • 12.
    Year 2012 ($) 2011 ($) 2010 ($) 2009 ($) Tradesperson’s tools deduction Threshold amount relating to cost of eligible tools 1,095 1,065 1,051 1,044 Goods and services tax credit Adult maximum 260 253 250 248 Child maximum 137 133 131 130 Single supplement 137 133 131 130 Phase-in threshold for the single supplement 8,439 8,209 8,096 8,047 Family net income at which credit begins to phase out 33,884 32,961 32,506 32,312 Canada Child Tax Benefit Base benefit 1,405 1,367 1,348 1,340 Additional benefit for third child 98 95 94 93 Family net income at which base benefit begins to phase out 42,707 41,544 40,970 40,726 National Child Benefit (NCB) supplement First child 2,177 2,118 2,088 2,076 Second child 1,926 1,873 1,848 1,837 Third child 1,832 1,782 1,758 1,747 Family net income at which NCB supplement begins to phase out 24,863 24,183 23,855 23,710 Family net income at which NCB supplement phase-out is complete 42,707 41,544 40,970 40,726 Canada Disability Benefit (CDB) Maximum benefit 2,575 2,504 2,470 2,455 Family net income at which CDB supplement begins to phase out 42,707 41,544 40,970 40,726 Children’s Special Allowances (CSA) CSA Base Amount 3,582 3,485 3,436 3,416   12
  • 13.
    Indexation adjustment forpersonal income tax and benefit amounts / 2005-2012  2005 2006 2007 2008 2009 2010 2011 2012 ($) ($) ($) ($) ($) ($) ($) ($) Taxable income above which the 22% bracket begins 35,595 36,378 37,178 37,885 40,726 40,970 41,544 42,707 Taxable income above which the 26% bracket begins 71,190 72,756 74,357 75,769 81,452 81,941 83,088 85,414 Taxable income above which the 29% bracket begins 115,739 118,285 120,887 123,184 126,264 127,021 128,800 132,406 Amounts relating to non-refundable tax credit Basic personal amount 8,648 9,039 9,600 9,600 10,320 10,382 10,527 10,822 Age amount 3,979 4,066 5,177 5,276 6,408 6,446 6,537 6,720 Net income threshold 29,619 30,270 30,936 31,524 32,312 32,506 32,961 33,884 Spouse or common-law partner amount (max.) 7,344 7,675 9,600 9,600 10,320 10,382 10,527 10,822 Amount for an eligible dependant (max.) - 7,505 9,600 9,600 10,320 10,382 10,527 12,822 Amount for children under age 18 (max. per child) - - 2,000 2,038 2,089 2,101 2,131 2,191 Canada employment amount (max.) - - 1,000 1,019 1,044 1,051 1,065 1,095 Infirm dependant amount (max. per dependant) 3,848 3,933 4,019 4,095 4,198 4,223 4,282 6,402 Net income threshold 5,460 5,580 5,702 5,811 5,956 5,992 6,076 6,420 Caregiver amount (max. per dependant) 3,848 3,933 4,019 4,095 4,198 4,223 4,282 4,402 Net income threshold 13,141 13,430 13,726 13,986 14,336 14,422 14,624 15,033 Disability amount 6,596 6,741 6,890 7,021 7,196 7,239 7,341 7,546 Supplement for children with disabilities (max.) 3,848 3,933 4,019 4,095 4,198 4,223 4,282 4,402 Threshold relating to allowable child care and attendant care expenses 2,254 2,303 2,354 2,399 2,459 2,473 2,508 2,578 Adoption expenses (max. per adoption) 10,000 10,220 10,445 10,643 10,909 10,975 11,128 11,440 Medical expense tax credit—3% of net income ceiling 1,844 1,884 1,926 1,962 2,011 2,024 2,052 2,109 Certain board & loading Maximum supplement 750 1,000 1,022 1,041 1,067 1,074 1,089 1,119 Minimum earnings threshold 2,857 2,919 2,984 3,040 3,116 3,135 3,179 3,268 Family net income threshold 21,663 22,140 22,627 23,057 23,633 23,775 24,108 24,783 Old Age Security repayment threshold 60,806 62,144 63,511 64,718 66,335 66,733 67,668 69,562 Income exclusion (max. per month) - - - - 313 315 320 329 Threshold amount relating to cost of eligible tools - - - - 1,044 1,051 1,065 1,095 Adult maximum 227 232 237 242 248 250 253 260 Child maximum 120 122 125 127 130 131 133 137 Single supplement 120 122 125 127 130 131 133 137 Phase-in threshold for the single supplement 7,377 7,539 7,705 7,851 8,047 8,096 8,209 8,439 Family net income at which credit begins to phase out 29,618 30,270 30,936 31,524 32,312 32,506 32,961 33,884 Base benefit 1,228 1,255 1,283 1,307 1,340 1,348 1,367 405 Additional benefit for third child 86 88 90 91 93 94 95 98 243 249 - - - - - - Additional benefit for children under 7 years Family net income at which base benefit begins to phase out 35,595 36,378 37,178 37,885 40,726 40,970 41,544 42,707 First child 1,722 1,945 1,988 2,025 2,076 2,088 2,118 2,177 Second child 1,502 1,720 1,758 1,792 1,837 1,848 1,873 1,926 Third child 1,420 1,637 1,673 1,704 1,747 1,758 1,782 1,832 Family net income at which NCB supplement begins to phase out - - 20,883 21,287 23,710 23,855 24,183 24,863 Family net income at which NCB supplement phase-out is complete 35,595 36,378 37,178 37,885 40,726 40,970 41,544 42,707 Maximum benefit 2,000 2,300 2,351 2,395 2,455 2,470 2,504 2,575 Family net income at which CDB supplement begins to phase out 35,595 36,378 37,178 37,885 40,726 40,970 41,544 42,707 CSA Base Amount - - 3,271 3,332 3,416 3,436 3,485 3,582   13
  • 14.
    Canadian Pension Plan(CPP) Since January 1, 2012, you may have to deduct CPP contributions from the pensionable earnings you pay an employee who is 60 to 70 years of age, even if the employee is receiving a CPP or QPP retirement pension. Under the new rules, an employee who works and receives a CPP or QPP retirement pension now has to contribute to the CPP if he or she is: • 60 to 65 years of age; • 65 to 70 years of age, unless the employee has filed an election with you or another employer to stop paying CPP contributions (the election will take effect on the first day of the month following the month the employee provides you with a completed and signed election form); • 65 to 70 years of age, if the employee revoked his or her election to stop paying CPP contributions in 2013 or later. Notes These legislative amendments do not affect the salary or wages of an employee who is considered to be disabled under the CPP or QPP, nor do they affect the salary and wages of a person who has reached 70 years of age. Do not deduct CPP contributions from the salary and wages that you pay these employees. Employees working in Quebec and other workers not subject to the CPP are not affected by these changes. You have to deduct CPP contributions from an employee who is employed in pensionable employment and is receiving pensionable earnings, and meets one of these conditions: • Who is currently receiving a CPP or QPP retirement pension and is 60 to 65 years of age, even if it means deducting from someone who was not contributing in a previous year because he or she was receiving a CPP/QPP retirement pension; OR • Who is currently receiving a CPP or QPP retirement pension and is 65 to 70 years of age, and who has not given you a copy of a signed and completed Form CPT30, Election to Stop Contributing to the Canada Pension Plan, or Revocation of a Prior Election. Note The CRA can assess you for failing to deduct CPP contributions or for failing to remit the CPP contributions to the CRA as required. The assessment may also include penalty and interest charges. For more information, go to Penalties, interest, and other consequences.   14
  • 15.
    Canada Pension PlanPayment Rates Average benefit Maximum monthly Type of benefit (September benefit (2011) 2010) Disability benefit $810.46 $1,153.37 Retirement pension (at age 65) $504.50 $960.00 Survivors benefit (under age 65) $364.85 $529.09 Survivors benefit (age 65 and over) $297.72 $576.00 Children of disabled contributors benefit $214.85 $218.50 Children of deceased contributors benefit $214.85 $218.50 Combined survivors & retirement benefit (pension at age 65) $682.21 $960.00 Combined survivors & disability benefit $940.78 $1,153.37 Maximum Death benefit one-time payment $2,252.93 $2,500.00 EI premium rates and maximums Year Max. Annual Insurable Rate (%) Max. Annual Employee Max. Annual Employer Earnings Premium Premium Federal Quebec Federal Quebec Federal Quebec 2012 $45,900 1.83 1.47 $839.97 $674.96 $1,176.96 $944.62 2011 $44,200 1.78 1.41 $786.76 $623.22 $1,101.46 $872.51 2010 $43,200 1.73 1.36 $747.36 $587.52 $1,046.30 $822.53 2009 $42,300 1.73 1.38 $731.79 $583.74 $1,024.51 $817.24 2008 $41,100 1.73 1.39 $711.03 $571.29 $995.44 $799.81 2007 $40,000 1.80 1.46 $720.00 $584.00 $1,008.00 $817.60 2006 $39,000 1.87 1.53 $729.30 $596.70 $1,021.02 $835.38 2005 $39,000 1.95 N/A $760.50 N/A $1,064.70 N/A 2004 $39,000 1.98 N/A $772.20 N/A $1,081.08 N/A 2003 $39,000 2.10 N/A $819.00 N/A $1,146.60 N/A 2002 $39,000 2.20 N/A $858.00 N/A $1,201.20 N/A 2001 $39,000 2.25 N/A $877.50 N/A $1,228.50 N/A 2000 $39,000 2.40 N/A $936.00 N/A $1,310.49 N/A 1999 $39,000 2.55 N/A $994.50 N/A $1,392.30 N/A 1998 $39,000 2.70 N/A $1,053.00 N/A $1,474.20 N/A 1997 $39,000 2.90 N/A $1,131.00 N/A $1,583.40 N/A Important Note Quebec offers its own parental benefits. For more information, visit the Revenu Québec site.   15
  • 16.
    CPP contribution rates,maximums and exemptions 1997-2012 Year Max. Annual Pensionable Basic Maximum Contributory Employee Contribution Max. Annual Employee Max. Annual Self - Earnings Exemption Earnings Rate (%) Contribution Employed Contribution 2012 $50,100 $3,500 $46,600 4.95 $2,306.70 $4,613.40 2011 $48,300 $3,500 $44,800 4.95 $2,217.60 $4,435.20 2010 $47,200 $3,500 $43,700 4.95 $2,163.15 $4,326.30 2009 $46,300 $3,500 $42,800 4.95 $2,118.60 $4,237.20 2008 $44,900 $3,500 $41,400 4.95 $2,049.30 $4,098.60 2007 $43,700 $3,500 $40,200 4.95 $1,989.90 $3,979.80 2006 $42,100 $3,500 $38,600 4.95 $1,910.70 $3,821.40 2005 $41,100 $3,500 $37,600 4.95 $1,861.20 $3,722.40 2004 $40,500 $3,500 $37,000 4.95 $1,831.50 $3,663.00 2003 $39,900 $3,500 $36,400 4.95 $1,801.80 $3,603.60 2002 $39,100 $3,500 $35,600 4.70 $1,673.20 $3,346.40 2001 $38,300 $3,500 $34,800 4.30 $1,496.40 $2,992.80 2000 $37,600 $3,500 $34,100 3.90 $1,329.90 $2,373.00 1999 $37,400 $3,500 $33,900 3.50 $1,186.50 $2,373.00 1998 $36,900 $3,500 $33,400 3.20 $1,068.80 $2,137.60 1997 $35,800 $3,500 $32,300 2.925* $944.78 $1,889.55   16
  • 17.
    Basic exemption chart Employee'sCPP basic exemption for various 2012 pay periods. Basic Pay period exemption Annually (1) $3,500.00 Semi-annually (2) $1,750.00 Quarterly (4) $875.00 Monthly (12) $291.66 Semi-monthly (24) $145.83 Bi-weekly (26) $134.61 Bi-weekly (27) $129.62 Weekly (52) $67.30 Weekly (53) $66.03 22 pay periods $159.09 13 pay periods $269.23 10 pay periods $350.00 Daily (240) $14.58 Hourly (2000) $1.75 * For 1997, the CPP rate was adjusted to 3.0% with a payment on filing the T1 tax return max.   17
  • 18.
    EI premium rateand maximum Each year, CRA provide the maximum insurable earnings and rate for employer to calculate the amount of EI to deduct from your employees. Employer has to deduct EI premiums from insurable earnings their pay to their employees. In addition, employer must pay 1.4 times the amount of the employee's premiums. Employer may qualify to reduce your 1.4 times employer contribution if employer provides their employees a short-term disability plan. Example EI premiums you deducted from your employees for the month $195.50 Your share of EI ($195.50 × 1.4 ) $273.70 Total amount you remit for EI premiums $469.20 You stop deducting EI premiums when you reach the employee's maximum insurable earnings ($45,900 for 2012) or the maximum employee premium for the year ($839.97 for 2012). The maximum for Quebec is $647.73 for 2012. Note The annual maximum insurable earnings ($45,900 for 2012) applies to each job the employee holds with different employers (different business numbers). If an employee leaves one employer during the year to start work with another employer, the new employer also has to deduct EI premiums without taking into account what was paid by the previous employer. This is the case even if the employee has paid the maximum premium amount during the previous employment. CRA will credit or refund any overpayments to employees when they file their income tax and benefit return. There is no provision that provides a credit or refund to the employer in such circumstances. Note Different EI rates apply for employees working in Quebec as a result of the establishment of the Quebec Parental Insurance Plan (QPIP). Old Age Security (OAS) Payment Rates- January - March 2011 The following chart shows the maximum and average monthly rates for Old Age Security (OAS), Guaranteed Income Supplement and the Allowance, as well as the maximum annual income to be eligible for these benefits. For detailed monthly rates, please refer to the Tables of Rates for Old Age Security, Guaranteed Income Supplement and the Allowance. Old Age Security benefit rates are reviewed in January, April, July and October to reflect increases in the cost of living as measured by the Consumer Price Index.   18
  • 19.
    The term "spouse"includes a common-law partner. Pensioners are not eligible for benefits if their income, or the combined income of them and their spouse, is more than the maximum income shown on the chart. Canada Pension Plan - Payment Rates Jan - Dec 2012 Canada Pension Plan (CPP) rates are adjusted every January if there are increases in the cost of living as measured by the Consumer Price Index (CPI). The table below lists the maximum and average monthly rates for CPP benefits, except for the death benefit which is a one-time payment. Canada Pension Plan Payment Rates Average benefit Maximum amount Type of benefit (October 2011) (2012) Retirement (at age 65) $512.64 $986.67 Disability $820.96 $1,185.50 Survivor – younger than 65 $383.56 $543.82 Survivor – 65 and older $301.15 $592.00 Children of disabled contributors $218.50 $224.62 Children of deceased contributors $218.50 $224.62 Death (maximum one-time payment) $2,276.62 $2,500.00 Combined benefits Survivor/retirement (retirement at 65) $701.46 $986.67 Survivor/disability $949.22 $1,185.50 Meal and vehicle rates used to calculate travel expenses for 2012 Meal expenses If you choose the detailed method to calculate meal expenses, you must keep your receipts and claim the actual amount that you spent. If you choose the simplified method, you may claim a flat rate of $17/meal, to a maximum of $51/day (Canadian or US funds) per person. Although you do not need to keep detailed receipts for actual expenses if you choose to use this method, we may still ask you to provide some documentation to support your claim.   19
  • 20.
    Meal expenses Priortable of simplified method 2001-2012 Year $ Meal per person $ Maximum Per day 2012 17 51 2011 17 51 2010 17 51 2009 17 51 2008 17 51 2007 11 33 2006 15 45 2005 15 45 2004 15 45 2003 15 45 2002 11 33 2001 17 51 Vehicle expenses If you choose the detailed method to calculate vehicle expenses, you must keep all receipts and records for the vehicle expenses you incurred for moving expenses or for northern residents deductions during the tax year; or during the 12-month period you choose for medical expenses. Vehicle expenses include: • Operating expenses such as fuel, oil, tires, licence fees, insurance, maintenance, and repairs. • Ownership expenses such as depreciation, provincial tax, and finance charges. You also have to keep track of the number of kilometers you drove in that time period, as well as the number of kilometers you drove specifically for the purpose of moving or medical expenses, or for the northern residents deductions. Your claim for vehicle expenses is the percentage of your total vehicle expenses that relate to the kilometers driven for moving or medical expenses, or for northern residents deductions. For example, if you drove 10,000 km during the year, and half of that was related to your move, you can claim half of the total vehicle expenses on your tax return. Although you do not need to keep detailed receipts for actual expenses if you choose to use the simplified method, we may still ask you to provide some documentation to support your claim. You must keep track of the number of kilometers driven during the tax year for your trips relating to northern residents deductions and moving expenses, or the 12-month period you choose for medical expenses. To determine the amount you can claim for vehicle expenses, multiply the number of kilometers by the cents/km rate from the chart below for the province or territory in which the travel begins.   20
  • 21.
    Motor vehicle leasingcosts - employees You can deduct amounts you paid to lease a motor vehicle you used to earn employment income. Include the leasing costs you paid when you calculate your allowable motor vehicle expenses. If you use a passenger vehicle to earn employment income, there is a limit on the amount of the leasing costs you can deduct. If you leased a passenger vehicle before January 1, 2001, you will need to refer to the applicable chart in the 2008 version of the Guide T4044, Employment expenses to assist you in calculating the eligible leasing costs. You can use the Chart, Eligible leasing costs for passenger vehicles leased after December 31, 2000 to calculate your eligible leasing costs for a passenger vehicle leased after 2000 as follow: Chart - Eligible leasing costs for passenger vehicles leased after December 31, 2000 1. Enter the total lease charges paid for the vehicle in 2011 $________ 2. Enter the total lease payments deducted for the vehicle before 2011 $________ 3. Enter the total number of days the vehicle was leased in 2011 and previous years $________ 4. Enter the manufacturer's list price $________ 5. $35,294 + GST and PST, or HST on $35,294 $________ 6. Enter the amount from line 4 or line 5, whichever is $______ × more 85% $________ 7. ($800 + GST and PST, or HST on $______ ÷ 30 $______ − $800) × line 3 = = line 2 $________ 8. ($30,000 + GST and PST, or HST $______ ÷ on $30,000) × line 1 = line 6 $________ Your eligible leasing cost is the lower of the amounts on line 7 and line 8.   21
  • 22.
    Comparison table ofVehicle expenses 2001-2012 Province or territory 2012 2011 2010 2009 2008 2007 2006 2005 2004 2003 2002 2001 Alberta 53 53 51.5 51.5 53 48 47.5 45.5 43.5 41.5 39.5 39.5 British Columbia 52 52 52 52 54 48 47.5 45.5 43 41.5 42 42 Manitoba 49 49 47.5 49 50.5 46.5 45.5 44 40.5 40.5 41.5 41 New Brunswick 52 52 49.5 50 52 47 47.5 45.5 43.5 44 41.5 42 Newfoundland and Labrador 55 55 53 53.5 55.5 50.5 50.5 49 47.5 45 43.5 43.5 Northwest Territories 61.5 61.5 58 58 64 56.5 54.5 52.5 49 48.5 48.5 47 Nova Scotia 53 53 51 50 52.5 48 47.5 46 44 44 41.5 42 Nunavut 61.5 61.5 58 58 64 56.5 54.5 52.5 49 48.5 48.5 47 Ontario 57 57 55 54 55.5 49.5 48.5 47 45.5 43.5 43.5 42.5 Prince Edward Island 52 52 50 50 52.5 47 47.5 45.5 44 42 40.5 41 Quebec 59 59 56.5 57 58 52.5 51.5 50 47.5 46 45 46 Saskatchewan 47.5 47.5 46 47.5 49.5 46 44.5 43 40 39 40 38.5 Yukon 63.5 63.5 60.5 61 66 58 57 55 50.5 48.5 48 48.5 Example In 2011, you provided your employee with an automobile. She drove 30,000 kilometres during the year, with 10,000 kilometres for personal use. You paid $3,000 in costs associated with maintenance, licenses, and insurance. Calculate the part of the operating expenses that relates to her personal use of the automobile as follows: 10,000 km ÷ 30,000 km × $3,000 = $1,000 If she reimbursed you for the total amount of $1,000 in the year or no later than 45 days after the end of the year, you do not have to calculate an operating expense benefit for her. However, if she reimbursed you for only $800 of the expenses you paid in the year or no later than 45 days after the end of the year, the operating expense benefit is $1,600, calculated as follows: 10,000 km × 24¢ = $2,400 $2,400 - $800 = $1,600 Flat-rate allowance If you pay your employee an allowance based on a flat rate that is not related to the number of kilometers driven, it is a taxable benefit and has to be included in the employee's income. Combination of flat-rate and reasonable per-kilometre allowances If you pay your employee an allowance that is a combination of flat-rate and reasonable per-kilometre allowances that cover the same use for the vehicle, the total combined allowance is a taxable benefit and has to be included in the employee's income. Example 1 You pay an allowance to your employee as follows:   22
  • 23.
    a flat per-diem rate to offset the employee's fixed expenses for each day the vehicle is required; and • A reasonable per-kilometer rate for each kilometre driven to offset the operating expenses. The flat per-diem rate compensates the employee for some of the “same use” on which the reasonable per-kilometre allowance is based, that is, the fixed expenses incurred by the employee to operate the vehicle. The combined amount is considered one allowance and therefore taxable, since it is not based solely on the number of kilometres the vehicle is used for employment purposes. Example 2 You pay an allowance to your employee as follows: • a flat-rate per month for travel inside the employment district; and • a reasonable per-kilometre rate for employment-related travel outside the employment district. Since the flat-rate allowance does not cover any of the same use of the vehicle on which the reasonable per-kilometre allowance is based, the allowances are considered separately. The reasonable per-kilometer allowance paid for travel outside the district is not included in income. The amount based on a flat-rate paid for travel inside the district is taxable, since it is not based solely on the number of kilometres for which the vehicle is used in connection with the employment. Only the total of the monthly flat-rate allowance has to be reported in box 14, “Employment income”, and in the “Other information” area under code 40 at the bottom of the employee's T4 slip. Example of calculating the taxable benefit Farzaneh is your employee. He borrowed $150,000 from you at the beginning of the year. The prescribed rate of interest for the loan is 3% for the first quarter, 4% for the second and third quarters, and 5% for the fourth quarter. Farzaneh paid you $2,000 interest on the loan no later than 30 days after the end of the year. During the year, a company related to you paid $1,000 interest on the loan for Farzaneh. Before the end of the same year, Farzaneh repaid the $1,000 to the company.   23
  • 24.
    Calculate the benefitto include in his income as follows: 1) Prescribed rate × loan amount for the year: 3% × $150,000 × 1/4 = $1,125 4% × $150,000 × 2/4 = $3,000 5% × $150,000 × 1/4 = $1,875 $6,000 Plus 2) Amount paid by a third party 1,000 $7,000 Minus 3) Interest paid ($2,000 + $1,000) = ($3,000) 4) Amount Joshua repaid (1,000) (4,000) Farzaneh's taxable benefit $3,000 Prescribed Interest Rates for Leasing Rules Year 2002 2003 2004 2005 2006 2007 2008 2009 2010 2011 2012 January 6.66 6.55 6.24 5.87 5.20 5.03 5.22 5.00 4.84 4.60 3.61 February 6.75 6.37 6.14 5.86 5.04 5.11 5.18 4.45 5.08 4.51 3.42 March 6.72 6.45 6.15 5.69 5.22 5.23 5.17 4.74 4.92 4.71 April 6.68 6.39 5.98 5.71 5.17 5.10 5.14 4.70 4.98 4.69 May 7.00 6.52 5.94 5.75 5.26 5.21 4.91 4.63 4.99 4.66 June 6.89 6.34 6.23 5.55 5.59 5.21 5.02 4.72 4.99 4.67 July 6.76 6.01 6.23 5.41 5.51 5.43 5.07 5.11 4.58 4.41 August 6.73 5.98 6.30 5.27 5.69 5.59 5.07 4.96 4.59 4.47 September 6.70 6.35 6.29 5.31 5.46 5.52 5.18 5.10 4.71 4.28 October 6.55 6.40 6.14 5.11 5.22 5.44 5.02 4.96 4.39 4.00 November 6.38 6.19 6.02 5.21 5.08 5.50 5.14 4.87 4.25 3.74 December 6.61 6.33 5.96 5.38 5.25 5.39 5.31 4.98 4.38 3.91   24
  • 25.
    Comparison Federal PersonalIncome Tax Rates 2011 Marginal Tax Rates 2012 Marginal Tax Rates Canadian Dividends Canadian Dividends 2012 Taxable Income Other Capital 2011 Taxable Income Other Capital Income Gains Eligible Non-Eligible Income Gains Eligible Non-Eligible Dividends Dividends Dividends Dividends first $42,707 15.00% 7.50% -2.02% 2.08% first $41,544 15.00% 7.50% -3.03% 2.08% over $42,707 up to $85,414 22.00% 11.00% 7.85% 10.83% over $41,544 up to $83,088 22.00% 11.00% 9.63% 10.83% over $85,414 up to $132,406 26.00% 13.00% 13.49% 15.83% over $83,088 up to $128,800 26.00% 13.00% 15.15% 15.83% over $132,406 29.00% 14.50% 17.72% 19.58% over $128,800 29.00% 14.50% 19.29% 19.58% Marginal tax rate for dividends is a % of actual dividends received (not grossed-up amount). Federal Basic Personal Amount 2012 Tax Rate 2011 Tax Rate $10,822 15.00% $10,527 15.00% Comparison Federal Personal Income Tax Rates 2010 Marginal Tax Rates 2009 Marginal Tax Rates Canadian Dividends Canadian Dividends 2010 Taxable Income 2009 Taxable Income Other Capital Other Capital Income Gains Income Gains Small Small Eligible Eligible Business Business Dividends Dividends Dividends Dividends first $40,970 15.00% 7.50% -4.28% 2.08% first $40,726 15.00% 7.50% -5.75% 2.08% over $40,970 up to $81,941 22.00% 11.00% 5.80% 10.83% over $40,726 up to $81,452 22.00% 11.00% 4.40% 10.83% over $81,941 up to $127,021 26.00% 13.00% 11.56% 15.83% over $81,452 up to $126,264 26.00% 13.00% 10.20% 15.83% over $127,021 29.00% 14.50% 15.88% 19.58% over $126,264 29.00% 14.50% 14.55% 19.58% Marginal tax rate for dividends is a % of actual dividends received (not grossed-up amount). Federal Basic Personal Amount 2010 Tax Rate 2009 Tax Rate $10,382 15.00% $10,320 15.00% Source: www. taxtip.ca 25   
  • 26.
    Canada Pension Plan(CPP) and Québec Pension Plan (QPP) contribution rates Year 2012 2011 2010 2009 2008 2007 2006 2005 2004 maximum pensionable earnings $50,100 $48,300 $47,200 $46,300 $44,900 $43,700 $42,100 $41,100 $40,500 basic exemption $3,500 $3,500 $3,500 $3,500 $3,500 $3,500 $3,500 $3,500 $3,500 rate %4.95 4.95% 4.95% 4.95% 4.95% 4.95% 4.95% 4.95% 4.95% employee/employer maximum $2,306.70 $2,217.60 $2,163.15 $2,118.60 $2,049.30 $1,989.90 $1,910.70 $1,861.20 $1,831.50 self-employed maximum $4,613.40 $4,435.20 $4,326.30 $4,237.20 $4,098.60 $3,979.80 $3,821.40 $3,722.40 $3,663.00 Source: www. taxtip.ca Canada Revenue Agency (CRA) information: T4032 Payroll Deduction Tables - for calculating payroll deductions CPP contribution rates, maximums and exemptions for rates from earlier years. Online payroll calculator, which employers can use for calculating payroll deductions, and employees can use to check their payroll deductions. Revenue Québec information: Source deductions of Québec income tax - for calculating payroll deductions TP-1015.G-V - Guide for Employers: Source Deductions and Contributions Federal & Provincial/Territorial enhanced dividend tax credit rates 2007 to 2012 Enhanced Dividend Tax Credit Rates as a % of Grossed-up Taxable Dividends Year Gross up Federal AB BC MB NB NL NS NT NU ON PE QC SK YT 2012 38% 15.02% 10% 9.76% 11% 10.65% 8.65% 7.85% 10.20% 5.51% 6.4% 9.32% 11.9% 11% 9.76% 2011 41% 16.44% 10% 10.31% 11% 11.24% 9.14% 8.29% 10.78% 5.82% 6.4% 9.84% 11.9% 11% 10.31% 2010 44% 17.97% 10% 10.83% 11% 11.82% 9.60% 8.71% 11.32% 6.11% 6.4% 10.34% 11.9% 11% 10.83% 2009 45% 18.97% 10% 11% 11% 12% 9.75% 8.85% 11.5% 6.21% 7.4% 10.5% 11.9% 11% 11% 2008 45% 18.97% 9.0% 12% 11% 12% 6.65% 8.85% 11.5% 6.20% 7.0% 10.5% 11.9% 11% 11% 2007 45% 18.97% 8.0% 12% 11% 12% 6.65% 8.85% 11.5% 6.20% 6.7% 10.5% 11.9% 11% 11% 2007 to 2012 Enhanced Dividend Tax Credit Rates as a % of Actual Dividends Year Gross up Federal AB BC MB NB NL NS NT NU ON PE QC SK YT 2012 38% 20.73% 13.8% 13.47% 15.18% 14.69% 11.94% 10.84% 14.08% 7.60% 8.83% 12.86% 16.42% 15.18% 13.47% 2011 41% 23.17% 14.1% 14.53% 15.51% 15.85% 12.88% 11.69% 15.19% 8.20% 9.02% 13.87% 16.78% 15.51% 14.53% 2010 44% 25.88% 14.4% 15.60% 15.84% 17.01% 13.82% 12.55% 16.30% 8.80% 9.22% 14.89% 17.14% 15.84% 15.60% 2009 45% 27.50% 14.5% 15.95% 15.95% 17.40% 14.14% 12.83% 16.68% 9.00% 10.73% 15.23% 17.26% 15.95% 15.95% 2008 45% 27.50% 13.05% 17.40% 15.95% 17.40% 9.64% 12.83% 16.68% 8.99% 10.15% 15.23% 17.26% 15.95% 15.95% 2007 45% 27.50% 11.60% 17.40% 15.95% 17.40% 9.64% 12.83% 16.68% 8.99% 9.72% 15.23% 17.26% 15.95% 15.95% Rates are as known at December 22, 2009. (Source: taxtip.ca) 26   
  • 27.
    Rates for MoneyPurchase limits, RRSP limits, YMPE, DPSP limits and Defined Benefits limits Outlined in the following tables are data on Rates for Money Purchase limits, RRSP limits, YMPE, DPSP limits and Defined Benefits limits used to calculate PA, PSPA and PAR. Rates for Money Purchase limits, RRSP limits, YMPE, DPSP limits and Defined Benefits limits Outlined in the following tables are data on Rates for Money Purchase limits, RRSP limits, YMPE, DPSP limits and Defined Benefits limits used to calculate PA, PSPA and PAR. Year MP limit RRSP $ limit YMPE DPSP limit (1/2 MP limit) 1990 $11,500 (Old limits) $28,900 $5,750 1991 $12,500 $11,500 $30,500 $6,250 1992 $12,500 $12,500 $32,200 $6,250 1993 $13,500 $12,500 $33,400 $6,750 1994 $14,500 $13,500 $34,400 $7,250 1995 $15,500 $14,500 $34,900 $7,750 1996 $13,500 $13,500 $35,400 $6,750 1997 $13,500 $13,500 $35,800 $6,750 1998 $13,500 $13,500 $36,900 $6,750 1999 $13,500 $13,500 $37,400 $6,750 2000 $13,500 $13,500 $37,600 $6,750 2001 $13,500 $13,500 $38,300 $6,750 2002 $13,500 $13,500 $39,100 $6,750 2003 $15,500 $14,500 $39,900 $7,750 2004 $16,500 $15,500 $40,500 $8,250 2005 $18,000 $16,500 $41,100 $9,000 2006 $19,000 $18,000 $42,100 $9,500 2007 $20,000 $19,000 $43,700 $10,000 2008 $21,000 $20,000 $44,900 $10,500 2009 $22,000 $21,000 $46,300 $11,000 2010 $22,450 $22,000 $47,200 $11,225 2011 $22,970 $22,450 $48,300 $11,485 2012 $23,820 $22,970 $50,100 $11,910 2013 $23,820 27   
  • 28.
    Please note thatthe MP limit and DPSP limit above for PA purposes are also restricted to 18% of compensation. Defined Benefit limits 1990 to 2003 $1,722.22 2004 $1,833.33 2005 $2,000.00 2006 $2,111.11 2007 $2,222.22 2008 $2,333.33 2009 $2,444.44 2010 $2,494.44 2011 $2,552.22 2012 $2,646.67 2013 1/9 the money purchase limit What are the income tax rates in Canada for 2012? These are the rates that an individual will use when completing their 2012 income tax and benefit return. The information may change during the year to reflect updates to the law. • Federal tax rates for 2012 • Provincial/territorial tax rates for 2012 Federal tax rates for 2012 • 15% on the first $42,707 of taxable income, + • 22% on the next $42,707 of taxable income (on the portion of taxable income over $42,707 up to $85,414), + • 26% on the next $46,992 of taxable income (on the portion of taxable income over $85,414 up to $132,406), + • 29% of taxable income over $132,406. The chart below reproduces the first calculation that has to be made on page 2 of Schedule 1 of the tax package to calculate net federal tax. Page 1 is used to calculate federal non-refundable tax credits. 28   
  • 29.
    Federal tax ontaxable income manual calculation chart Use this column Use this column if your Use this column if your Use this column if if your taxable taxable income is more taxable income is more your taxable income is than $42,707, but not than $85,414, but not income is more $42,707 or less more than $85,414 more than $132,406 than $132,406 Enter your 1 taxable income from line 260 of your return Base amount −0 − 42,707 − 85,414 − 132,406 2 Line 1 minus line = = = = 3 2 (this amount cannot be negative) Federal tax rate × 15% × 22% × 26% × 29% 4 Multiply the = = = = 5 amount on line 3 by the tax rate on line 4 Tax on the +0 + 6,406 + 15,802 + 28,020 6 amount from line 2 Add lines 5 and 6 = = = = 7 Provincial/territorial tax rates for 2012 Under the current tax on income method, tax for all provinces (except Quebec) and territories is calculated the same way as federal tax. Form 428 is used to calculate this provincial or territorial tax. Provincial or territorial specific non-refundable tax credits are also calculated on Form 428. For complete details, see the provincial or territorial information and forms in your 2012 tax package. 29   
  • 30.
    Provincial/territorial tax rates(combined chart) Provinces/territories Rate(s) Newfoundland and 7.7% on the first $32,893 of taxable income, + Labrador 12.5% on the next $32,892, + 13.3% on the amount over $65,785 Prince Edward Island 9.8% on the first $31,984 of taxable income, + 13.8% on the next $31,985, + 16.7% on the amount over $63,969 Nova Scotia 8.79% on the first $29,590 of taxable income, + 14.95% on the next $29,590, + 16.67% on the next $33,820, + 17.5% on the next $57,000, + 21% on the amount over $150,000 New Brunswick 9.1% on the first $38,190 of taxable income, + 12.1% on the next $38,190, + 12.4% on the next $47,798, + 14.3% on the amount over $124,178 Quebec See Income tax rates (Revenu Québec Web site). Ontario 5.05% on the first $39,020 of taxable income, + 9.15% on the next $39,023, + 11.16% on the amount over $78,043 Manitoba 10.8% on the first $31,000 of taxable income, + 12.75% on the next $36,000, + 17.4% on the amount over $67,000 Saskatchewan 11% on the first $42,065 of taxable income, + 13% on the next $78,120, + 15% on the amount over $120,185 Alberta 10% of taxable income British Columbia 5.06% on the first $37,013 of taxable income, + 7.7% on the next $37,015, + 10.5% on the next $10,965, + 12.29% on the next $18,212, + 14.7% on the amount over $103,205 Yukon 7.04% on the first $42,707 of taxable income, + 9.68% on the next $42,707, + 11.44% on the next $46,992, + 12.76% on the amount over$132,406 Northwest Territories 5.9% on the first $38,679 of taxable income, + 8.6% on the next $38,681, + 12.2% on the next $48,411, + 14.05% on the amount over $125,771 Nunavut 4% on the first $40,721 of taxable income, + 7% on the next $40,721, + 9% on the next $50,964, + 11.5% on the amount over $132,406 30   
  • 31.
    British Columbia -Provincial corporation tax Federal rates The basic rate of Part I tax is 38% of your taxable income, 28% after federal tax abatement. For Canadian-controlled private corporations claiming the small business deduction, the net tax rate is 11%. For the other corporations, the net tax rate is decreased as follows: • 19% effective January 1, 2009 • 18% effective January 1, 2010 • 16.5% effective January 1, 2011 • 15% effective January 1, 2012 Provincial or territorial rates Generally, provinces and territories have two rates of income tax - a lower rate and a higher rate. Federal rates The basic rate of Part I tax is 38% of your taxable income, 28% after federal tax abatement. For Canadian-controlled private corporations claiming the small business deduction, the net tax rate is 11%. For the other corporations, the net tax rate is decreased as follows: • 19% effective January 1, 2009 • 18% effective January 1, 2010 • 16.5% effective January 1, 2011 • 15% effective January 1, 2012 Provincial or territorial rates Generally, provinces and territories have two rates of income tax - a lower rate and a higher rate. Lower rate-The lower rate applies to the income eligible for the federal small business deduction. One component of the small business deduction is the business limit. Some provinces or territories choose to use the federal business limit. Others establish their own business limit. Higher rate-The higher rate applies to all other income. Provincial and territorial tax rates (except Quebec and Alberta) The following table shows the income tax rates for provinces and territories (except Quebec and Alberta, which do not have corporation tax collection agreements with the CRA). 31   
  • 32.
    These rates arein effect on January 1, 2011, and may change during 2011. Province or territory Lower rate Higher rate Newfoundland and Labrador 4% 14% Nova Scotia 4.5% 16% Prince Edward Island 1% 16% New Brunswick 5% 11%* Ontario 4.5% 12%** Manitoba nil 12% Saskatchewan 4.5%*** 12% British Columbia 2.5% 10% Yukon 4% 15% Northwest Territories 4% 11.5% Nunavut 4% 12% * 10% effective July 1, 2011 ** 11.5% effective July 1, 2011 *** 2% effective July 1, 2011 Reporting the tax You can use Schedule 427, British Columbia Corporation Tax Calculation, to help you calculate your British Columbia tax before the application of credits. You do not have to file it with the return. See the schedule for more details. Generally, provinces and territories have two rates of income tax: the lower rate and the higher rate. The lower rate applies to either: • The income eligible for the federal small business deduction; or • The income based on limits established by the particular province or territory. The higher rate applies to all other income Corporation (Ronak) earned all of its income for 2010 from its permanent establishment in Newfoundland and Labrador. Corporation (Ronak) claimed the small business deduction when it calculated its federal tax payable. The income from active business carried on in Canada was $78,000. The Newfoundland and Labrador lower rate of tax is 4.5%. The higher rate of tax is 12%. 32   
  • 33.
    Dual tax rates Generally,provinces and territories have two rates of income tax: the lower rate and the higher rate. The lower rate applies to the income eligible for the federal small business deduction. One component of the small business deduction is the business limit. Some provinces or territories choose to use the federal business limit. Others establish their own business limit. The higher rate applies to all other income. Example: Corporation (Ronak) earned all of its income for 2010 from its permanent establishment in Saskatchewan. Corporation X claimed the small business deduction when it calculated its federal tax payable. The income from active business carried on in Canada was $78,000. The Saskatchewan lower rate of tax is 4.5%. The higher rate of tax is 12%. Corporation (Ronak) calculates its Saskatchewan tax payable as follows: Taxable income $90,000 Subtract amount taxed at lower rate: Least of lines 400, 405, 410, or 425 of the return, in the small business deduction calculation $78,000 Amount taxed at higher rate $12,000 Taxes payable at the lower rate: $78,000 × 4.5% = $ 3,510 Taxes payable at the higher rate: $12,000 × 12% = $ 1,440 Saskatchewan tax payable $ 4,950 When you allocate taxable income to more than one province or territory, you also have to allocate proportionally any income eligible for the federal small business deduction. Example 2- Corporation (Amir) has permanent establishments in both Nova Scotia and the Yukon. Its tax year runs from September 1, 2009, to August 31, 2010. Corporation (Amir) claimed the small business deduction when it calculated its federal tax payable. The lower rate of tax for Nova Scotia is 5%, and the higher rate of tax is 16%. To calculate its Nova Scotia income tax, Corporation (Amir) does the following calculations: 33   
  • 34.
    Taxable income allocatedto Nova Scotia (from Schedule 5) $60,000 Taxable income allocated to the Yukon (from Schedule 5) $30,000 Total taxable income earned in Canada $90,000 Least of lines 400, 405, 410, or 425 of the return, in the federal small business deduction calculation $78,000 Income eligible for the federal small business deduction attributed to Nova Scotia: ($60,000 ÷ $90,000) × $78,000 = $52,000 Taxable income earned in Nova Scotia $60,000 Subtract: Income eligible for the federal small business deduction attributed to Nova Scotia $52,000 Amount taxed at higher rate $ 8,000 Taxes payable at higher rate: $8,000 × 16% = $ 1,280 Taxes payable at lower rate: $52,000 × 5% = $ 2,600 Nova Scotia tax payable $ 3,880 To calculate its Yukon income tax payable, Corporation (Amir) would repeat the same steps, using the rates that apply. For a table that shows the income tax rates as of January 1, 2011. For a table that shows the income tax rates as of January 1, 2010, for the provinces and territories that have corporate tax collection agreements with the federal government. Tax Brackets Rate (%) Provincial Surtax Federal (note) $10,382 to $40,970 15.00 $40,970 to $81,941 22.00 $81,941 to $127,021 26.00 $127,021 and higher 29.00 British Columbia $11,000 to $35,859 5.06 $35,859 to $71,719 7.70 $71,719 to $82,342 10.50 $82,342 to $99,987 12.29 $99,987 and higher 14.70 34   
  • 35.
    British Columbia (BC)combined federal & provincial tax rates / 2004-2010 Marginal Tax Rates Taxable Income Canadian Dividends Capital Gains Other Income Small Business Dividends Eligible Dividends 2006 2007 2008 2009 2010 2011 2012 2004- 2008- 2010- 2004- 2008- 2006 2007 2007 2008 2009 2007 2008 2009 2010 2011 2012 2006 2007 2005 2012 2012 2005 2010 first first first first first first first $33,755 $34,397 $35,016 $35,716 $35,859 $36,146 $37,013 11.03% 10.65% 10.35% 10.03% 2.83% 2.03% 3.16% 4.16% (14.89%) (15.81%) (14.36%) (12.59%) (9.42%) (6.51%) 22.05% 21.30% 20.70% 20.06% over over over over over over over $33,755 $34,397 $35,016 $35,716 $35,859 $36,146 $37,013 up to up to up to up to up to up to up to 12.58% 12.20% 11.83% 11.35% 6.52% 5.33% 6.46% 7.46% (10.61%) (11.99%) (10.54%) (8.79%) (5.70%) (2.87%) 25.15% 24.40% 23.65% 22.70% $36,378 $37,178 $37,885 $40,726 $40,970 $41,544 $42,707 over over over over over over over $36,378 $37,178 $37,885 $40,726 $40,970 $41,544 $42,707 up to up to up to up to up to up to up to 15.58% 15.58% 15.33% 14.85% 15.27% 14.08% 15.21% 16.21% (0.46%) (1.84%) (0.38%) 1.29% (4.17%) 6.79 31.15% 31.15% 30.65% 29.70% $67,511 $68,794 $70,033 $71,433 $71,719 $72,293 $74,028 over over over over over over over $67,511 $68,794 $70,033 $71,433 $71,719 $72,293 $74,028 up to up to up to up to up to up to up to 16.85% 16.85% 16.55% 16.25% 18.33% 17.58% 18.71% 19.71% 3.10% 2.23% 3.68% 5.32% 8.12% 10.65% 33.70% 33.70% 33.10% 32.50% $72,756 $74,357 $75,769 $81,452 $81,941 $83,001 $84,993 over over over over over over over $72,756 $74,357 $75,769 $81,452 $81,941 $83,001 $84,993 18.85% 18.85% 18.55% 18.25% 23.33% 22.58% 23.71% 24.71% 8.90% 8.03% 9.48% 11.08% 10.64% 13.12% 37.70% 37.70% 37.10% 36.50% up to up to up to up to up to up to up to $77,511 $78,984 $80,406 $82,014 $82,342 $83,088 $85,414 over over over over over over over $77,511 $78,984 $80,406 $82,014 $82,342 $83,088 $85,414 up to up to up to up to up to up to up to 19.85% 19.85% 19.50% 19.15% 25.71% 24.82% 25.95% 26.95% 11.65% 10.62% 12.07% 13.66% 16.28% 18.64% 39.70% 39.70% 39.00% 38.29% $94,121 $95,909 $97,636 $99,588 $99,987 $100,787 $103,205 over over over over over over over $94,121 $95,909 $97,636 $99,588 $99,987 $100,787 $103,205 up to up to up to up to up to up to up to 20.35% 20.35% 20.35% 20.35% 27.83% 27.83% 28.96% 29.96% 14.11% 14.11% 15.56% 17.13% 19.68% 21.97% 40.70% 40.70% 40.70% 40.70% $118,285 $120,887 $123,184 $126,264 $127,021 $128,800 $132,406 over over over over over over over $118,285 $120,887 $123,184 $126,264 $127,021 $128,800 $132,406 21.85% 21.85% 21.85% 21.85% 31.58% 31.58% 32.71% 33.71% 18.46% 18.46% 19.91% 21.45% 23.91% 26.11% 43.70% 43.70% 43.70% 43.70% Marginal tax rate for dividends is a % of actual dividends received (not grossed-up amount). BC Basic Personal Amount Tax Rate 2004 2005 2006 2007 2008 2009 2010 2011 2012 2004-2006 2007 2008-2012 $8,523 $8,676 $8,858 $9,027 $9,189 $9,373 $11,000 $11,088 $11,354 6.05% 5.70% 5.06% Source: Dayarayan centre of tax research 35   
  • 36.
    Ontario (ON) combinedfederal & provincial tax rates including surtaxes / 2004-2010 Marginal Tax Rates Taxable Income Canadian Dividends Capital Gains Small Business Dividends Eligible Dividends Other Income 2006 2007 2008 2009 2010 2011 2012 2004-2009 2007 2008 2009 2010 2011 2012 2006 10.65% 2006 3.55% 2006 21.30% first $34,758 first $35,488 first $36,020 first $36,848 first $37,106 first $37,774 first $39,020 (6.69%) (7.13%) (7.71%) (6.23%) (3.93%) (1.089%) 2007-09 10.53% 2007 3.23% 2007-09 21.05% 2010-2012 10.03% 2008-09 3.88% 2010 20.05% over $34,758 up over $35,488 over $36,020 over $36,848 over $37,106 up to over $37,774 up to over $39,020 up to 2004-05 12.58% 2004-05 8.36% 2004-05 25.15% to $36,378 up to $37,178 up to $37,885 up to $40,726 $40,970 $41,543 $42,707 2006 12.20% 2006 7.42% (2.2%) (2.63%) (3.21%) (0.32%) 1.85% 3.77% 2006 24.40% 2007-12 12.08% 2007-09 7.11% 2007-10 24.15% over $36,378 up over $37,178 over $37,885 over $40,726 over $40,970 up to over $41,543 up to over $42,707 up to to $61,206 up to $62,485 up to $63,428 up to $64,882 $65,345 $66,514 $68,719 15.58% 15.86% 7.95% 7.52% 6.94% 9.76% 11.72% 13.43% 31.15% over $61,206 up over $62,485 over $63,428 over $64,882 over $65,345 up to over $66,514 up to over $68,719up to to $69,517 up to $70,976 up to $72,041 up to $73,698 $74,214 $75,550 $78,043 16.49% 16.86% 8.66% 8.14% 7.44% 10.55% 12.5% 14.19% 32.98% over $69,517 up over $70,976 over $72,041 over $73,698 over $74,214 up to over $75,550 up to over $78,043 up to to $72,102 up to $73,625 up to $74,720 up to $76,440 $76,986 $78,361 $80,963 17.70% 19.88% 12.16% 11.64% 10.94% 14.02% 15.90% 17.52% 35.39% over $72,102 up over $73,625 over $74,720 over $76,440 over $76,986 up to over $78,361 up to over $80,963 up to to $72,756 up to $74,357 up to $75,769 up to $81,452 $81,941 $83,880 $85,414 19.70% 22.59% 14.49% 13.81% 12.91% 16.49% 18.32% 19.88% 39.41% over $72,756 up over $74,357 over $75,769 over $81,452 over $81,941 up to over $83,880 up to over $85,414 up to to $118,285 up to up to up to $127,021 $128,800 $132,406 21.70% 27.59% 20.29% 19.61% 18.71% 22.25% 23.96% 25.40% 43.41% $120,887 $123,184 $126,264 over $118,285 over $120,887 over $123,184 over $126,264 over $127,021 over $128,800 over $132,406 23.20% 31.34% 24.64% 23.96% 23.06% 26.57% 28.19% 29.54% 46.41% Marginal tax rate for dividends is a % of actual dividends received (not grossed-up amount). ON Basic Personal Amount Tax Rate 2004 2005 2006 2007 2008 2009 2010 2011 2012 2004-2009 2010-12 $8,044 $8,196 $8,377 $8,553 $8,681 $8,881 $8,943 $9,104 $9,405 6.05% 5.05% Source: Dayarayan centre of tax research 36   
  • 37.
    Federal Income TaxRates for Income Earned by a Canadian-Controlled Private Corporation (CCPC) 2009-2012 Active Business Income between $400,000 Small Business Income up to $400,000 General Active Business Income Investment Income Description and $500,000 2009 2010 2011 2012 2009 2010 2011 2012 2009 2010 2011 2012 2009 2010 2011 2012 General corporate rate 38.0 38.0 38.0 38.0 38.0 38.0 38.0 38.0 38.0 38.0 38.0 38.0 38.0 38.0 38.0 38.0 Federal abatement (10.0) (10.0) (10.0) (10.0) (10.0) (10.0) (10.0) (10.0) (10.0) (10.0) (10.0) (10.0) (10.0) (10.0) (10.0) (10.0) 28.0 28.0 28.0 28.0 28.0 28.0 28.0 28.0 28.0 28.0 28.0 28.0 28.0 28.0 28.0 28.0 Small business deduction (17.0) (17.0) (17.0) (17.0) (17.0) (17.0) (17.0) (17.0) 0.0 0.0 0.0 0.0 0.0 0.0 0.0 0.0 Rate reduction 0.0 0.0 0.0 0.0 0.0 0.0 0.0 0.0 (1.3) (10.0) (11.5) (1.3) 0.0 0.0 0.0 0.0 Refundable tax 0.0 0.0 0.0 0.0 0.0 0.0 0.0 0.0 0.0 0.0 0.0 0.0 6.7 6.7 6.7 6.7 11.0 11.0 11.0 11.0 11.0 11.0 11.0 11.0 28.0 28.0 28.0 15.0 34.7 34.7 34.7 34.7 Comparison of Canada Corporate income tax rates- Federal and BC –(2003-2012) 2003 2004 2005 2006 2007 2008 2009 2010 2011 2012 General/M&P/Investment 24.12 22.12 22.12 22.12 22.12 19.50 19.00 18.00 16.50 15.00 Federal(1) Small business 13.12 13.12 13.12 13.12 13.12 11.00 11.00 11.00 11.00 11.00 Investment - CCPC 35.79 35.79 35.79 35.79 35.79 34.67 34.67 34.67 34.67 34.67 General/M&P/Investment 13.50 13.50 13.50/12.00 12.00 12.00 12.00/11.00 11.00 10.50 10.00 10.00 British Columbia(2) Small business 4.50 4.50 4.50 4.50 4.50 4.50/3.50/2.50 2.50 2.50 2.50 2.50 (1) Federal: The income limit for the purposes of the small business deduction (SBD limit) has been $300,000 since 2005. The May 2, 2006 federal budget provided for a rise in the SBD limit to $400,000 effective January 1, 2007. The January 27, 2009 federal budget provides for an increase in the SBD limit to $500,000, effective January 1, 2009. The business limit must be allocated between associated corporations. The SBD is reduced progressively on a straight-line basis for CCPCs when their taxable capital used in Canada varies between $10 million and $15 million. (2) British Columbia: SBD limit: increased to $400,000 for taxation years ending after December 31, 2004. As announced in the February 19, 2008 budget, the General/M&P/Investment rate was reduced to 11% effective July 1, 2008, to 10.5% effective January 1, 2010 and to 10% effective January 1, 2011. In addition, the rate for small businesses was reduced to 3.5% effective July 1, 2008, to 3% effective January 1, 2010 and to 2.5% effective January 1, 2011. On October 23, 2008, the government brought down its Economic Update which proposed a further decrease in the rate for small businesses, from 3.5% to 2.5% effective December 1, 2008. The February 17, 2009 budget confirmed the previously announced rate reductions. In a news release dated April 7, 2009, the B. C. government announced that the SBD limit would be increased from $400,000 to $500,000 on January 1, 2010. 37   
  • 38.
    Comparison of CorporateTax Rates 2003-2012 Federal British Columbia Top marginal rate year Investments Capital Other Income General SBD M&P General/M&P SBD Dividends (CCPC) Gain 2003 24.12 13.12 22.12 35.79 13.50 4.50 21.85 31.58 43.70 2004 22.12 13.12 22.12 35.79 13.50 4.50 21.85 31.58 43.70 2005 22.12 13.12 22.12 35.79 13.50 4.50 21.85 31.58 43.70 2006 22.12 13.12 22.12 35.79 12.00 4.50 21.85 - 43.70 2007 22.12 13.12 22.12 35.79 12.00 4.50 18.47 31.58 43.70 2008 21.00 11.50 19.50 34.67 11.00 4.50 21.85 31.58 43.70 2009 19.50 11.00 19.00 34.67 12.00 3.50 21.85 32.71 43.70 2010 18.00 11.00 18.00 34.67  10.50 2.50 2011 16.50 11.00 16.50 34.67  10.00 2.50 2012 15.00 11.00 15 34.67  10.00 2.50 Federal SBD limite 2005($&300,000),2006($400,000) and 2009 ( $500,000) BC –SBD Limite 2005 ($400,000) and 2009 and after ( $500,000) Deferred Income Plans - Maximum Contributions Year RRSP(1) RPP(2) 1995 $14,500 $15,500 1996-2002 $13,500 $13,500 2003 $14,500 $15,500 2004 $15,500 $16,500 2005 $16,500 $18,000 2006 $18,000 $19,000 2007 $19,000 $20,000 2008 $20,000 $21,000 2009 $21,000 $22,000 2010 $22,000 $22,450 2011 $22,450 $22,970 2012 $22,970 indexed (1) RRSP: Registered Retirement Savings Plan (2) RPP: Registered Pension Plan 38   
  • 39.
    Table of CanadianFederal Tax Rates for the years 2003- 2012 Portion 2003 2004 2005 2006 2007 2008 2009 2010 2011 2012 1st portion of taxable income $32,183 $35,000 $35,595 $36,378 $37,178 $37,885 $40,726 $40,970 $41,544 $42,707 Applicable Rate 16.00% 16.00% 15.00% 15.25% 15.00% 15.00% 15.00% 15.00% 15.00% 15.00% Next portion of taxable income $32,185 $35,000 $35,595 $36,378 $37,179 $37,884 $40,726 $40,971 $41,535 $42,706 Applicable Rate 22.00% 22.00% 22.00% 22.00% 22.00% 22.00% 22.00% 22.00% 22.00% 22.00% Next portion of taxable income $40,280 $43,804 $44,549 $45,529 $46,530 $47,415 $44,812 $45,080 $45,791 $46,992 Applicable Rate 26.00% 26.00% 26.00% 26.00% 26.00% 26.00% 26.00% 26.00% 26.00% 26.00% On the amount over $104,648 $113,804 $115,739 $118,285 $120,887 $123,184 $126,264 $127,021 $128,800 $132,406 Applicable Rate 29.00% 29.00% 29.00% 29.00% 29.00% 29.00% 29.00% 29.00% 29.00% 29.00% Source: Dayarayan centre of tax research Table of Individual Income Tax Rates for the Province of British Columbia / 2003- 2012 Portion 2003 2004 2005 2006 2007 2008 2009 2010 2011 2012 st 1 portion of taxable income $31,653 $32,476 $33,061 $33,755 $34,397 $35,016 $35,716 $35,859 $36,146 $37,013 Applicable Rate 6.05% 6.05% 6.05% 6.05% 5.70% 5.06% 5.06% 5.06% 5.06% 5,06 Next portion of taxable income $31,655 $32,478 $33,062 $33,756 $34,397 $35,017 $35,717 $35,860 $36,147 $37,015 Applicable Rate 9.15% 9.15% 9.15% 9.15% 8.65% 7.70% 7.70% 7.70% 7.70% 7.70% Next portion of taxable income $9,377 $9,621 $9,794 $10,000 $10,190 $10,373 $10,581 $10,623 $10,707 $10,965 Applicable Rate 11.70% 11.70% 11.70% 11.70% 11.10% 10.50% 10.50% 10.50% 10.50% 10.50% Next portion of taxable income $15,575 $15,980 $16,268 $16,610 $16,925 $17,230 $17,574 $17645 $17,786 $18,212 Applicable Rate 13.70% 13.70% 13.70% 13.70% 13.00% 12.29% 12.29% 12.29% 12.29% 12.29% On the amount over $88,260 $90,555 $92,185 $94,121 $95,909 $97,636 $99,588 $99,987 $100,787 $103,205 Applicable Rate 14.70% 14.70% 14.70% 14.70% 14.70% 14.70% 14.70% 14.70% 14.70% 14.70% Source: Dayarayan centre of tax research 39   
  • 40.
    BC Combined Federaland Provincial Income Tax Rates for Income Earned by a Canadian-Controlled Private Corporation(CCPC) General Active Small Business Income up to Active Business Income between Effective date Business Investment Income $400,000 $400,000 and $500,000 Income 01-Jan-08 15.5/14.5/13.5% - 31.5/30.5% 46.7/45.7% 01-Jan-09 13.50% 22.00% 30.00% 45.70% 01-Jan-10 13.50% 21.50% 28.50% 45.20% 01-Jan-11 13.50% 21.00% 26.50% 26.50% 01-Jan-12 15% 25% 25% 25% BC Provincial Income Tax Rates for Income Earned by a Canadian-Controlled Private Corporation(CCPC) General Active Small Business Income up to Active Business Income between Effective date Business Investment Income $400,000 $400,000 and $500,000 Income 01-Jan-08 4.5/3.5/2.5% - 12/11% 12/11% 01-Jan-09 2.50% 11% 11% 11% 01-Jan-10 2.50% 10.50% 10.50% 10.50% 01-Jan-11 2.50% 10% 10% 10% 01-Jan-12 2.50% 10% 10% 10% Small Business Income (SBI) Thresholds for Canadian-Controlled Private Corporations (CCPCs) 2008-2012 Description 2008 2009 2010 2011-2012 Federal $400,000 $500,000 $500,000 $500,000 British Columbia $400,000 $400,000 $400,000 $500,000 40   
  • 41.
    Federal Personal IncomeTax Rates / 2004-2012 Marginal Tax Rates Taxable Income Canadian Dividends Capital Gains Small Business Other Income Eligible Dividends Dividends 2005 2006 2007 2008 2009 2010 2011 2012 2005- 2005- 2004 2005-2012 2004 2005-2012 2007-2009 2010 2011 2012 2004 2006 2012 first $35,595 first $36,378 first $37,178 first $37,885 first $40,726 first $40,970 First $41,544 First $427.7 8.00% 7.50% 3.33% 2.08% 2.08% (5.75%) (4.28%) (2.02%) (0.03) 16% 15.00% Over over $35,595 up over $36,378 up over $37,178 up over $37,885 up over $40,726 up over $40,970 up Over 41,544 427,7to 11.00% 11.00% 10.83% 10.83% 10.83% 4.40% 5.80% 7.78% 9.65 22% 22.00% to $71,190 to $72,756 to $74,357 to $75,769 to $81,452 to $81,941 to 83,088 85,414 Over over $71,190 up over $72,756 up over $74,357 up over $75,769 up over $81,452 up over $81,941 up Over 83,088 85,414 to 13.00% 13.00% 15.83% 15.83% 15.83% 10.20% 11.56% 13.49% 15.15 26% 26.00% to $115,739 to $118,285 to $120,887 to $123,184 to $126,264 to $127,021 to 128,800 132,406 Over over $115,739 over $118,285 over $120,887 over $123,184 over $126,264 over $127,021 Over 128,800 14.50% 14.50% 19.58% 19.58% 19.58% 14.55% 15.88% 17.72% 19.29 29% 29.00% 132,406 Marginal tax rate for dividends is a % of actual dividends received (not grossed-up amount). Federal Basic Personal Amount Tax Rate 2004 2005 2006 2007 2008 2009 2010 2011 2012 2004 2005 & 2012 2006 $8,012 $8,648 $9,039 $9,600 $9,600 $10,320 $10,382 $10,527 $10,822 16.00% 15.00% 15.25% Source: Dayarayan centre of tax research 41   
  • 42.
    Total Average HouseholdExpenditure By Province Year 2007 2008 2009 Canada 69,950 71,360 71,120 Newfoundland and Labrador 55,010 57,710 57,600 Prince Edward Island 55,570 58,710 56,900 Nova Scotia 59,990 60,330 60,870 New Brunswick 58,210 58,440 61,210 Quebec 57,310 60,480 60,120 Ontario 76,650 77,310 76,580 Manitoba 63,300 63,510 66,610 Saskatchewan 63,940 68,280 69,380 Alberta 85,910 86,910 84,980 British Columbia 72,620 73,120 73,570 Average total expenditure and shares of spending of major categories for provinces and territories, 2009 Average Personal household Food Shelter Clothing Transportation taxes1 spending $ Shares of spending2 (%) Canada 71,120 10.2 19.8 4.0 13.7 20.2 Newfoundland and Labrador 57,600 11.3 16.6 4.3 16.0 18.5 Prince Edward Island 56,900 11.8 19.5 3.7 14.0 16.8 Nova Scotia 60,870 11.0 18.9 3.6 14.6 18.2 New Brunswick 61,210 10.9 17.4 3.7 15.8 17.5 Quebec 60,120 12.0 18.8 3.9 13.9 19.9 Ontario 76,580 9.5 20.3 4.1 13.4 21.1 Manitoba 66,610 9.8 18.3 3.9 14.3 20.2 Saskatchewan 69,380 9.1 17.9 3.8 15.9 19.4 Alberta 84,980 9.2 19.0 4.0 14.0 22.2 British Columbia 73,570 10.3 22.2 3.9 12.7 17.9 Yukon 69,860 10.7 19.9 3.7 12.8 18.5 Northwest Territories 82,970 11.5 21.5 3.9 12.2 21.3 Nunavut 84,440 17.5 15.2 5.0 7.5 18.7 1. Percentage of spending on personal taxes depends on provincial and federal income tax rates as well as 2. Shares of spending represent the proportions of average household spending. 42   
  • 43.
    What's Taxable underthe HST and What's Not in British Columbia?1 AROUND THE HOUSE GST-taxable PST-taxable Is there a change to the before July, before July amount of tax payable 2010 1,2010 the HST? Cleaning Products 5% 7% No (remains 12%) Laundry Detergent, Fabric Softeners 5% 7% No (remains 12%) Household Furniture 5% 7% No (remains 12%) Household Appliances 5% 7% No (remains 12%) (Refrigerators, Stoves, Washers, Dryers, Freezers, Dishwashers) Pre-packaged Computer Software 5% 7%2 No (remains 12%) Books (Including Audio Books) 5% No PST No (remains 5%) Newspapers 5% No PST Yes (changes to 12%) Certain School Supplies 5% No PST Yes (changes to 12%) Magazines 5% No PST Yes (changes to 12%) Office Supplies and Stationery 5% 7% No (remains 12%) Landscaping Material (Sod, Topsoil, 5% 7% No (remains 12%) Rockery) Linens (e.g., Blankets, Towels, 5% 7% No (remains 12%) Sheets) Tens, Sleeping Bags, Camping 5% 7% No (remains 12%) Equipment Tools 5% 7% No (remains 12%) Patio Furniture 5% 7% No (remains 12%) Rugs and Mats 5% 7% No (remains 12%) Works of Art, Vases, and Carvings 5% 7% No (remains 12%) Sewing Machines 5% 7% No (remains 12%) Vacuum Cleaners 5% 7% No (remains 12%) Barbeques, Lawnmowers, Snow 5% 7% No (remains 12%) Blowers, Sprinklers Toys (e.g., Puzzles, Games, Action 5% 7% No (remains 12%) Figures, Dolls, Playsets) Outdoor Play Equipment (e.g., 5% 7% No (remains 12%) Swing Sets, Sandboxes, Slides) Arts and Craft Supplies (e.g., Glue, 5% 7% No (remains 12% Paper, etc) Building Materials (e.g., Lumber, 5% 7% No (remains 12% Concrete Mix, Nails) Energy Star Windows 5% No PST3 Yes (changes to 12%) Thermal Insulation, Weather 5% NoPST Yes (changes to 12%) Stripping and Caulking Exterior and Interior Paint 5% 7% No (remains 12%) Kitchen Utensils 5% 7% No (remains 12%) Cookware 5% 7% No (remains 12%) First Aid Kits 5% No PST Yes (changes to 12%) Smoke Detectors Valued less Than 5% No PST Yes (changes to 12%) $2502 for Residential Use Other Smoke Detectors 5% 7% No (remains 12%)                                                              1 - Assumes sales by GST/HST registrants that are not non-profit organization or registered charities, unless otherwise specified. 2 - The Energy Star exemption for residential refrigerators, freezers and clothes washers ended on March 31, 2010. All major household appliances are now subject to PST. 3 - Exemption was scheduled to expire April 2011. 43   
  • 44.
    AROUND THE HOUSE GST-taxable PST-taxable Is there a change to the before July, before July amount of tax payable 2010 1,2010 the HST? Household Pets (Including Pet 5% 7% No (remains 12%) Food) House Plants, Cut Flowers, and 5% 7% No (remains 12%) Outdoor Ornamental Plants Food Producing Plants and Trees 5% No PST Yes (changes to 12%) (e.g., Tomato Plants, Plum Tree) Household Moving Services 5% No PST Yes (changes to 12%) CLOTHING, FOOTWEAR AND GST-taxable PST-taxable Is there a change to the ACCESSORIES before July, before amount of tax payable 2010 July 1,2010 the HST? Adult Clothing and Footwear 5% 7% No (remains 12%) Children Sized Clothing and 5% No PST No (remains 5%) Footwear Adult Sized Clothing for Children 5% No PST Yes (changes to 12%) Children's Cloth Diapers 5% No PST No (remains 5%)4 Children's Disposable Diapers 5% 7% Yes (drops to 5%)5 Shoe Repair 5% No PST Yes (changes to 12%) Tailoring Services 5% No PST Yes (changes to 12%) Dry Cleaning 5% No PST Yes (changes to 12%) Formal Wear Rentals 5% 7% No (remains 12%) Used Adult Clothing Purchased for 5% No PST Yes (changes to 12%)6 Less Than $100 Watches 5% 7% No (remains 12%) Jeweller 5% 7% No (remains 12%) Handbags and Purses 5% 7% No (remains 12%) Backpacks 5% 7% No (remains 12%) Shoe Insoles and Laces 5% 7% No (remains 12%) Sunglasses (Non-prescription) 5% 7% No (remains 12%) Scarves 5% 7% No (remains 12%) Umbrellas 5% 7% No (remains 12%) Belts 5% 7% No (remains 12%) FOOD AND BEVERAGES GST-taxable PST-taxable Is there a change to the before before amount of tax payable July, 2010 July 1,2010 the HST? Basic Groceries (e.g., Dairy, Meat, No GST No PST No HST Vegetables, Canned Goods) Snack Foods (e.g., Chips, Pop) 5% No PST Yes (changes to 12%) Restaurant Meals 5% No PST Yes (changes to 12%) Alcoholic Beverages 5% 10% Yes (drops to 12%)7                                                              4 - For Further detail see http://www.cra-arc.gc.ca/E/pub/gi/gi-063-e.pdf. 5 - For Further detail see http://www.cra-arc.gc.ca/E/pub/gi/gi-063-e.pdf. 6 - All sales used or donated goods mode by a registered charity are exempt from HST. 7 - Although the provincial sales tax rate on liquor is decreasing from 10% to 7% liquor mark-ups are adjusted with the implementation of the HST to generally keep the Liquor Distribution Branch shelf prices constant.. 44   
  • 45.
    AROUND THE HOUSE GST-taxable PST-taxable Is there a change to the before July, before July amount of tax payable 2010 1,2010 the HST? Catering and Event Planning 5% No PST8 Yes (changes to 12%)9 Services (e.g., planning, consulting, coordinating and organizing) HOME SERVESES GST-taxable PST-taxable Is there a change to the before before amount of tax payable July, 2010 July 1,2010 the HST? Basic Cable Television 5% No PST Yes (changes to 12%) Additional or Specialty Cable 5% 7% No (remains 12%) Television or Satellite Television Cell Phone 5% 7% No (remains 12%) Municipal Water No GST No PST No HST Home Maintenance Equipment 5% 7% No (remains 12%) (e.g., Lawn Mowers, Mops) Local Residential Phone 5% No PST Yes (changes to 12%) Long Distance Telephone Services 5% 7% No (remains 12%) Repair to Certain Household 5% No PST Yes (changes to 12%) Appliances (e.g., Stoves, Ovens, Refrigerators, Washers, and Dryers) Repair to Household Electronics 5% 7% No (remains 12%) (e.g., Televisions and Stereo Equipment) Home Insurance No GST No PST No HST Residential Electricity and Heating 5% No PST, but Yes (drops to 5%, from (e.g., Natural Gas/Oil) subject to 0.4% 5.4%, after a 7% ICE10 Fund levy provincial rebate)11 Internet Access 5% 7% No (remains 12%) Repair Maintenance or Renovation 5% No PST Yes (changes to 12%) Services for Real Property (e.g., Plumbing Electrical Wiring) Landscaping Lawn-Care, Private 5% No PST Yes (changes to 12%) Snow Removal and House Cleaning Computer Hardware Repair Services 5% 7% No (remains 12%) (e.g., adding or repairing circuit boards or other components Computer Software Repair Services 5% No PST Yes (changes to 12%) (e.g., virus removal or software installation) ACCOMMODATION AND GST-taxable PST-taxable Is there a change to the TRAVEL before before amount of tax payable July, 2010 July 1,2010 the HST? Luggage 5% 7% No (remains 12%) Municipal Public Transit No GST No PST No HST Hotel Rooms 5% 8% Yes (drops to 12%)12                                                              8 - PST applies if the caterer provides a taxable service (e.g., setting up and taking down temporary gazebos, tents, and dance floors) or taxable goods that the customer keeps (e.g., flowers or decorations). 9 - Catering provided by a registered charity is exempt from HST. 10 - Innovative Clean Energy 11 - Provincial administered Residential Energy Rebate applies to provincial portion of HST and ICE Fund levy is eliminated. 12 - In certain municipalities there is an additional local hotel room tax of up to 2% for tourism marketing 45   
  • 46.
    AROUND THE HOUSE GST-taxable PST-taxable Is there a change to the before July, before July amount of tax payable 2010 1,2010 the HST? Taxis 5% No PST Yes (changes to 12%) Camping Sites 5% No PST Yes (changes to 12%) British Columbia Ferry System No GST No PST No HST Domestic Air, Rail and Bus Travel 5% No PST Yes (changes to 12%) Originating in British Columbia International Air Travel to 5% No PST No (remains 5%) Continental United States originating in British Columbia (Other Than Day Trips) International Air Travel Other Than No GST No PST No HST to Continental United States originating British Columbia International Rail, Bus or Ship No GST No PST No HST Travel originating in British Columbia (Other Than Day Trips) MOTORIZED VEHICLES GST-taxable PST-taxable Is there a change to the before before amount of tax payable July, 2010 July 1,2010 the HST? Short Term Auto Rentals 5% 7% Plus $ 1.50 Yes (rate remains at 12% per day Passenger but $1.50 per day tax Vehicle Rental eliminated Tax Lease of a Vehicle Other Than an 5% 7% to 10% Depends on previous PST Alternative Fuel Vehicle of Fuel treatment (remains 12% Efficient Vehicle or drops to 12%) Lease of Alternative Fuel Vehicle 5% 7% to 10% Depends on previous PST and Fuel Efficien Vehicle (Subject to a PST treatment (remains 12% reduction) 13 or drops to 12%) Purchase of Vehicle Other Than an 5% 7% to 10% Depends on previous P5T Alternative Fuel Vehicle or Fuel treatment (remains 12% Efficient Vehicle or drops to 12%) Purchase of an Alternative Fuel 5% 7% to 10% Depends on previous Vehicle and Fuel Efficient Vehicle (subject to a PST treatment PST (remains 12% of reduction) drops to 12%) Child Car Seats and Booster. Seats 5% No PST No (remains 5%)14 Auto Insurance No GST No PST No HST Vehicle Parts 5% 7% No (remains 12%) Vehicle Repair Services 5% 7% No (remains 12%) Gil Changes 5% 7% No (remains 12%) Tires 5% 7% No (remains 12%) Automotive Window Repair 5% 7% No (remains 12%)                                                              13 - Please note that purchases and leases of some new alternative fuel vehicles or new fuel efficient vehicles are subject to a partial reduction in the PST payable. For more information on the amounts of this PST reduction and who qualifies, please see Bulletin SST085 Alternative Fuel Vehicles and Fuel Efficient Vehicles, located on the Ministry of Finance's website at http://www.cra- arc.gc.ca/E/pub/gi/gi-063/gi-063-e.pdf. 14 - For further detail, refer to http://www.cra-arc.gc.ca/E/pub/gi/gi/063-e.pdf. 46   
  • 47.
    AROUND THE HOUSE GST-taxable PST-taxable Is there a change to the before July, before July amount of tax payable 2010 1,2010 the HST? Purchase of 5% 7% to 10% Depends on previous PST Used Vehicle treatment (remains 12% from a Non- or drops to 12%) GST Registrant (e.g., car dealer) Purchase of Used vehicle from- No GST 7% to 10% No HST (12% provincial ali^ff-GST Registrant (e.g., Private tax applies) 15 seller) Purchase of Boats and Non-Turbin No GST 7% No HST (12% provincial Aricraft from a Non-GST Registrant tax applies) (e.g., Private Seller) Boats and Non-Turbine Aircraft 5% 7% No (remains 12%) Gasoline/Diesel 5% No PST No (remains 5%)16 VehideOil, Grease, Lubricants 5% 7% No (remains 12%) antifreeze Outboard Motors 5% 7% No (remains 12%) Motor Vehicle Parking 5% No PST Yes (changes to 12%) HOME PURCHASES GST-taxable PST-taxable Is there a change to the before before amount of tax payable July, 2010 July 1,2010 the HST? Niew Homes up to $525,000 5% No PST No change"17 New Homes over $525,000 5% No PST Yes18 Previously Occupied Homes No GST No PST No HST Legal fees 5% 7% No (remains 12%) Real Estate Commissions 5% No PST Yes (changes to 12%) HEALTH AND BEAUTY GST-taxable PST-taxable Is there a change to the before before amount of tax payable July, 2010 July 1,2010 the HST? Health Care Services Offered No GST No PST No HST by a Medical Practitioner (e.g., Medical and Dental Services) 19 Audiologist Services Offered by a No GST No P5T No HST practitioner of the Service Chiropractic Services Offered by a No GST No PST No HST practitioner of the Service Physiotherapy Services Offered by a No GST No PST No HST practitioner of the Service Massage Therapy Services 5% No PST Yes (changes to 12%) Pharmacist Dispensing Fees No GST No PST No HST Over-the-Counter Medications 5% No PST Yes (changes to 12%)                                                              15 - HST does not apply. However, British Columbia's 12% tax on private sales of boots, aircraft and vehicles will apply to provide comparable treatment to sales by dealerships. 16 - In For further detail, refer to http://www.cra-arc.gc.ca/E/Pub/gi/gi/061-e.pdf. 17 - BC will provide a rebate of 71.43% of the provincial portion of the HST, to a maximum of $26,250, for new housing purchased as a primary residence. The rebate ensures that, on average, purchasers will pay no more provincial tax due to harmonization-that is, the will pay no more in provincial HST than is currently embedded as PST in the price of a new home. It is estimated that the embedded PST in new homes in BC is, on overage, equal to about 2% of the price. 18 - Purchasers of eligible new homes over $, are eligible for a rebate of $26,250 19 - Other than for cosmetic purposes. 47   
  • 48.
    AROUND THE HOUSE GST-taxable PST-taxable Is there a change to the before July, before July amount of tax payable 2010 1,2010 the HST? Prescription Drugs No GST No PST No HST Some Medical Devices Including No GST No PST No HST Walkers, Hearing Aids Prescription Glasses and Contact No GST No PST No HST Lenses Feminine Hygiene Products 5% No PST No (remains 5%)20 Adult Incontinence Products No GST No PST No HST Cosmetics 5% 7% No (remain5l2%) Hair Care Products (e.g., Shampoo, 5% 7% No (remains 12%) Conditioner, Styling Products) Dental Hygiene Products (e.g.. 5% 7% No (remains 12%) Toothpaste, Toothbrushes, Floss) Vitamins 5% No PST Yes (changes to 12%) Pill Boxes 5% 7% No (remains 12%) Sow Dryers 5% 7% No (remains 12%) Curling Irons 5% 7% No (remains 12%) Deodorants and Deodorizers 5% 7% No (remains 12%) Nail Care Products (e.g. Nail Polish, 5% 7% No (remains 12%) Nail Files) Perfume 5% 7% No (remains 12%) Shaving Supplies (e.g., Razors, 5% 7% No (remains 12%) Shaving Cream) Tanning Lotion 5% 7% No (remains 12%) MEMBERSHIPS, GST-taxable PST-taxable Is there a change to the ENTERTAINMENT AND before before amount of tax payable SPORTS EQUIPMENT July, 2010 July 1,2010 the HST? Admission to Professional Sporting 5% No PST Yes (changes to 12%) Events (e.g. Hockey, Football and Soccer Games) Movie Tickets 5% NO P5T Yes (changes to 12%) MUSIC Lessons No GST No PST No HST Music Instruments 5% 7% No (remains 12%) Skis and Snowboards 5% 7% No (remains 12%) Hockey Equipment 5% 7% No (remains 12%) Steles (e.g., Hockey, Figure, Inline) 5% 7% No (remains 12%) Safety Helmets for Sports (e.g., 5% No PST Yes (changes to 12%) Hockey Helmets, Snowboard Helmets, Bike Helmets) 6o!r Clubs 5% 7% No (remains 12%) Golf Memberships 5% No PST Yes (changes to 12%) Driving Range Fees 5% No PST Yes (changes to 12%) Gym and Athletic Memberships 5% No PST Yes (changes to 12%)                                                              20 - For further detail, refer to http://www.cra-arc.gc.ca/E/Pub/gi/gi/061-e.pdf. 48   
  • 49.
    AROUND THE HOUSE GST-taxable PST-taxable Is there a change to the before July, before July amount of tax payable 2010 1,2010 the HST? Ballet, Karate, Trampoline. Hockey. 5% No PST 21 Yes (changes to 12%) Soccer Lessons etc. Tickets for Live Theatre 5% No PST Yes22 (changes to 12%) Swim Fins and Swimming Goggles 5% 7% No (remains 12%) Bicycles 5% No PST Yes (changes to 12%) Bicycle Accessories Purchased 5% 7% No (remains 12%) Separately Admission to Museums and Art 5% No PST Yes (changes to 12%) Galleries Music Concerts 5% No PST Yes (changes to 12%) Sports Equipment (e.g., Footballs, 5% 7% No (remains 12%) Soccer Ball, Baseball Bats, Free Standing Gymnastics Equipment) Ski Lift Passes 5% No PST Yes (changes to 12%) Adult Sized Ski Gloves 5% 7% No (remains 12%) Adult Sized Ski Gloves for Children 5% No PST Yes (changes to 12%) Children's Sized Ski Gloves 5% No PST No (remains 5%) Ski Goggles 5% 7% No (remains 12%) Adult Sized Ski Boots 5% 7% No (remains 12%) Adult Sized Ski Boots for Children 5% No PST Yes (changes to 12%) Children's Sized Ski Boots 5% No PST Yes (changes to 12%) LEASSE AND RENTALS GST-taxable PST-taxable Is there a change to the before before amount of tax payable July, 2010 July 1,2010 the HST? Condo Fees No GST No PST NO HST23 Long-Term Residential No GST No PST No HST Accommodation Hockey Rink and Hall Rentals 5% No PST Yes (Changes to 12%) Equipment Rentals (e.g., Carpet 5% 7% No (remains 12%) cleaners, power washers) ELECTRONICS GST-taxable PST-taxable Is there a change to the before before amount of tax payable July, 2010 July 1,2010 the HST? Televisions 5% 7% No (remains 12%) DVD and Blu-ray Players and 5% 7% No (remains 12%) Accessories Digital Cameras and Camcorders 5% 7% No (remains 12%)                                                              21 - These items are subject to HST, although some could be exempt from HST if provided by a public service boody to children 14 and under and underprivileged individuals with a disability. 22 - Subject to HST, although some could be exempt if the maximum admission charged by a public service body to children 14 and under and underprivileged individuals with a disability. 23 - Residential condo association fees to residents are exempt; however, purchase by condominium corporation will be subject to HST, if applicable. 49   
  • 50.
    AROUND THE HOUSE GST-taxable PST-taxable Is there a change to the before July, before July amount of tax payable 2010 1,2010 the HST? Cell Phones and Smart Phones 5% 7% No (remains 12%) CDs, DVDs, and Blu-ray Discs 5% 7% No (remains 12%) MP3 Players 5% 7% No (remains 12%) Music or Video MP3s Downloaded 5% No PST Yes (changes to 12%) Electronically Video Game Consoles 5% 7% No (remains 12%) Video Games 5% 7% No (remains 12%) GPS Systems 5% 7% No (remains 12%) Laptops 5% 7% No (remains 12%) Desk Top Computers 5% 7% No (remains 12%) Printers and Fax Machines 5% 7% No (remains 12%) Stereos and Speakers 5% 7% No (remains 12%) Cables, Wires, and Connector 5% 7% No (remains 12%) Projector Screens 5% 7% No (remains 12%) Headphones 5% 7% No (remains 12%) Marine Electronics (e.g., Marine 5% 7% No (remains 12%) Radios, GPS Systems, Speakers) PROFESSIONAL AND GST-taxable PST-taxable Is there a change to the PERSONAL SERVICES before before amount of tax payable July, 2010 July 1,2010 the HST? Child Care Services No GST No PST No HST Legal Aid No GST No PST No HST Funeral Services 5% No PST Yes (changes to 12%) Coffins and Urns Purchased from 5% 7% No (remains 12%) Funeral Services Fitness Trainer 5% No PST Yes (changes to 12%) Hair Stylist/Barber 5% No PST Yes (changes to 12%) Aesthetician Services (e.g., 5% No PST Yes (changes to 12%) Manicures, Pedicures, Facials) Legal Services 5% 7% No (remains 12%) Accounting Services 5% No PST Yes (changes to 12%) Interior Design Services 5% No PST Yes (changes to 12%) Wedding Planning Services 5% No PST Yes (changes to 12%) Veterinarian Services 5% No PST Yes (changes to 12%) Professional Printed Photographs 5% 7% No (remains 12%) Furniture, Automotive and Marine 5% 7% No (remains 12%) Re-upholstery TOBACCO GST-taxable PST-taxable Is there a change to the before before amount of tax payable 50   
  • 51.
    AROUND THE HOUSE GST-taxable PST-taxable Is there a change to the before July, before July amount of tax payable 2010 1,2010 the HST? July, 2010 July 1,2010 the HST? Cigarettes 5% No PST Yes (changes to 12%) Cigars 5% No PST Yes (changes to 12%) Chewing Tobacco 5% No PST Yes (changes to 12%) Nicotine Replacement Products 5% No PST Yes (changes to 12%) BANKING AND INVESTMENTS GST-taxable PST-taxable Is there a change to the before before amount of tax payable July, 2010 July 1,2010 the HST? Mortgage Interest Costs No GST No PST No HST Most Financial Services No GST No PST No HST 51   
  • 52.
    References: 1. BC budget 2012,2011,2010 http://www.bcbudget.gov.bc.ca/2010/highlights/2010_Highlights.pdf 2. BC Budget 2009 http://www.bcbudget.gov.bc.ca/2009/estimates/2009_Estimates.pdf 3. http://www.fin.gov.bc.ca/Fed_Prov_MOU_english_July23.pdf 4. Taxation and Economic Efficiency: Results from a Canadian CGE Model, par Maximilian Baylor et Louis Beauséjour, Canadian federal Finance Minister 2004 5. Vaughn Palmer Ambitious reforms by Liberal governments to be eclipsed by HST, Vancouver Sun, July 28th, 2009 6. from [[2][Public account of Canada]], stating at $29.9 billions the 5% GST revenue for whole Canada for the exercise 2007/2008, and considering the contributively part of the British Columbia is of 15.4% in 2003 according to http://www.parl.gc.ca/information/library/PRBpubs/prb0610-e.htm, , 29.9*(15.7%)= $4.6Billions not including the BC GDP growth 7. http://www2.news.gov.bc.ca/news_releases_2009-2013/2009PREM0017-000141.htm 8. Taxation and Economic Efficiency: Results from a Canadian CGE Model, par Maximilian Baylor et Louis Beauséjour, Canadian federal Finance Minister 2004 9. http://www.fraserinstitute.org/Commerce.Web/product_files/JulAug06ffTaxCuts.pdf 10. http://www.vancouversun.com/business/good+business+business+should+tell/187258 2/story.html 11. http://www.theprovince.com/news/Revenue+neutral+levy+could+pull+200m/186476 6/story.html 12. http://www.strategicthoughts.com/record2009/HSTbase.html 13. Alberta Budget Eliminates Health-Care Premiums 14. Canada Revenue Agency 15. http://www.vancouver-real-estate-direct.com/HST/index.html) 16. http://vancouver.ca/aboutvan.htm 17. OECD, 2005 data 18. Deloitte country guide Canada tax 19. PMG Canada tax 20. http://www.Taxtips.ca 21. https://hst.blog.gov.bc.ca/wp-content/uploads/2010/05/GST_PST_HST_List_v04.pdf 52   
  • 53.
    DMC Dayarayan Management &Consulting LTD is a Canadian company which provides full company services including company registration, management, and financial services. With our head quarter in Vancouver, we can even provide Canadian bank account opening and other confidential services which protect our clients. Our Services: Worldwide Companies Registration Bank Account Opening Annual Renewal, Accounting and Auditing etc HK Company: Services include Annual Return, Accounting and internal Auditing, Tax return, Change of Shareholder(s) or Director(s), Company Suspension or Termination, etc. Investment Consulting Management Consultancy Company formation(IBC , BVI) Management of offshore entities Tax Advice - Canada & International Representation, Nominee & Trustee Services Company Secretarial & Legal Services Administration & Professional Services Banking Support Services Accounting Services CONTACT US:Dayarayan Management & CONSULTING (LTD) 809-168 Esplanade East, North Vancouver V7L 4X8 Vancouver. British Columbia. Canada Tel: 1604-9833704 Cell: 778-861-1340 Cell: 17788295504 Website: www.dayarayan.ca Email: info@dayarayan.ca Dayarayan.ca@gmail.com 53   
  • 54.
    Dayarayans’ publication inEnglish: 1- Canada Taxation 2012 2- Canada Taxation 2011 3- Canada Taxation 2010 4- Canada Taxation 2009 5- Doing business in Iran 6- Canada Tax Guide 2008 7- World Economy Index 2007 Find US: 1. www.dayarayan.net 2. www.dayarayan.ca/portal 3. www.dayarayan.info 4. icaew.com/index.cfm/route/156616/icaew_ga/en/Library/... 5. dayarayanmanagementconsultingltd.blogspot.com 6. www.estandardsforum.org/iran/.../international-standards-on-auditing 7. www.docstoc.com/docs/11040469/tax-guide-in-Canada 8. dayarayanmanagementconsultingltd.blogspot.com/.../canada-tax-revenue.html 9. www.iadvisory.gov.sg/upload/Doing_Business_in_Iran.pdf 10. http://www.taxtips.ca/busdir/businessconsulting/bc.htm 11. http://tarazaccounting.blogspot.com/ 12. www.worldwide-tax.com/iran/iran_tax.asp 13. http://dayarayanias.blogfa.com/ 14. http://dayarayanmanagementconsultingltd.blogspot.com/2010/03/hst-in-british- colunmbia-2010.html 15. http://dayarayanvancouver.blogspot.com/2009/11/bc-property-tax.html 16. www.linkedin.com/pub/dayarayan-auditing-dayarayan/4/a5a/782 17. finance.groups.yahoo.com/group/Daya-accountants 18. iadvisory.gov.sg/upload/Establishing_a_Joint_Stock_Compan 19. ifac.org/PAIB/relevant_links.php?sort=title&...+Standards 20. totallytax.com/.../Middle_East_Tax_Advisers 21. www.prweb.com/releases/2006/05/prweb383409.htm 22. http://www.iacpa.ir/tabid/160/articleType/ArticleView/articleId/333/Doing-Business-in- Iran.aspx 23. cnv.org/c/DATA/2/19/2010 BUSINESS LICENCES ISSUED – ALPHA 24. http://www.cnv.org/c/DATA/2/19/2010%20BUSINESS%20LICENCES%20ISSUED%2 0-%20ALPHABETICAL.PDF 25. www.doingbusiness.org/LocalPartners/SearchResults.aspx?economyid=91   54