Download to read offline
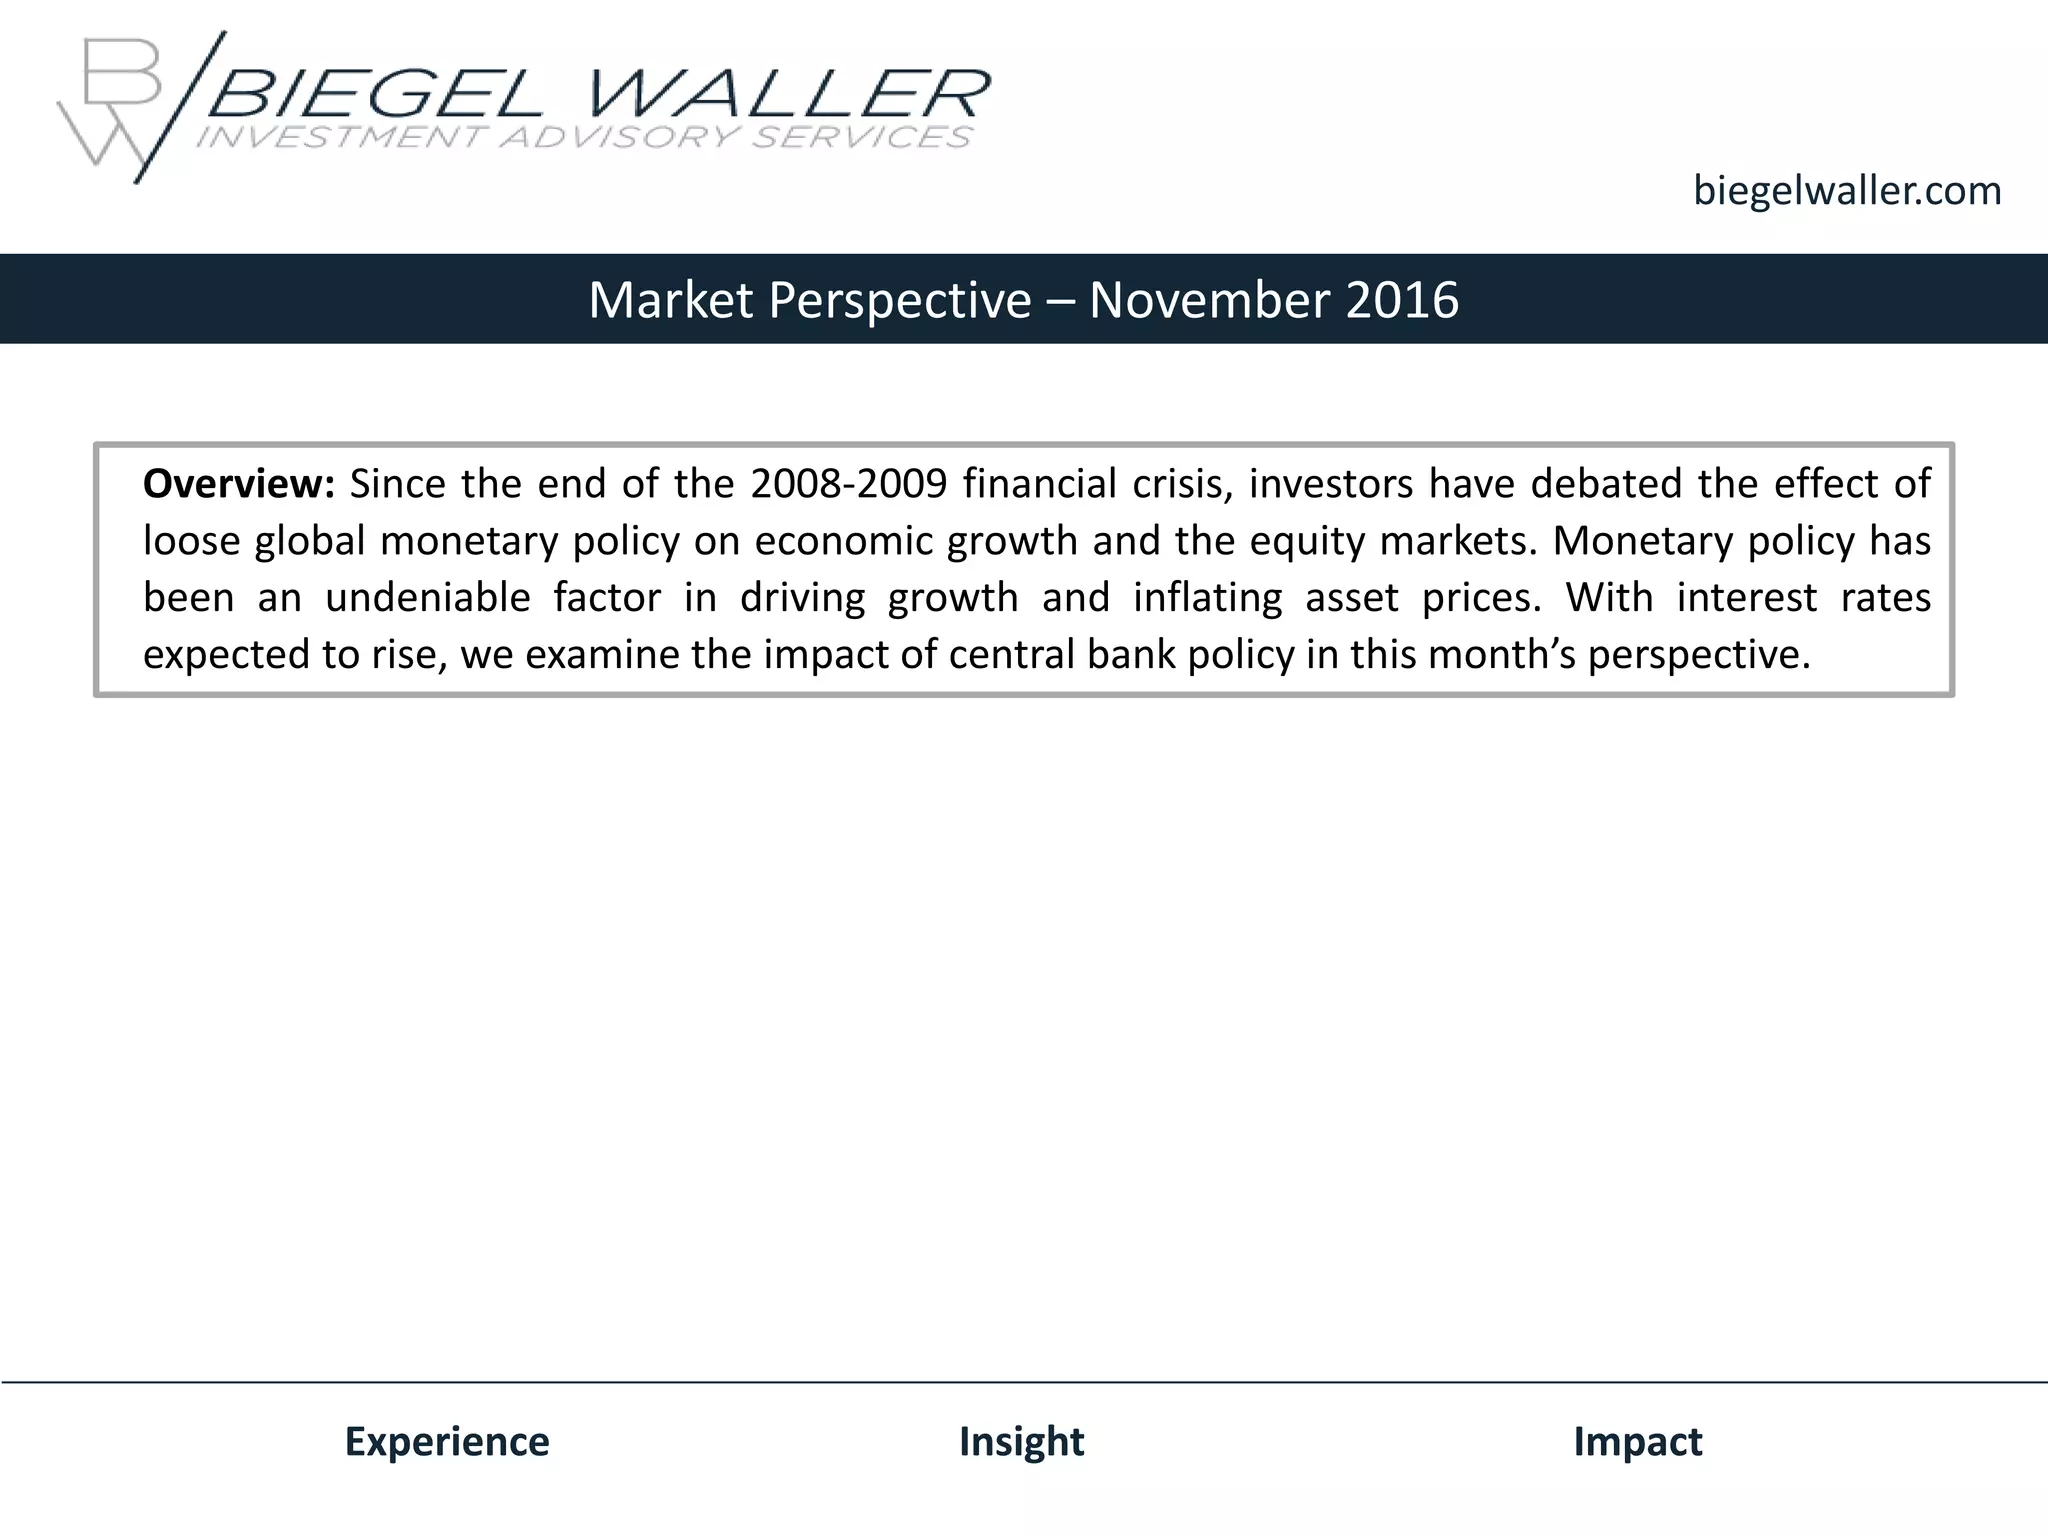
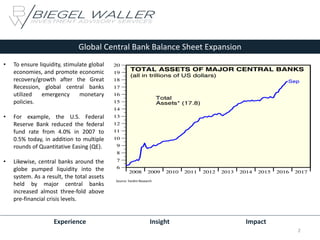
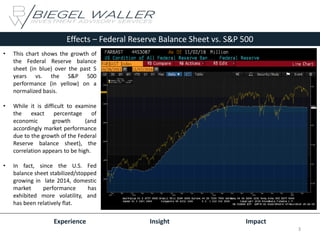

This document discusses the impact of loose global monetary policy on economic growth and equity markets since the 2008 financial crisis. Central banks around the world expanded their balance sheets significantly through measures like quantitative easing to stimulate their economies. This monetary expansion appears highly correlated with rising asset prices and market performance. However, as interest rates are expected to rise, the effects of tightening monetary policy on market volatility and asset price appreciation require careful portfolio positioning.