Download to read offline


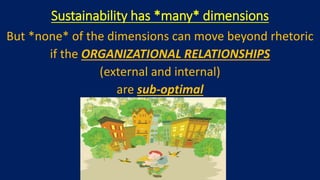
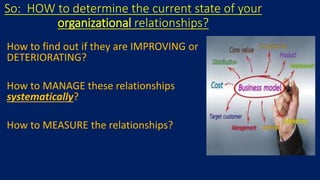
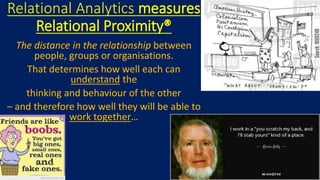
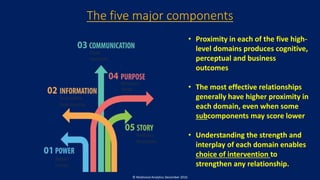
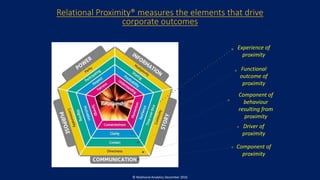
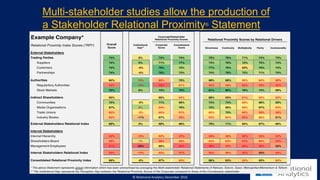

The document outlines the importance of relational analytics in assessing and improving organizational relationships, which are crucial for sustainability. It discusses how relational proximity® measures the quality of relationships between individuals and groups, impacting their ability to collaborate effectively. Additionally, it identifies five major components influencing relationship outcomes and emphasizes the need for systematic management and measurement of these relationships.


