Download as PDF, PPTX


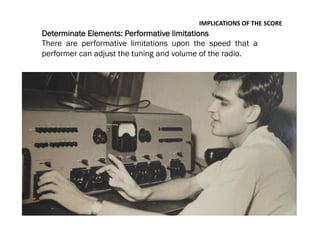
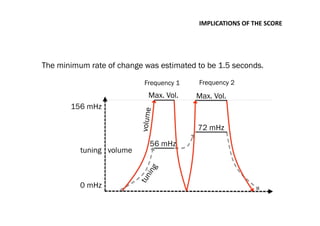
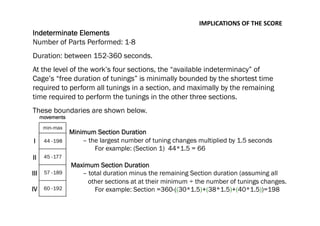

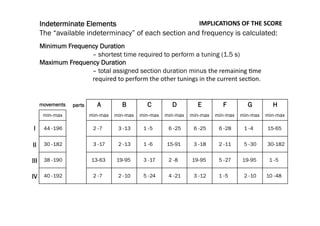


This document discusses the adaptation of John Cage's 'Radio Music' for digital performance, outlining the various parameters and scores involved. It examines the concepts of indeterminacy, performance limitations, and the structuring of formal elements within Cage's original compositions. Additionally, it provides detailed insights into frequency changes and their implications for performance duration and experience.


![[Best]Chromatic Tuner Project Final Report](https://cdn.slidesharecdn.com/ss_thumbnails/ff831f57-bde2-4b40-b97c-341dc0b202fd-150622223651-lva1-app6891-thumbnail.jpg?width=640&height=640&fit=bounds)