This document discusses generating a realistic estimate of annual typical daily solar photovoltaic power for urban Armidale, NSW, Australia. It analyzes solar radiation data from 1990-2012 from the Armidale Airport Weather Station to create a modified test reference year that accounts for cloudy days. Equations are used to estimate yearly electricity generation potential, annual electricity production, and daily power output for a sample photovoltaic panel system. Tables show the modified test reference year solar radiation values and estimated daily power outputs, providing a more accurate representation of expected photovoltaic power generation in Armidale compared to typical meteorological data.
![IOSR Journal of Engineering (IOSRJEN) www.iosrjen.org
ISSN (e): 2250-3021, ISSN (p): 2278-8719
Vol. 04, Issue 09 (September. 2014), ||V1|| PP 01-08
International organization of Scientific Research 1 | P a g e
A Realistic Estimate of Annual Typical Daily Solar Photovoltaic Power in Urban Armidale NSW, Australia
Yasser Maklad1
1(University of New England, Armidale NSW 2351 NSW Australia– School of Environmental & Rural Science - email: ymaklad@myune.edu.au)
Abstract: - Solar energy is one of the common sources of renewable and clean energy. It is really difficult to know exactly the solar radiation at any specific moment at a specific location as clouds are moving simultaneously. Clouds decays solar radiation dramatically. It is astonishingly that in different solar radiation observations are recorded in the same location or town or city due, at the same moment of time, due to the clouds’ effect. Such effect has a great influence on solar photovoltaic energy can be generated at any place during the daytime. Generally, manufacturers and suppliers of solar photovoltaic energy system considers the global solar radiation known and published for each town or city as metrological data. However, this led to and overestimation of the solar photovoltaic produced energy and represents a misleading to customers as such estimate it doesn’t consider cloudy days.
Armidale is a regional city in New South Wales (NSW) in Australia, as well it is the highest town all over Australia. This study aims to provide a justified realistic/creditable/ reliable estimate of annual typical daily solar photovoltaic power. The reason of this justification that this study depends on an accurate estimate of cloudy global solar radiationfor urban Armidale. Such estimate would be a great benefit of solar energy specialists and non-specialists households to obtain an estimate of daily potential solar photovoltaic power would likely be generated in Armidale.
Keywords: - Armidale NSW, solar Photovoltaic power, test meteorological year, test reference year, solar radiation, micro-scale energy generation
I. INTRODUCTION
Solar energy is a renewable inexhaustible clean source of energy which was used to meet residential needs of hot water, space heating and cooling, industrial needs of process heat, and agricultural needs of irrigation, drying and cooking. In general, solar energy resource is versatile and does make a significant contribution to the global energy requirements and has the premise of being one of the few, future, clean and reliable energy sources available to mankind [1, 2 & 3].
There are two main categories of solar collection options –direct and indirect. The direct delivery options do not normally require storage or fossil fuel support for small-scale applications but they would for large-scale isolated applications. Such back-up or storage could take any of several forms depending on the application, e.g. batteries, electric network or, if the desired output is heat, internal energy stored in a thermal mass to which heat can be transferred for use at a less favorable time [4 & 5].
There are various solar energy technologies such as Passive thermal systems for comfort conditions, stationary solar collector systems, solar ponds, tracking collectors, photovoltaic generators (terrestrial) and satellite power systems [6].
This study focuses on the generation of photovoltaic energy in urban Armidale NSW, Australia as a sample of regional Australian cities. This scope is selected mainly to provide micro-scale photovoltaic energy generation systems’ designers an annual realistic mean daily photovoltaic power.
II. DATA AND LOCATION
A previous study generated the typical meteorological year for global solar radiation [7]. This study was based on daily global solar radiations recorded during the period 1980–2012 are utilized to generate the typical solar radiation data. In Australia, meteorological observations are recorded by the Australian Bureau of Meteorology (BOM) weather stations are widely spreader in lots of cities and towns around Australia. In this study, the global solar radiation data recorded by Armidale Airport Weather Automatic Station and published on the BOM’s website where it was collected. The missing and invalid measurements account for approximately 0.01% of the whole database of global solar radiation; those were replaced with the values of preceding or subsequent days by interpolation. During the calculations process, any year found with more than ten days in any month observations not available was excluded. “Table 1” provides geographical information for Armidale town and the periods of the relevant global solar radiation data. Another previous study considered the effect of cloudy](https://image.slidesharecdn.com/a04910108-141016021031-conversion-gate02/85/A04910108-1-320.jpg)
![IOSR Journal of Engineering (IOSRJEN) www.iosrjen.org
ISSN (e): 2250-3021, ISSN (p): 2278-8719
Vol. 04, Issue 09 (September. 2014), ||V1|| PP 01-08
International organization of Scientific Research 1 | P a g e
A Realistic Estimate of Annual Typical Daily Solar Photovoltaic Power in Urban Armidale NSW, Australia
Yasser Maklad1
1(University of New England, Armidale NSW 2351 NSW Australia– School of Environmental & Rural Science - email: ymaklad@myune.edu.au)
Abstract: - Solar energy is one of the common sources of renewable and clean energy. It is really difficult to know exactly the solar radiation at any specific moment at a specific location as clouds are moving simultaneously. Clouds decays solar radiation dramatically. It is astonishingly that in different solar radiation observations are recorded in the same location or town or city due, at the same moment of time, due to the clouds’ effect. Such effect has a great influence on solar photovoltaic energy can be generated at any place during the daytime. Generally, manufacturers and suppliers of solar photovoltaic energy system considers the global solar radiation known and published for each town or city as metrological data. However, this led to and overestimation of the solar photovoltaic produced energy and represents a misleading to customers as such estimate it doesn’t consider cloudy days.
Armidale is a regional city in New South Wales (NSW) in Australia, as well it is the highest town all over Australia. This study aims to provide a justified realistic/creditable/ reliable estimate of annual typical daily solar photovoltaic power. The reason of this justification that this study depends on an accurate estimate of cloudy global solar radiationfor urban Armidale. Such estimate would be a great benefit of solar energy specialists and non-specialists households to obtain an estimate of daily potential solar photovoltaic power would likely be generated in Armidale.
Keywords: - Armidale NSW, solar Photovoltaic power, test meteorological year, test reference year, solar radiation, micro-scale energy generation
I. INTRODUCTION
Solar energy is a renewable inexhaustible clean source of energy which was used to meet residential needs of hot water, space heating and cooling, industrial needs of process heat, and agricultural needs of irrigation, drying and cooking. In general, solar energy resource is versatile and does make a significant contribution to the global energy requirements and has the premise of being one of the few, future, clean and reliable energy sources available to mankind [1, 2 & 3].
There are two main categories of solar collection options –direct and indirect. The direct delivery options do not normally require storage or fossil fuel support for small-scale applications but they would for large-scale isolated applications. Such back-up or storage could take any of several forms depending on the application, e.g. batteries, electric network or, if the desired output is heat, internal energy stored in a thermal mass to which heat can be transferred for use at a less favorable time [4 & 5].
There are various solar energy technologies such as Passive thermal systems for comfort conditions, stationary solar collector systems, solar ponds, tracking collectors, photovoltaic generators (terrestrial) and satellite power systems [6].
This study focuses on the generation of photovoltaic energy in urban Armidale NSW, Australia as a sample of regional Australian cities. This scope is selected mainly to provide micro-scale photovoltaic energy generation systems’ designers an annual realistic mean daily photovoltaic power.
II. DATA AND LOCATION
A previous study generated the typical meteorological year for global solar radiation [7]. This study was based on daily global solar radiations recorded during the period 1980–2012 are utilized to generate the typical solar radiation data. In Australia, meteorological observations are recorded by the Australian Bureau of Meteorology (BOM) weather stations are widely spreader in lots of cities and towns around Australia. In this study, the global solar radiation data recorded by Armidale Airport Weather Automatic Station and published on the BOM’s website where it was collected. The missing and invalid measurements account for approximately 0.01% of the whole database of global solar radiation; those were replaced with the values of preceding or subsequent days by interpolation. During the calculations process, any year found with more than ten days in any month observations not available was excluded. “Table 1” provides geographical information for Armidale town and the periods of the relevant global solar radiation data. Another previous study considered the effect of cloudy](https://image.slidesharecdn.com/a04910108-141016021031-conversion-gate02/75/A04910108-1-2048.jpg)
![A Realistic Estimate of Annual Typical Daily Solar Photovoltaic Power in Urban Armidale NSW,
International organization of Scientific Research 2 | P a g e
days on the annual typical meteorological solar Radiation for Armidale NSW, Australia was developed which is more realistic [8].
Figure 1 shows the location of Armidale city in New South Wales in Australia.
Table 1 Geographical and solar radiation database information of Armidale NSW, Australia
Longitude ( †E)
Latitude( †S)
Elevation (m)
Daily Global Solar Radiation Data
Period
Total years
Armidale
151.67
30.52
970-1070
1990—2012
23
Figure1 Armidale NSW, Australia location
III. METHODOLOGY
The power of solar photovoltaic can be estimated by using the following equations [9]:
E= 365PkrpHhi (1)
Where E is the yearly potential for electricity generation in kilowatt hours (kWh), Pk is the peak power of the equipment installed in kilowatts (kW), rp is the system performance ration or dating factor, and Hhi is the monthly or yearly average of daily global radiation in watt-hours (Wh). In the development of the r.sun based PVGIS web calculator, the system performance ratio (rp) utilized for mono- and polycrystalline silicon panels was 0.75.
Out= AeEe G (2)
Where Eout is the annual electricity production in kWh, Ae is the total surface area of solar cells in square meters (m2), Ee is the annual mean power conversion efficiency coefficient for each PV technology, and G is the annual total global irradiation (Wh/m2).
TC = Tamb + (T0 - 20°C) E/800Wm-2 (3)
Where TC is the photovoltaic panel temperature °C, Tamb is ambient temperature in degrees Celsius (°C), T0 is the nominal operating cell temperature at ideal conditions °C and E is the incident radiation in W/m2 at each time step.
IV. GENERATION OF A TYPICAL ANNUAL MEAN SOLAR PHOTOVOLTAIC POWER
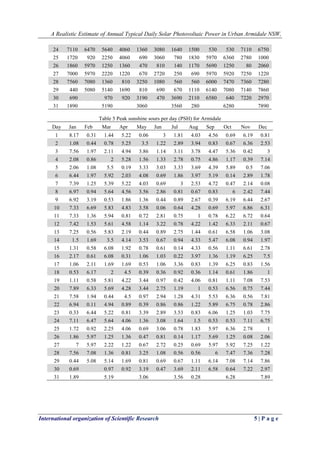
“Tables2&3” shows the test meteorological year for global solar radiation and the modified one considered cloudy days in Armidale
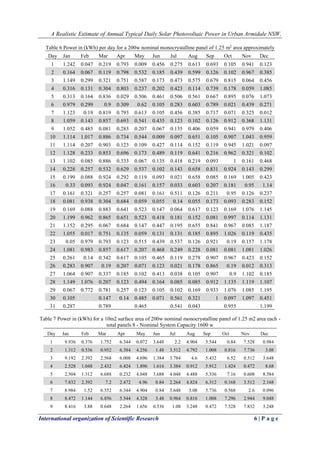
Applying the above methodology to “table 3”modified test reference year values it resulted in annual mean daily global solar radiation on a Horizontal Surface in “table 4”, peak sunshine sours per day (PSH) in table “5” and](https://image.slidesharecdn.com/a04910108-141016021031-conversion-gate02/85/A04910108-2-320.jpg)
![A Realistic Estimate of Annual Typical Daily Solar Photovoltaic Power in Urban Armidale NSW,
International organization of Scientific Research 3 | P a g e
Power in (kWh) per day for a 200w nominal monocrystalline panel of 1.25 m2 area in “table 6”.For simplification, “table 7” shows Power in (kWh) for a 10m2 surface area of 200w nominal monocrystalline panel of 1.25 m2 area each of total 8 panels with a nominal system capacity 1600 W.
Table 2 Daily global solar radiation values (MJ/m2day) obtained from Test Reference Year data for Armidale
Day
Jan
Feb
Mar
Apr
May
Jun
Jul
Aug
Sep
Oct
Nov
Dec
1
29.4
18.1
19.1
18.8
13.5
10.8
10.0
14.5
16.4
20.5
22.3
24.6 2 27.0 22.5 21.8 18.9 12.6 10.6 10.4 14.2 16.3 19.4 22.9 25.0
3
27.2
23.2
21.1
17.8
13.9
9.00
11.2
13.6
16.1
19.3
23.4
26.0 4 26.1 26.1 22.0 19.0 13.0 10.7 10.0 13.2 17.5 20.9 23.1 25.7
5
23.2
25.5
19.8
16.8
12.0
10.9
12.0
13.3
15.8
21.2
21.3
25.4 6 23.2 23.5 21.3 19.5 14.7 11.6 11.2 14.3 18.7 19.9 22.3 23.8
7
26.6
21.5
19.4
18.8
14.5
9.70
10.8
13.7
17.0
21.4
24.1
26.1 8 25.1 23.2 20.3 16.4 12.8 10.3 10.7 14.9 17.0 21.6 22.0 26.8
9
24.9
23.2
19.5
16.2
13.4
10.6
9.60
14.9
15.7
22.3
23.2
24.8 10 26.4 24.1 21.0 17.4 12.9 10.7 11.2 15.4 18.7 21.5 24.7 22.7
11
26.4
24.3
21.4
16.3
12.8
10.1
11.4
15.1
18.3
22.4
24.2
24.7 12 26.7 21.4 20.2 16.5 12.6 11.6 10.3 15.2 18.4 22.8 25.3 26.3
13
26.1
22.4
21.0
16.4
12.5
9.80
9.90
15.7
20.4
23.7
24.4
28.3 14 25.6 20.2 21.1 14.9 12.7 10.2 10.2 15.6 19.7 21.9 26.9 25.8
15
25.7
19.7
21.9
16.7
12.9
10.5
11.6
15.6
19.3
23.2
23.8
25.2 16 26.6 20.3 21.9 15.7 12.2 10.5 12.4 14.3 19.7 23.6 22.5 27.0
17
25.1
23.9
19.3
15.4
11.5
11.2
12.1
14.4
19.2
22.5
21.3
28.3 18 25.1 22.2 20.7 16.2 11.1 10.6 10.7 14.0 19.7 23.0 21.5 26.0
19
22.1
21.8
20.9
15.2
12.4
9.50
12.2
14.6
20.0
21.8
25.5
27.1 20 28.4 22.8 20.5 15.4 12.4 9.90 12.4 13.9 19.9 23.6 24.2 26.8
21
27.3
23.4
19.8
16.2
11.3
10.6
12.4
15.5
19.9
22.9
21.3
28.1 22 25.0 21.3 17.8 15.7 11.9 10.6 12.2 14.3 21.2 24.3 24.2 26.4
23
23.5
23.2
18.8
16.2
12.2
10.4
12.7
12.8
21.8
24.4
23.7
27.9 24 25.6 23.3 20.3 14.6 12.0 11.1 11.6 16.1 20.2 21.3 25.6 24.3
25
20.8
19.0
19.5
14.6
12.2
11.0
10.8
16.8
21.5
22.9
25.3
26.2 26 25.4 21.5 17.8 14.9 11.9 10.3 9.60 16.2 20.5 20.0 26.3 26.3
27
25.2
21.5
19.4
13.7
12.2
9.80
11.4
15.5
21.5
21.3
26.1
19.8 28 27.2 25.5 17.9 13.1 11.7 10.6 11.7 15.3 21.6 26.9 26.5 26.2
29
26.8
18.3
18.5
15.1
11.4
11.2
13.6
14.9
22.1
25.5
25.7
28.3 30 27.4 15.8 14.9 11.5 9.70 13.3 14.0 23.7 21.3 26.0 26.1
31
22.8
18.7
11.0
12.8
15.9
22.6
28.4
Extracted from [7]
Table 3 A Modified test reference year of global solar radiation considering cloudy days (MJ/m2day) for Armidale
Day
Jan
Feb
Mar
Apr
May
Jun
Jul
Aug
Sep
Oct
Nov
Dec
1
29.4 1.1 5.2
18.8 0.2
10.8 6.5
14.5
16.4 2.5
22.3 2.9
2 3.9 1.6 2.8
18.9
12.6 4.4
10.4
14.2 3 2.4
22.9 9.1
3
27.2 7.1 7.6
17.8
13.9 4.1
11.2
13.6
16.1
19.3 1.5 10.8
4 7.5 3.1 7.2
19 5.6 4.8
10 2.7
17.5 4.2 1.4
25.7
5 7.4 3.9
19.8 0.7
12
10.9
12
13.3
15.8
21.2 1.8
25.4
6
23.2 7.1
21.3 7.3
14.7 2.5 6.7
14.3
18.7 0.5 10.4 6.4
7
26.6 4.5
19.4
18.8
14.5 2.5
10.8 9.1
17 1.7 7.7 0.3
8
25.1 3.4
20.3
16.4
12.8
10.3 2.9 2.4 3
21.6 8.7
26.8
9
24.9 11.5 1.9 6.7 4.9 1.6 3.2 9.6 1.4
22.3
23.2 9.6
10
26.4
24.1
21
17.4
12.9 0.2 2.3
15.4 2.5
21.5
24.7
22.7
11
26.4 4.9
21.4 2.9 2.6
10.1 2.7 3.6 2.8
22.4
24.2 2.3
12
26.7 5.5
20.2
16.5 4.1
11.6 2.8
15.2 5.1
22.8 7.6 2.4](https://image.slidesharecdn.com/a04910108-141016021031-conversion-gate02/85/A04910108-3-320.jpg)
![A Realistic Estimate of Annual Typical Daily Solar Photovoltaic Power in Urban Armidale NSW,
International organization of Scientific Research 4 | P a g e
13
26.1 2
21 7.9 1.6 3.2
9.9 5.2 2.2
23.7 3.8 11.1
14 5.4 6.1 12.6
14.9
12.7 2.4 3.4
15.6
19.7
21.9 3.4 7.1
15 4.7 2.1
21.9 6.9 2.8 2.2 0.5
15.6 2 4
23.8 10
16 7.8 2.2
21.9 1.1 3.8 3.7 0.8
14.3 4.9 4.3
22.5
27
17 3.8 7.6 6.1 6.1 1.9 3.8
12.1 3 5
22.5 3 5.6
18 1.9
22.2 7.2
16.2 1.4 1.3 3.3 1.3 4.1 2.2 6.7 3.6
19 4 2.1
20.9
15.2
12.4 3.5 1.5
14.6 2.9 4
25.5
27.1
20
28.4
22.8
20.5
15.4
12.4
9.9 4.3 3.6 1.9
23.6 2.7
26.8
21
27.3 7 1.6
16.2 3.5
10.6 4.6
15.5
19.9
22.9 2
28.1
22
25 0.4
17.8 3.2 1.4 3.1 3.1 4.4
21.2
24.3 2.8 10.3
23 1.2
23.2
18.8 2.9
12.2
10.4
12.7 3
21.8 4.5 3.7
27.9
24
25.6
23.3
20.3
14.6 4.9
11.1 5.9 5.4 1.9 1.9
25.6
24.3
25 6.2 3.3 8.1
14.6 2.5
11 2.8 6.6
21.5
22.9 10 3.6
26 6.7
21.5 4.5 4.9 1.7 2.9 0.5 4.2
20.5 4.5 0.3 7.4
27
25.2
21.5 8 4.4 2.4
9.8 0.9 2.5
21.5
21.3
26.1 4.4
28
27.2
25.5 4.9 2.9
11.7 3.9 2 2
21.6
26.9
26.5
26.2
29 1.6
18.3
18.5 6.1 2.9 2.5 2.4 4
22.1
25.5
25.7
28.3
30 2.5
3.5 3.3
11.5 1.7
13.3 7.6
23.7 2.3
26 10.7
31 6.8
18.7
11
12.8 1
22.6
28.4
Extracted from [8]
Table 4 Global Solar Radiation on a Horizontal Surface (MJ/m2day) for Armidale
Day
Jan
Feb
Mar
Apr
May
Jun
Jul
Aug
Sep
Oct
Nov
Dec
1
8170
310
1440
5220
60
3000
1810
4030
4560
690
6190
810 2 1080 440 780 5250 3500 1220 2890 3940 830 670 6360 2530
3
7560
1970
2110
4940
3860
1140
3110
3780
4470
5360
420
3000 4 2080 860 2000 5280 1560 1330 2780 750 4860 1170 390 7140
5
2060
1080
5500
190
3330
3030
3330
3690
4390
5890
500
7060 6 6440 1970 5920 2030 4080 690 1860 3970 5190 140 2890 1780
7
7390
1250
5390
5220
4030
690
3000
2530
4720
470
2140
80 8 6970 940 5640 4560 3560 2860 810 670 830 6000 2420 7440
9
6920
3190
530
1860
1360
440
890
2670
390
6190
6440
2670 10 7330 6690 5830 4830 3580 60 640 4280 690 5970 6860 6310
11
7330
1360
5940
810
720
2810
750
1000
780
6220
6720
640 12 7420 1530 5610 4580 1140 3220 780 4220 1420 6330 2110 670
13
7250
560
5830
2190
440
890
2750
1440
610
6580
1060
3080 14 1500 1690 3500 4140 3530 670 940 4330 5470 6080 940 1970
15
1310
580
6080
1920
780
610
140
4330
560
1110
6610
2780 16 2170 610 6080 310 1060 1030 220 3970 1360 1190 6250 7500
17
1060
2110
1690
1690
530
1060
3360
830
1390
6250
830
1560 18 530 6170 2000 4500 390 360 920 360 1140 610 1860 1000
19
1110
580
5810
4220
3440
970
420
4060
810
1110
7080
7530 20 7890 6330 5690 4280 3440 2750 1190 1000 530 6560 750 7440
21
7580
1940
440
4500
970
2940
1280
4310
5530
6360
560
7810 22 6940 110 4940 890 390 860 860 1220 5890 6750 780 2860
23
330
6440
5220
810
3390
2890
3530
830
6060
1250
1030
7750](https://image.slidesharecdn.com/a04910108-141016021031-conversion-gate02/85/A04910108-4-320.jpg)
![A Realistic Estimate of Annual Typical Daily Solar Photovoltaic Power in Urban Armidale NSW,
International organization of Scientific Research 7 | P a g e
10 8.912 8.136 7.088 5.872 4.352 0.072 0.776 5.208 0.84 7.256 8.344 7.672
11
8.912
1.656
7.224
0.984
0.872
3.416
0.912
1.216
0.952
7.56
8.168
0.776 12 9.024 1.864 6.824 5.568 1.384 3.912 0.952 5.128 1.728 7.696 2.568 0.816
13
8.816
0.68
7.088
2.664
0.536
1.08
3.344
1.752
0.744
8
1.288
3.744 14 1.824 2.056 4.256 5.032 4.296 0.816 1.144 5.264 6.648 7.392 1.144 2.392
15
1.592
0.704
7.392
2.336
0.952
0.744
0.168
5.264
0.68
1.352
8.04
3.384 16 2.64 0.744 7.392 0.376 1.288 1.256 0.264 4.824 1.656 1.448 7.6 9.12
17
1.288
2.568
2.056
2.056
0.648
1.288
4.088
1.008
1.688
7.6
1.008
1.896 18 0.648 7.504 2.432 5.472 0.472 0.44 1.12 0.44 1.384 0.744 2.264 1.216
19
1.352
0.704
7.064
5.128
4.184
1.176
0.512
4.936
0.984
1.352
8.608
9.16 20 9.592 7.696 6.92 5.208 4.184 3.344 1.448 1.216 0.648 7.976 0.912 9.048
21
9.216
2.36
0.536
5.472
1.176
3.576
1.56
5.24
6.728
7.736
0.68
9.496 22 8.44 0.136 6.008 1.08 0.472 1.048 1.048 1.48 7.16 8.208 0.952 3.48
23
0.4
7.832
6.344
0.984
4.12
3.512
4.296
1.008
7.368
1.52
1.256
9.424 24 8.648 7.864 6.856 4.936 1.656 3.744 1.992 1.824 0.648 0.648 8.648 8.208
25
2.088
1.12
2.736
4.936
0.84
3.72
0.952
2.224
7.256
7.736
3.384
1.216 26 2.264 7.256 1.52 1.656 0.568 0.984 0.168 1.424 6.92 1.52 0.096 2.504
27
8.512
7.256
2.696
1.48
0.816
3.304
0.304
0.84
7.256
7.2
8.816
1.48 28 9.192 8.608 1.656 0.984 3.952 1.312 0.68 0.68 7.296 9.08 8.952 8.856
29
0.536
6.176
6.248
2.056
0.984
0.84
0.816
1.352
7.464
8.608
8.68
9.56 30 0.84 1.176 1.12 3.88 0.568 4.488 2.568 8 0.776 8.776 3.608
31
2.296
6.312
3.72
4.328
0.344
7.64
9.592 Total 166.21 97.52 143.47 107.42 76.19 57.66 60.26 86.90 120.81 151.37 133.93 156.18
V. CONCLUSION AND RECOMMENDATIONS
Predicting solar photovoltaic power could be generated is a sophisticated task. As clouds directly affects the solar radiation and can decay it during the daytime. This paper considered developing a realistic/reliable/creditable database of annual mead daily typical solar photovoltaic typical daily power database based on previously published generated solar radiation test reference year considering cloudy days in urban Armidale. Such consequent calculations justifies and enhance the reliability of generated solar photovoltaic power. It is a common issue that mostly new photovoltaic systems ’users gets disappointed of their solar systems’ under- performance, although the fact that they have overestimated the available solar radiation, actually, there are misled by overestimated meteorological historically recorded solar radiation at their towns or cities. This paper considered Armidale, the highest city in Australia, as a sample of Australian regional cities
Therefore, it is highly urged to base any solar photovoltaic power calculations or modelling on test reference years considering cloudy days. This would reflect the real picture of solar photovoltaic potential and would save any disappointment of not reaching the expected energy generation which is usually misled by any sort of overestimation.
It is worth mentioning that, there is a recently published study provided a realistic estimate of annual typical daily wind power for urban Armidale at heights (8, 9 & 10) meters above ground which suit micro-scale wind turbine installations [10]. Such study, in addition to this one, would provide annual typical daily generated power do both solar and wind energies which is highly recommended to be utilised while studying and designing hybrid solar and wind systems for Armidale NSW. As well, a more specialised study providing an estimate of solar radiation on tilted surfaces of angles (15, 30, 45, 60& 75) is recommended to be used by solar photovoltaic specialists and designers when considering solar systems with sun tracking devices [11].
REFERENCES
[1] Natural Resources Canada, 2001). Photovoltaics for Buildings: Opportunities for Canada. Catalogue Number M39-76/2001E, ISBN 0-662-30106-4.
[2] W. Schmidt, B. Woesten, 2000. Proceedings of the 16th European PV Solar Energy Conference, Glasgow, 1083.
[3] H. Sakata, T. Nakai, T. Baba, M. Taguchi, 2000. Proceedings of IEEE Photovoltaic Specialists](https://image.slidesharecdn.com/a04910108-141016021031-conversion-gate02/85/A04910108-7-320.jpg)
![A Realistic Estimate of Annual Typical Daily Solar Photovoltaic Power in Urban Armidale NSW,
International organization of Scientific Research 8 | P a g e
‘Conference, 7–12.
[4] J. Szlufcik, S. Sivoththaman, J. Nijs, R. Mertens, R., Van Overstraeten, 1997. Low-cost Industrial Technologies of Crystalline Silicon Solar Cells. Proceedings of the IEEE 85:711–730.
[5] R. Kawamura, K. Sasatani, T. Onizuka, K. Kameko, 1996. Proceedings of the International PVSEC-9, Miyazaki, Japan, 75–78.
[6] B. Ponomaryov, R. Ward., 1982. Layman’s Guide to New and Renewable Sources Energy. International Journal of Solar Energy, 1(5), 379-397.
[7] Y. Maklad, 2014. Generation of an Annual Typical Meteorological Solar Radiation for Armidale NSW Australia. IOSR Journal of Engineering (IOSRJEN): 4(4), 2014, 41-45.
[8] Y. Maklad, 2014. The Effect of Cloudy Days on the Annual Typical Meteorological Solar Radiation for Armidale NSW, Australia. IOSR Journal of Engineering (IOSRJEN): 4(8), 2014, 14-20.
[9] C. Carl., 2014. Calculating Solar Photovoltaic Potential on Residential Rooftops in Kailua Kona, Hawaii. Master of Science Thesis. University of Southern California. USA.
[10] Y. Makald, 2014. A Realistic Estimate of Annual Typical Daily Wind Power of different heights in Urban Armidale NSW, Australia. IOSR Journal of Engineering (IOSRJEN): 4(9).
[11] Y. Maklad, 2014. Generation of an Annual Typical Meteorological Solar Irradiance on Tilted Surfaces for Armidale NSW, Australia. IOSR Journal of Engineering (IOSRJEN): 4(7), 2014, 24-40.](https://image.slidesharecdn.com/a04910108-141016021031-conversion-gate02/85/A04910108-8-320.jpg)


