This document presents a comparative study of the mechanical properties of locally produced reinforced steel rods from scrap versus imported steel, evaluating parameters such as ultimate tensile strength, yield strength, breaking strength, and hardness, to assess compliance with international standards. It concludes that the locally made steel from scrap exhibits comparable properties to imported steel, although both types show lower ultimate tensile strength than the standard values. The research underscores the importance of studying these properties to ensure the reliability of steel for construction and engineering applications.


![Mechanical Properties Of Reinforcing Steel Rods…
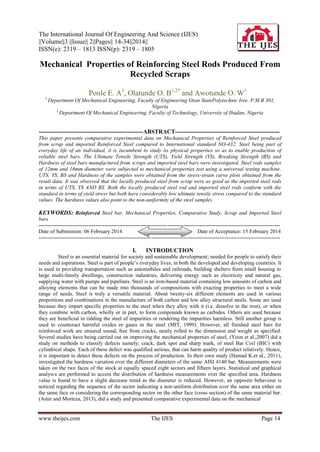
Table 18: Summary of Test Result for UTS, YS and BS
IFSM
PHSM
PSM
IM
STANDARD
12mm/1st Reading (N/cm2)
(N/cm2)
UTS
= 19224
Yield = 39743
Break/s = 34381
UTS
= 18043
Yield = 38542
Break/s = 30622
UTS
= 20678
Yield = 42647
Break/s = 35805
UTS
= 19681
Yield = 33699
Break/s = 32717
UTS
= 34000
Yield = 22500
Elongation= 20%
2nd Reading
18617
39591
31952
16072
39244
28036
20328
21939
36463
18143
44355
31211
34000
22500
20%
16mm/1st Reading (N/cm2)
2nd Reading
2
(N/cm )
17536
19124
38653
39514
31952
32477
18408
16759
34733
36591
30618
27711
13842
13913
31671
30962
23406
24809
16662
18015
42551
20744
30163
30549
42000
42000
28000
28000
20%
20%
Table 19: HARDNESS RESULTS
Sample
IFMS 16mm
IFMS 12mm
1st Reading (HRC)
242.8
284.7
2nd Reading (HRC)
247.6
289.7
3rd Reading (HRC)
240.6
288.6
Average (HRC)
243.6
287.6
IM 16mm
IM 16mm
301.7
295.5
300.9
300.5
294.5
298.0
299.0
298.0
PHSM 16mm
PHSM 12mm
269.7
256.3
267.4
258.6
272.1
260.0
269.7
258.3
PSM 16mm
PSM 12mm
229.5
290.5
234.6
288.7
232.5
290.8
232.2
290.0
IV.
CONCLUSIONS
Based on the mechanical properties experimental data obtained for the locally made steel and the
imported steel rods. The following conclusions can be drawn:
[1] The Nigerian locally made steel rods from recycled scraps showed the same mechanical properties as those
of the imported steel rods.
[2] The locally made steel and the imported steel rods showed stress values and hardness which are in
conformity with the international standards; however their ultimate tensile stress steel is below the
international standards.
[3] The variation in the hardness of the steel rods can be rationalized based on the non-uniformity in the
microstructure of the steel rods
[4] Generally, there is need for proper time to time assessment of manufactured steel rod mechanical properties
before any product is used for construction purposes to avoid the problem that may arise due to
inconsistency.
REFERENCES
[1]
[2]
[3]
[4]
[5]
Amir M. Alani, Morteza Aboutalebi, (2013). Mechanical Properties of Fibre Reinforced Concrete - A Comparative Experimental
Study. World Academy of Science, Engineering and Technology. International Journal of Civil Science and Engineering. Vol. 7.
No. 9. Pp 197-202
Anthony Nkem Ede. (2010), Building Collapse in Nigeria, International Journal for Civil and Environmental Vol. 10 No. 0632.
British Standard, BS 449. (1997): Reinforcement bar, Jentagu Venture, www. Jentaguventure.com
Hamad K. Al-Khalid, Ayman M. Alaskari and Samy E. Oraby, (2011). Hardness Variations as Affected by Bar Diameter of AISI
4140 Steel. World Academy of Science, Engineering and Technology. Vol. 51. Pp. 03-29
MIT Department of Civil and Environmental Engineering, (1999). Design of Steel Structures. Pp 1-2
www.theijes.com
The IJES
Page 33](https://image.slidesharecdn.com/c032030014034-140228051657-phpapp02/85/C032030014034-20-320.jpg)
![Mechanical Properties Of Reinforcing Steel Rods…
[6]
[7]
[8]
[9]
[10]
NIS 117 – 1992, (1992), Specification for steel bars for reinforcement of concrete. Nigerian Industrial Standards Organization of
Nigeria (SON) Abuja, Nigeria.
Ponle E. A, Olatunde O. B and Fatukasi S. O, (2014). Investigation on the Chemical Analysis of Reinforcing Steel Rods Produced
From Recycled Scraps. Accepted by Journal of Chemical and Process Engineering Research, ISSN (Paper) 2224-7467.
Unpublished.
Sittichai K., Santirat N., and Sompong., P, (2012). A Study of Gas Metal Arc Welding Affecting
Mechanical Properties of Austenitic Stainless Steel AISI 304. World Academy of Science, Engineering and Technology. Vol. 61,
Pp. 01-23
Yeon Tak Kim, Jong Pil Yun, Boyeul Seo, Youngsu Park, and Sang Woo Kim. (2007), A Classification Algorithm for Steel Bar in
Coil using Wavelet Transform. World Academy of Science, Engineering and Technology. Vol. 9, Pp. 09-23.
www.theijes.com
The IJES
Page 34](https://image.slidesharecdn.com/c032030014034-140228051657-phpapp02/85/C032030014034-21-320.jpg)


