
Recommended
More Related Content
Similar to C H A P T E R8 How Do We Pay forSocial Welfare Policiesa.docx
Similar to C H A P T E R8 How Do We Pay forSocial Welfare Policiesa.docx (20)
More from humphrieskalyn
More from humphrieskalyn (20)
Recently uploaded
Recently uploaded (20)
C H A P T E R8 How Do We Pay forSocial Welfare Policiesa.docx
- 1. C H A P T E R 8 How Do We Pay forSocial Welfare Policies and Programs? Analysis of Financing Introduction We begin this chapter by raising three basic questions and then give criteria for analyz- ing funding that will guide the analyst in sorting out the components of program fund- ing. We summarize the major sources of funding and then examine these alternative funding arrangements as they apply to program examples. Beginning Questions and Criteria for Analysis of Financing The following three basic questions outline the inquiry into understanding how social policy and program financing works, the positives and negatives of different approaches, and areas prime for modification and change. The criteria included are the same economic criteria we have used throughout the text— adequacy, equity, and efficiency/effectiveness. 1. Where does the funding come from? � classification and categories of funding sources � equitability in funding approaches
- 2. 172 IS B N : 0 -5 3 6 -1 2 1 1 2 -5 Social Policy and Social Programs: A Method for the Practical Public Policy Analyst, Fourth Edition, by Donald E. Chambers and Kenneth R. Wedel. Published by Allyn and Bacon. Copyright © 2005 by Pearson Education, Inc. 2. What is the amount of funding? � policy and program expenditures � adequacy of funding measures 3. What approaches are used to fund programs? � means of appropriation or reimbursement � efficiency/effectiveness
- 3. Table 8.1 shows a classification of the funding sources available to finance social welfare programs. We will also use this schema of funding sources as the framework for de- scription, analysis, and discussion of funding options. Private Marketplace In Chapter 1 we pointed out that the very notion of social policy suggests a collective, rather than individual, approach to social problems. However, there is a strong underly- ing philosophy in our society that individuals and families pay their own way when they have the means to do so. Examples like the following are familiar. When Margaret Smith could no longer maintain herself in her own home, her children arranged for long-term C H A P T E R 8 / How Do We Pay for Social Welfare Policies and Programs? 173 TABLE 8.1 Funding Sources for Social Welfare Source Private Marketplace Private Giving Work-Attached Benefit Funding Social Insurance Public/Government
- 4. Funding Policy and Program Basic Element 1. out-of-pocket payment for services/benefits 1. giving by individuals 2. bequests 3. service clubs 4. other charitable service-oriented giving 5. corporations 6. foundations 7. consolidated community fund raising 1. health care insurance 2. retirement funds 3. other work-attached fringe benefits 1. tax on employees and employers 2. tax on self-employed 3. tax on employers 1. federal taxes 2. state and local taxes 3. fees and other revenue IS B N : 0 -5 3
- 5. 6 -1 2 1 1 2 -5 Social Policy and Social Programs: A Method for the Practical Public Policy Analyst, Fourth Edition, by Donald E. Chambers and Kenneth R. Wedel. Published by Allyn and Bacon. Copyright © 2005 by Pearson Education, Inc. care at Resthaven Home. Ms. Smith has no resources other than her 75-year-old house. She does receive a monthly Social Security benefit, but it is not enough to pay the full Resthaven monthly fee. Her family arranged for the sale of the house and has committed to pooling resources to pay for Ms. Smith’s care without any outside funding assistance. Rose and Joe Clark’s 14-year-old son has suffered from emotional problems and their family doctor has made a referral to Hilltop Counseling Center. At this time only Rose Clark is working, but there is no provision in her basic health insurance to pay for counseling regarding emotional problems experienced by dependents. The Clarks have met with Hilltop administrators and have worked out a plan to pay for the needed coun- seling by making monthly payments for the counseling service.
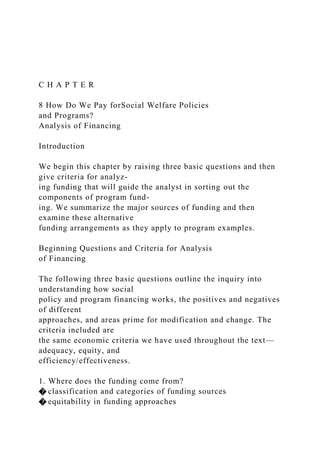
- 6. The family qualifies for a discount on cost of service, and a sliding-fee scale determines the scheduled amount the Clarks pay each month. Each of these examples represents an individual or family dealing with social problems via the private marketplace. Private Funding Private sector financing of social welfare is evidenced in a diverse array of individuals and organizations. Included in this category are the following: charitable giving and bequests by individuals and families; support of religious congregations and other faith-based entities; agency-based and community-wide fund-raising initiatives; philanthropic giv- ing by foundations and corporations; and contributing roles by fraternal organizations and other social associations or groups. Added together, the financial and in-kind contri- butions from the private sector represent important sources of funding for the nation’s social welfare initiatives, particularly through the underwriting of nonprofit human ser- vice agencies. According to figures from the American Association of Fundraising Coun- sel (AAFRC) Trust for Philanthropy, all giving totaled $240.92 billion in 2002.1 Figure 8.1 shows the sources of contributions by percentage of total and the amounts given. Giving by Individuals Individuals are the most important source of contributions as shown in Figure 8.1. Col- lectively, individuals gave $183.73 billion, or 76.3 percent of
- 7. total contributions in 2002. However, not all contributions made by individuals to nonprofits are earmarked for programs we would call social welfare programs or social policy initiatives. In fact, only a little over 20 percent goes to support human services, health, and public/society ben- efits combined. The largest portion (35 percent) goes to religion.2 An unknown pro- portion of contributions going to religion may end up supporting what we would consider “social welfare programs.” Sectarian social service agencies receive some support from their parent fund- raising organizations. Jewish family and children’s service programs receive assistance from United Jewish Communities (formerly United Jewish Appeal). Catholic social ser- vices are supported, in part, by Catholic Charities USA. Lutheran social services bene- fit from Lutheran World Relief. However, all three of these organizations’ local social service programs depend heavily on other sources of funding— increasingly govern- ment funds for services purchased from them by public social agencies. Catholic Char- 174 P A R T T W O / A Style of Policy Analysis IS B N : 0
- 8. -5 3 6 -1 2 1 1 2 -5 Social Policy and Social Programs: A Method for the Practical Public Policy Analyst, Fourth Edition, by Donald E. Chambers and Kenneth R. Wedel. Published by Allyn and Bacon. Copyright © 2005 by Pearson Education, Inc. ities, for example, received 64 percent of its funding in 1996 from federal, state, and local governmental sources; only 5 percent of funding came from the Catholic Church.3 At the congregational level, financial assistance is made available to faith-based pro- grams and services. One large sectarian group, the Baptist Church, is a major proponent of separation of church and state and church leaders disapprove accepting governmen- tal funds for their social programs. Local Baptist congregations help to fund children’s homes and other services. What motivates people to give to nonprofit organizations? Three themes can be identified: a sense of personal responsibility to others, a
- 9. person’s relationships with oth- ers, and personal benefits such as receiving recognition, tax breaks, or pleasing an employer.4 Not all giving involves a financial contribution or provision of in-kind re- sources. Countless individuals contribute to social welfare agencies as members of boards of directors and advisory committee members, volunteers who contribute pro- fessional and other services, delivering meals, providing clients/consumers with trans- portation, and a host of other support activities. Important also to fund-raisers for nonprofit organizations are reasons people do not give. Findings from a national study indicate that the major reasons people do not give are lack of money, lack of trust in a charity, and a charity’s misuse of funds.5 Charitable giving by individuals is made easy. A working individual will find it very convenient to contribute to an appeal such as United Way when the employer agrees to withhold a portion of the individual’s paycheck for that purpose. Simply checking the appropriate box will set up ongoing charitable giving arranged by some C H A P T E R 8 / How Do We Pay for Social Welfare Policies and Programs? 175 Individuals, $183.73 (76%) Corporations,
- 10. $12.19 (5%) Foundations, $26.90 (11%) Bequests, $18.10 (8%) FIGURE 8.1 Sources of contributions for philanthropy in 2002 (in $billions). Source: Giving-USA 2003/AAFRC Trust for Philanthropy IS B N : 0 -5 3 6 -1 2 1 1 2 -5 Social Policy and Social Programs: A Method for the Practical Public Policy Analyst, Fourth Edition, by Donald E. Chambers and Kenneth R. Wedel. Published by Allyn and
- 11. Bacon. Copyright © 2005 by Pearson Education, Inc. utilities. Dropping coins or bills in Salvation Army kettles at holiday seasons requires little effort or forethought. The opportunities for giving are so easy, in fact, that there is need for constant vigilance to ensure that one is not being misled and contributing to a cause that is dishonest or has unreasonable administrative costs attached. States’ attorney generals are kept busy addressing scams and fraudulent activities in the name of charity. Bequests Closely related to the category of individual giving are bequests by individuals and fami- lies. As shown in Figure 8.1, contributions in the form of bequests amounted to 7.5 per- cent in 2002. A bequest involves leaving property or other resources designated in a last will and testament. Bequests enjoy popularity with individuals and families who have a strong commitment to a cause and also the ability to realize a tax advantage by giving. The tax saving usually results when estate tax is offset at the time of an individual’s death. There are five basic forms of bequests: (1) unrestricted or general, (2) special bequests, (3) endowed bequests, (4) residual bequests, and (5) contingent bequests. Unrestricted bequests specify a certain dollar amount of property, usually cash, to be utilized for gen- eral purposes of the receiving organization. Special bequests are
- 12. designated to support a specific program or project. Endowed bequests are established to provide a permanent fund for meeting the organization’s general needs or a specific program or project—often established as a named fund. Residual bequests designate all or a portion of whatever re- mains after all debts, taxes, residue, and remainder of an estate. Finally, a contingent be- quest takes effect only under certain conditions, for example, specified terms in the event that a spouse (or other) does not survive the person making the bequest. Service Clubs For many individuals, service clubs provide an outlet for volunteer involvement in char- itable giving and community service. Service clubs come in a wide variety and have dif- fering goals. Some are local in focus and others have a global mission. Many, if not the majority, have a selected area of service (and fund-raising) for which they have become recognized. Several examples of popular service clubs that are involved in fund raising and service projects are Alpha Phi Omega, Kiwanis, Lions, Rotary, and Exchange. Other Charitable Service-Oriented Organizations There is also a diverse network of other organizations that play a role in charitable giving—far too many to list. Some have religious links, others are independent entities, and some are organizations that are quasi-public or public in nature. Examples of ser- vice organizations that have strong links to religious institutions
- 13. or a historical religious beginning are the Shrine and Knights of Columbus. The Shrine of North America was founded by a group of men belonging to the Masonic Order. The Shrine operates a net- work of specialized Shriners Hospitals for Children (twenty in the United States and one each in Mexico and Canada) that treat children with orthopedic problems, burns, and spinal cord injuries, up to their eighteenth birthday, free of charge.6 Funding for the 176 P A R T T W O / A Style of Policy Analysis IS B N : 0 -5 3 6 -1 2 1 1 2 -5 Social Policy and Social Programs: A Method for the Practical Public Policy Analyst, Fourth Edition, by Donald E. Chambers and Kenneth R. Wedel. Published by Allyn and Bacon. Copyright © 2005 by Pearson Education, Inc.
- 14. Shriners Hospitals and care for patients is financed primarily through the Shriners Hos- pitals for Children Endowment Fund, which is maintained through gifts and bequests (by Shriners and non-Shriners alike). The Knights of Columbus is the largest lay orga- nization in the Catholic Church. Charitable giving in 2002 is reported at $128.5 million raised and distributed, and 60.8 million hours of volunteer service.7 The categories of financial support are church support, community support (Special Olympics, programs for people with mental retardation or other mental and physical disabilities, disaster re- lief, and hospitals and related programs), and youth support (including World Youth Day, youth athletics, and scholarships and related programs). Early in his career, entertainer Danny Thomas was inspired by St. Jude Thaddeus, the patron saint of hopeless causes. Upon achieving success, Thomas fulfilled a pledge to build a shrine to St. Jude. Through cooperation with the American Lebanese Syrian Associated Charities (ALSAC), a national fund-raising organization, Thomas estab- lished St. Jude Children’s Research Hospital. The mission of St. Jude is to help find cures for children with catastrophic illnesses through research and treatment. Cost for patient care is covered by third-party insurance payments, and the ALSAC covers the expense for patients who do not have health care insurance.
- 15. Finally, there are service programs that are part of the public Corporation for Na- tional and Community Service funded through the National and Community Service Trust Act of 1993. The emphasis of these programs is on volunteerism. AmeriCorps is a network of three national service programs (AmeriCorps State and National, Ameri- Corps Vista, and AmeriCorps National Civilian Community Corps). These programs engage individual volunteers in services to meet needs in education, public safety, health, and the environment. Senior Corps is a network of three national service pro- grams that provide older Americans the opportunity to put their life experiences to work meeting community needs as mentors, tutors, and caregivers for at-risk and special needs populations. The programs of Senior Corps are Foster Grandparent Program, Senior Companion Program, and the Retired and Senior Volunteer Program (RSVP). Corporations Corporations account for a smaller overall percentage but nevertheless are an important source of contributions to charity. As shown in Figure 8.1, corporations’ giving amounted to 5 percent of total contributions in 2002. Corporate giving involves a wide variety of business-sponsored philanthropic efforts, which Lauffer points out are “often described as the exercise of social responsibility that is good for business.”8 In addition to giving grants and gifts to selected nonprofit sector agencies,
- 16. corporate leaders often become involved in community fund-raising efforts, and volunteer their services for nonprofit organizational improvement strategies such as planning, cost cutting, moni- toring, and evaluating. Foundations Foundations are another major source of financial support from the private sector for social welfare programs. Foundations are required by law to spend 5 percent of their assets annually. As shown in Figure 8.1, contributions by foundations amounted to 11 C H A P T E R 8 / How Do We Pay for Social Welfare Policies and Programs? 177 IS B N : 0 -5 3 6 -1 2 1 1 2 -5
- 17. Social Policy and Social Programs: A Method for the Practical Public Policy Analyst, Fourth Edition, by Donald E. Chambers and Kenneth R. Wedel. Published by Allyn and Bacon. Copyright © 2005 by Pearson Education, Inc. percent of total contributions in 2002. According to the Foundation Directory, there are four different types of foundations: (1) independent, (2) company sponsored, (3) oper- ating, and (4) community.9 Independent foundations are grant- making organizations established to aid social, educational, religious, or other charitable activities. Financial support for independent foundations generally comes from a single source such as an individual, family, or group of individuals. These foundations tend to have broad dis- cretionary giving practices; however, a large proportion of them limit their giving to a local area. Company-sponsored foundations are grant-making organizations with close ties to the corporation providing the funding. Giving practices of company-sponsored foundations tend to be in fields related to corporate activities or in communities where the corporation operates. Operating foundations use their resources to conduct re- search or provide a direct service. They are usually funded by a single source and make few, if any, grants. Community foundations are publicly sponsored organizations that make grants for social, educational, religious, or other charitable purposes in a specific community or region. Contributions come from many donors,
- 18. including individuals, corporations, and other foundations. Community foundation grants are generally lim- ited to charitable organizations in the local community of the foundation. In addition to charitable organizations and foundations, other venues for private sector giving include agency-based and community fund-raising efforts. We examine them next. Agency-Based Fund-Raising Social agencies across the country engage in fund-raising events to finance their pro- grams and services. In many cases an annual campaign is scheduled and individual so- licitations are planned. Board members are generally expected to participate and contribute financially, at least symbolically. Other common methods for fund-raising are garage sales, golf tournaments, car washes, entertainment events, and raffles. Community Fund-Raising The history of federated community approaches to charitable fund-raising dates back to the late nineteenth century and the Charity Organization Societies (COSs). The COS movement was dedicated to developing improved ways to manage fund-raising for charity and promote scientific management principles in the delivery of services fi- nanced by fund-raising efforts. By the late 1920s Community Chests had replaced vir- tually all COSs, and more than 300 communities had established
- 19. their own chests to centralize fund-raising and allocate funds to service agencies.10 Today the dominant en- tity for community fund-raising is the United Way. In some communities United Way and Community Chest have been merged, with both organizational names used in pro- motional materials. A few communities continue to operate only a Community Chest, though the approach taken in fund-raising is similar to that described for United Way. The United Way movement consists of approximately 1,400 local community- based United Way member organizations and a national leadership organization, United Way of America. Each local community United Way is independent and gov- 178 P A R T T W O / A Style of Policy Analysis IS B N : 0 -5 3 6 -1 2 1 1
- 20. 2 -5 Social Policy and Social Programs: A Method for the Practical Public Policy Analyst, Fourth Edition, by Donald E. Chambers and Kenneth R. Wedel. Published by Allyn and Bacon. Copyright © 2005 by Pearson Education, Inc. erned and operated by local volunteers. Larger United Ways typically also have trained staff involved as social planners, fund-raisers, accountants, and specialists in various practice areas. The mission of United Way is “to improve people’s lives by mobilizing the caring power of communities.”11 In addition to annual fund- raising campaigns, local United Ways become involved in the identification of critical local issues and mo- bilization of resources through networking with community partners such as schools, government policy makers, businesses, organized labor, financial institutions, volun- tary and neighborhood associations, community development corporations, and the faith community. The 2000–2001 United Way annual campaigns totaled $3.91 billion, with another $1 billion in resources leveraged beyond the campaigns (gifts for mobi- lization of special national projects, government grants to support critical community- based health and human services, sponsorship of special initiatives, bequests and planned gifts, and volunteer time).12 When community-wide fund-raising campaigns
- 21. take place, member agencies follow guidelines of agreement not to carry out their own fund-raising activities in competition with the community-wide effort. Summary on Adequacy, Equity, and Efficiency for Private Funding. Private funding of social welfare in the United States is a useful ingredient in the overall mix for financing social welfare.13 The various elements that make up private funding represent values critical to preserving the pluralist society in which we live. Important as private funding is, there is little evidence to support a view that there is the potential to finance the entire social welfare system through private funding, even with massive cutbacks in programs, benefits, and services. Giving by individuals, corporations, and foundations is prone to sensitivities in the general state of the economy. In periods of economic growth, increases in wages and profits stimulate philanthropy. There are also times when charitable giving tends to ebb. When the economy weakens and unemployment increases, benefits and services funded by private charity are needed the most. This dynamic alone raises serious doubt about any position suggesting that private charity can replace large cuts in benefits and ser- vices for the needy—a philosophy promoted during the Reagan administration. Finally, we raise the issue of adequacy when it comes to funding for the private voluntary sector. Although there are no specific benchmarks by which to measure
- 22. adequacy in this area, examination of funding trends can be beneficial. A particularly helpful resource for in- formation on private charitable giving from a national perspective can be found in the annual reports of the American Association of Fundraising Counsel (AFRC) Trust for Philanthropy. They provide a detailed analysis of giving trends from a historical per- spective, including giving by individuals, corporations, and foundations. Another good source of information is the Foundation Center, which publishes Foundation Giving Trends. At the local level, the policy analyst will find useful information on the adequacy of private funding sources in community fund-raising campaign reports, audits of char- itable giving organizations, and budgetary information from the private nonprofit ser- vice agencies that receive funding. The public legislative and judicial arenas can have an influence on the adequacy of private funding. Tax laws and regulations in particular influence incentives to give. An example is the CARE Act debated in Congress in 2003. Advocates promote this kind of C H A P T E R 8 / How Do We Pay for Social Welfare Policies and Programs? 179 IS B N :
- 23. 0 -5 3 6 -1 2 1 1 2 -5 Social Policy and Social Programs: A Method for the Practical Public Policy Analyst, Fourth Edition, by Donald E. Chambers and Kenneth R. Wedel. Published by Allyn and Bacon. Copyright © 2005 by Pearson Education, Inc. legislation as designed, in part, to stimulate charitable giving.14 Critics fear that such measures support a new equation for charities: “More money, less oversight.”15 As noted previously, laws and regulations require foundations to divest a percentage of their holdings each year or suffer tax penalties. Individual charitable giving and bequests offer significant tax deductions to givers. Equity is not particularly an objective in private charitable funding. Individuals give to the causes in which they are interested or out of specific value commitments— their church or religious cause, the cause of their social club or organization, an appeal
- 24. to feed hungry children, and so on. Corporations and foundations are free to select whichever special interest suits their fancy. Perhaps the closest example of attention to equity occurs in the case of community fund-raising. Even in the case of community fund-raising, however, there tends to be a bias toward supporting more traditional so- cial programs over emergent grassroots initiatives that serve clients/consumers that are often considered community deviants—substance abusers, persons with HIV or AIDS, delinquent youth, and so on. One way to enhance issues of equity in community fund- raising and appropriations is for social workers and other human service personnel to become involved in advocacy efforts on behalf of individuals and families whose plight is not being addressed by either the public or private sector. A lack of public oversight for private giving, coupled with legal loopholes, some- times leads to abusive practices on the part of fund-raising organizations. The Internal Revenue Service (IRS) is the major federal agency concerned with charities’ accounting practices. A relatively small proportion of IRS officials are deployed to audit charities and other tax-exempt organizations. The situation isn’t much different at the state level. Especially revolting to individual givers is media attention to the salaries of executives and board members of some charities and foundations.16 The high salaries may be per- fectly legal, but the policy analyst can raise serious questions about the efficiency of
- 25. charitable organizations when they spend large amounts of donated money on salaries and other overhead costs. Private funding is a mix when it comes to efficiency and effectiveness. In some cases the act of giving and funding of human service programs is very clear and direct. In other cases the process may be convoluted and involve loss of resources due to ad- ministrative overhead, time delays, and other such problems. As noted previously, many of the private fund-raising organizations rely on volunteers, which can be quite efficient in terms of costs of raising money but inconsistent in effectiveness. Employee Benefit Funding Except for retirees, most people in our society who have health insurance rely on the fringe benefit package provided through their employer. There is wide variation in cov- erage and cost of the employment-related, thus “work-attached,” health insurance ben- efits. It is an example of the insurance principle in financing social policy and programming. For social workers and other human service practitioners the concept of third-party insurance takes on importance in the funding of many private nonprofit agencies. The several parties are the social service agency, the client/consumer, and the 180 P A R T T W O / A Style of Policy Analysis
- 26. IS B N : 0 -5 3 6 -1 2 1 1 2 -5 Social Policy and Social Programs: A Method for the Practical Public Policy Analyst, Fourth Edition, by Donald E. Chambers and Kenneth R. Wedel. Published by Allyn and Bacon. Copyright © 2005 by Pearson Education, Inc. third-party insurance carrier. The more comprehensive employment-related health in- surance policies, for instance, provide services for employees and their dependents for mental health, substance abuse treatment, behavioral problems, and so on. In addition to health insurance, employer-related insurance coverage often in- cludes other policies such as long-term care insurance, disability insurance, life insur-
- 27. ance, and retirement pension plans. We have become all too familiar with the vulnerability of employees to fraud and mismanagement of company retirement funds. The financial disaster at Enron Corpo- ration and subsequent loss of retirement savings for former employees is one dramatic example. There are two major vehicles for employment-related retirement plans: de- fined contribution plans, such as monthly contributions to an employee’s 401(k) fund; and defined-benefit plans, which are set up on the basis of an insurance annuity. The defined-benefit plans (pensions) are the subject of our discussion here. Concerns about questionable policies and management practice of pension plans led Congress to enact the Employee Retirement Income Security Act (ERISA) in 1974. ERISA provisions include regulation of pension plans to ensure reasonable age and ser- vice requirements for retirement, reasonable vesting period, joint and survivor provi- sions, funding provisions, accounting and management standards, legal appeal procedures, and insurance provisions. To protect pension plans, the federal government offers federal insurance for pen- sion plans through the Pension Benefit Guaranty Corporation (PBGC). The insurance is a protection of financial assets much like the Federal Deposit Insurance Corporation (FDIC), which insures individual savings accounts. The cost of
- 28. the PBGC insurance is funded primarily through pension plan premiums. When an insured pension plan is terminated, eligible beneficiaries are able to recover at least a portion of their retirement savings. However, only a little over half of all private pension plans are covered by the PBGC insurance. As of 2003, PBGC was insuring benefits worth $1.5 trillion and re- sponsible for paying current and future benefits to 783,000 people in over 3,000 termi- nated defined-benefit pension plans.17 Summary on Adequacy, Equity, and Efficiency for Employee Benefit Funding. Employee benefits have come under hard times for many people in the workforce. Funding for the social provisions of employer fringe benefits is strained in many cases. While some employees enjoy the advantages of high-quality health benefits (including such coverage as dental care, vision care, and psychiatric or counseling services), many do not. Costs for such benefits have been steadily increasing. The result is that funding for work-attached fringe benefits is eroding. Added to that is the trend of many employ- ers hiring primarily part-time employees in order to avoid paying costly fringe benefits. In the past, labor unions have been a counterbalance for protection of workers’ benefits. Although in certain areas of employment that is still the case today, in recent years union shops have lost much influence, particularly in states that have passed “right to work” laws that reduce union power and influence, and because
- 29. corporations can now bypass unions by moving jobs to low-wage countries like Mexico and China. Adequacy of funding for health care insurance has become particularly problem- atic. Escalating health care costs in the 1980s resulted in many companies turning to C H A P T E R 8 / How Do We Pay for Social Welfare Policies and Programs? 181 IS B N : 0 -5 3 6 -1 2 1 1 2 -5 Social Policy and Social Programs: A Method for the Practical Public Policy Analyst, Fourth Edition, by Donald E. Chambers and Kenneth R. Wedel. Published by Allyn and Bacon. Copyright © 2005 by Pearson Education, Inc.
- 30. managed care options. In response to health care costs spiraling in the 2000s, some em- ployers have dropped health benefits entirely. Many employers that have retained health benefits are selecting cheaper health insurance policy options with increased em- ployee copayments, deductibles, and maximum out-of-pocket costs. Another approach is the use of Health Care Reimbursement Accounts (HCRAs) or Flexible Spending Ac- counts (FSAs), which offer a tax-exempt account funded by an employee or employer and used by the employee to pay health care expenses. Gaining in popularity is the use of Consumer-Driven Health Plans (CDHPs) that shift some of the responsibility for managing health costs to employees. These plans involve employer-funded “defined- contribution” untaxed expense accounts that employees manage to pay for health ser- vices and prescription drugs. CDHPs generally also involve at least the three following features: “(1) unspent money in the account accumulates for future years; (2) the ac- count is accompanied by a high-deductible health insurance that pays for major ex- penses; and (3) the employee gets on-line support to track health care bills, maintain health, get information on provider quality, and get discounted prices.”18 “Opponents of CDHPs are concerned that these plans may take health benefits away from employ- ees, give tax breaks to the rich, and leave the chronically ill behind in tradition[al] health insurance paying higher premiums.”19
- 31. Increased concerns relate to problems of funding adequacy for work-attached de- fined benefit pension plans. Earlier in this chapter we discussed the role of the Pension Benefit Guaranty Corporation (PBGC) as an insurer of such pension plans in the pri- vate sector. Can the PBGC cover benefit costs for pension plans that fail, and can it pro- tect workers’ private pension plans? Underfunding of insured single-employer pension plans was projected at a record $400 billion in 2002. And, as a result of record pension underfunding and failure of a number of plan sponsors in mature industries, PBGC’s fi- nancial position had deteriorated to a deficit level of $5.7 billion as of July 1, 2003.20 It seems quite unlikely that PBGC can now protect workers’ private corporate pensions. Employers with defined-benefit pension plans are increasingly shifting to defined-contribution retirement plans (for example, 401(k) individual employee plans). Generally, it is a less costly and more efficient alternative for employers. It also enhances the principle of employee choice. Employees are typically given choices to consider re- garding the investment funds for their 401(k) accounts. However, experience has re- vealed an equity issue for older workers near retirement age when an employer shifts to a defined-contribution plan. The effect in some cases has been a much lower retirement benefit for an individual retiring soon after the shift in plans takes place. Another issue,
- 32. in general, confronts employees approaching retirement decisions. When the stock market is up, a retiring employee stands to realize a much bigger benefit than the em- ployee does who times his or her retirement during a market slump. Finally, there is the matter of an employee making poor choices about how to invest his or her 401(k) ac- count and realizing too late in employment history to make up such losses. The risks associated with 401(k) plans are compounded when employers practice deception or fraud. Although that may be only a small proportion of employers offering the defined-contribution retirement plans described previously, it can be devastating for the employees involved. A case in point occurred in 2001 involving the bankrupt Enron Corporation, a Houston-based energy and trading giant. Out of a sense of company loy- alty (or subtle pressure), many Enron employees had invested their 401(k) equities in 182 P A R T T W O / A Style of Policy Analysis IS B N : 0 -5 3 6
- 33. -1 2 1 1 2 -5 Social Policy and Social Programs: A Method for the Practical Public Policy Analyst, Fourth Edition, by Donald E. Chambers and Kenneth R. Wedel. Published by Allyn and Bacon. Copyright © 2005 by Pearson Education, Inc. Enron stock. When Enron began to implode due to scandalous business practices, many current and former Enron employees scrambled to sell the Enron stock in their 401(k)s. However, they were forbidden to do so during a “lockdown” period required because Enron had hired a new company to administer its 401(k) plans. By the time the lock- down period was over, Enron stock was almost worthless. Adequacy, equity, and efficiency of funding for employee benefits are influenced by the great variance in employee benefit plans. Earlier we cited that the government regulations of ERISA provide some safeguards for the adequacy and efficiency of fund- ing for pensions. In addition, ERISA regulations address the equity issue by forbidding employers from having work-attached health care or retirement benefits that discrimi- nate in favor of only one class of employee—management, for
- 34. instance. The bottom line, however, is that employers (public or private sector) are not re- quired to fund employee benefits. It is beneficial to society when they do, but whether they provide the funding for benefits, and in what amount, is discretionary and can lead to much variability in adequacy, equity, and efficiency in the policy element of financing. Social Insurance as a Publicly Mandated Funding Approach Several of the nation’s largest social programs are funded through social insurance: So- cial Security, Medicare, and Unemployment Insurance. Other examples are workers’ compensation and employment-related insurance coverage for life, health, and disabil- ity. We begin our discussion with Social Security. Social Security Old Age, Survivors and Disability Insurance (OASDI) constitutes the different program elements of what we commonly call the Social Security program. The old age element is insurance savings for retirement for those who work in employment covered under Social Security—approximately 95 percent of jobs are covered. Survivors of workers also are entitled to benefits. The disability element is insurance for disability. Social Se- curity is financed through a payroll tax for all covered workers. This payroll tax (6.2 per- cent on earnings up to $87,900 in 2004) is matched by the
- 35. worker’s employer, making a total of 12.4 percent. Self-employed individuals pay the total 12.4 percent; however, they receive a personal income tax deduction for half of it. Funds from this tax are paid to the federal government and credited to two separate trust funds, the Old Age and Survivors Trust Fund and the Disability Trust Fund. Money from the trust funds is in- vested in special interest-bearing loans to the federal government, adding to the overall amount of funding available to pay beneficiaries as they retire, their survivors, or if they become disabled. Currently there are reserves in these trust funds (combined) to carry it through 2040. To avoid exhausting the trust funds, some modifications will need to be made (but notice that Social Security is in very good shape compared to private pension funds and, in fact, is not much different from most private funds offering guaranteed an- nuities). Those modifications will involve workers paying somewhat higher payroll taxes, of course. C H A P T E R 8 / How Do We Pay for Social Welfare Policies and Programs? 183 IS B N : 0 -5
- 36. 3 6 -1 2 1 1 2 -5 Social Policy and Social Programs: A Method for the Practical Public Policy Analyst, Fourth Edition, by Donald E. Chambers and Kenneth R. Wedel. Published by Allyn and Bacon. Copyright © 2005 by Pearson Education, Inc. The OASDI program elements utilize a formula set by Congress to determine ad- equacy of funding. You will recall in the discussion of benefit analysis in Chapter 5, ben- eficiaries realize a cost-of-living-allowance (COLA) at the beginning of each year based on changes in the consumer price index. The purpose of the COLA is to keep benefit levels in pace with inflation. There is also a formula built in at the input (funding) point, which is to help maintain adequacy of funding. Each year since 1971, the cap on the salary level taxed has risen, based on a complicated formula that takes into account the existing cap level and changes in the national average wage. By way of comparison for a ten-year period, the OASDI tax cap on salary was $60,600 in 1994 and went up to $87,900 in 2004—a 45 percent increase! Funding increases have
- 37. also been made from time to time by increasing the percentage of tax paid under OASDI. In recent years, the social insurance principle has come on hard times in the So- cial Security system, largely because in past years Congress continued to expand bene- fit coverage, enacting larger benefits than were ever anticipated in earlier years when financing was being planned, and the ratio between the number of working contributors and the number of retiree beneficiaries has changed substantially. The prior contribu- tion strategy on which Social Security is based is subject to a number of problems, one of which is insensitivity to demographic changes. Currently the OASI and DI trust funds hold surplus funds, but they will eventually be paid out in benefits. Trustees for the Social Security system conduct analyses using alternative assumptions in estimates to project the future financial status of the trust funds for the short range (ten years) and long range (seventy-five years) and issue an annual report on their findings. Using a midrange set of assumptions in 2003, it was projected by the trustees that combined the OASI and DI trust funds would not reach exhaustion until 2042.21 Planning continues in the exploration for alternatives, which will ensure adequate funding for the social in- surance program elements of Social Security. Many alternative proposals include some measure of privatization (more on that later).
- 38. It is a great challenge to design a nationalized program of the magnitude of Social Security in a way to ensure perfect equity in either funding or provision of benefits. And it is a further challenge to maintain equity over the life of social insurance programs when they are set within the political process referred to earlier. Here are some exam- ples of inequities that will help the policy analyst develop a sharp eye for applying the equity criteria for funding this and other social policies and programs. Social Security taxes that fund OASDI can penalize dual-earner couples. Table 8.2 illustrates how a married couple with one wage earner compares with a dual-earner cou- ple receiving the same annual wage-based income for the family of $150,000. Recall that each wage earner in 2004 paid 6.2 percent tax for OASDI up to a salary of $87,900. Even if Mr. Smith’s salary were $1 million, his tax would still amount to $5,394. The Browns, on the other hand, would each continue paying the 6.2 percent tax until their salaries reached the $87,900 cap. Thus, the dual-earner household will pay almost twice as much OASDI tax as the single-earner household. But they will receive no more than 50 percent more benefits than if one spouse had never paid Social Security contributions at all (the maximum family benefit is approximately 150 percent of the benefit of the spouse who has the better earning record). In an insurance scheme that was absolutely faithful to the insurance principle, the married couple’s benefit
- 39. on retirement would be 184 P A R T T W O / A Style of Policy Analysis IS B N : 0 -5 3 6 -1 2 1 1 2 -5 Social Policy and Social Programs: A Method for the Practical Public Policy Analyst, Fourth Edition, by Donald E. Chambers and Kenneth R. Wedel. Published by Allyn and Bacon. Copyright © 2005 by Pearson Education, Inc. based on the contributions of both the husband and wife, plus whatever interest and div- idends accrued over the years during which the contributions were made. It must be said, however, that to date there is little actual loss on this account since the average So- cial Security beneficiary has actually paid for less than what is
- 40. received in benefits. Another example of inequity for Social Security involving both the funding and benefit side of the equation can be observed by actuarial statistics. Ethnic minorities pay- ing into the system generally have a lower life expectancy. The result is that as a group their contributions into the system do not result in as great a proportion of retirement benefits as holds true for whites. This is offset to some degree by the fact that a larger portion of ethnic minorities than whites become disabled or suffer chronic conditions and, as a result, more are able to benefit from the disability provisions of the program. The feature that makes Social Security work to the advantage of those who are re- tiring now is that (1) there are income transfers at work and (2) profitability is not a fac- tor (not least because there are no sales or marketing costs). The Social Security system is, in fact, transferring income from those who are now working to those who are no longer working, the retired, disabled, Medicare beneficiaries— and from high-wage earners to average-wage earners.22 Medicare Medicare is a federal health insurance program for persons 65 or older, persons of any age with permanent kidney failure, and certain disabled persons. Medicare insurance is composed of two parts. Part A is hospital insurance (HI), and Part B is a voluntary pro-
- 41. gram of medical insurance, which covers physicians and other medical services. In the case of both Part A and Part B of Medicare, beneficiaries are responsible for deductible and coinsurance costs. Medicare Part A is funded in the same way described earlier for Social Security. Workers pay an additional tax (1.45 percent on unlimited earnings in 2004) for HI. As in the case of Social Security, this is matched by a worker’s employer, and total of 2.9 C H A P T E R 8 / How Do We Pay for Social Welfare Policies and Programs? 185 TABLE 8.2 Inequity for Dual-Wage Earners Paying Social Security (OASDI) Tax (2003) Wages Husband Wife Total OASDI Taxes (Combined) Smiths $150,000 0 $150,000
- 42. $5,394 $5,394 Browns $75,000 $75,000 $150,000 $4,650 and $4,650 $9,300 Source: Adapted from Jonathan Barry Forman, “Promoting Fair- ness in the Social Security Retirement Program.” The Tax Lawyer, 45 (4), (1992): 933–934. Reprinted by permission. IS B N : 0 -5 3 6 -1 2 1 1 2 -5 Social Policy and Social Programs: A Method for the Practical
- 43. Public Policy Analyst, Fourth Edition, by Donald E. Chambers and Kenneth R. Wedel. Published by Allyn and Bacon. Copyright © 2005 by Pearson Education, Inc. percent for the self-employed. These social insurance tax funds are also paid to the fed- eral government and are credited to the Hospital Insurance Trust Fund. Currently, sur- plus funds exist in this trust fund but they may be exhausted even earlier than the Social Security trust funds. Projections by the Health Insurance Trustees for Medicare (health insurance) in 2000 estimated that under current program operations the health insur- ance trust fund would be exhausted by 2025.23 Persons who are 65 years old but do not have 40 or more quarters of Medicare- covered employment may purchase the Part A premium. The cost in 2004 for purchase of the Part A premium amounted to $189 a month for persons who have 30–39 quarters of coverage, and $343 if less than 30 quarters of coverage. Part B of Medicare is funded for all Medicare beneficiaries through purchase of a premium. All persons eligible to receive Medicare Part A are entitled to enroll in Part B medical insurance. This part of the Medicare program is financed through a monthly premium ($66.60 in 2004) paid by the enrolled person. This monthly premium is ad- justed each year to cover 25 percent of program costs, and the remaining 75 percent is
- 44. financed by the federal government through general funds. Unemployment Insurance The Unemployment Insurance (UI) program assists states and U.S. territories in pro- viding a temporary source of income for workers when earnings are reduced or stopped because of temporary unemployment. It is a federal enabling program providing grant funding to states for administration of their unemployment compensation laws. The federal government sets broad guidelines for the unemployment insurance program, with states determining eligibility and benefit levels. Roughly 97 percent of all wage and salaried workers in the United States are in covered jobs. The program is financed through a tax on employers. Tax contributions are paid into a trust fund in the U.S. Treasury and credited to each state. The tax rate is determined by several factors in- cluding an employer experience rating based on employees who have qualified for un- employment benefits in the past and the fiscal health of a state’s trust fund. The future solvency of the Unemployment Insurance program (UI) has not gar- nered as much concern as in the preceding case for OASI and Medicare. UI has changed only marginally through the years in terms of benefit expansion and benefit levels. However, the experience with UI has been that the trust funds for each state are very dependent on each state’s economic circumstances. In good times (low unemployment)
- 45. tax contributions lead to surplus funds, and conversely, high times of unemployment lead to exhaustion of trust fund monies. The federal government provides a very im- portant safeguard in funding adequacy through an emergency fund, which is triggered by economic crises. The federal government also can step in with the Extended Benefit (EB) program when national unemployment reaches a certain level. Unemployment Insurance (UI) is designed to target people who lose their jobs through no fault of their own, as distinguished from people who are unemployed for other reasons. As a rule, UI does not provide benefits to unemployed workers who are new entrants or reentrants into the labor market, persons who have been discharged for misconduct, or those who quit their jobs voluntarily. In each case, however, their em- ployer has paid unemployment insurance tax on their wages. Each state is responsible 186 P A R T T W O / A Style of Policy Analysis IS B N : 0 -5 3 6
- 46. -1 2 1 1 2 -5 Social Policy and Social Programs: A Method for the Practical Public Policy Analyst, Fourth Edition, by Donald E. Chambers and Kenneth R. Wedel. Published by Allyn and Bacon. Copyright © 2005 by Pearson Education, Inc. for financing its unemployment insurance plan, which consists of the Federal Unem- ployment Tax and an experience rating system. It is with the experience rating that varia- tions in funding occur. An employer with an experience of high unemployment claims generally pays a higher tax rate until the employer can build up a reserve balance. In some states employers are allowed to reduce their experience rating by making addi- tional contributions into the fund. There has been a gradual decline in unemployment insurance protection due to a decrease in manufacturing jobs and an increase in service sector jobs. Compared to manufacturing industries, service industries have a disproportionately large number of part-time, intermittent, and temporary jobs that pay low wages. These jobs often provide insufficient earnings and employment to qualify workers for unemployment insurance. Also, service workers are less likely to have the protections
- 47. unions provide in assisting unemployed persons who become unemployed.24 Workers’ Compensation Workers’ compensation is not a national social insurance program. Rather, it represents states’ and U.S. territories’ laws requiring employers to insure themselves against work- related accidents and illness. No state is required to have a workers’ compensation pro- gram, and there are no federal minimum standards required of them. These laws ensure that employees who are injured or disabled on the job and their dependents are pro- vided with fixed monetary awards in order to reduce the need for litigation. Benefits are also provided for dependents of workers who are killed as a result of a work-related ac- cident or illness. In some states, laws establish protection for employers by limiting the amount an injured employee can recover from an employer. Some laws also eliminate the liability of coworkers in most accidents. In addition to states’ laws, there is a Federal Employment Compensation Act for federal employees, the Federal Employment Lia- bility Act for employees of railroads engaged in interstate commerce, the Merchant Ma- rine Act for seamen, the Longshore and Harbor Workers’ Compensation Act for specified employees of private maritime employers, and the Black Lung Benefits Act for miners suffering from “black lung” (pneumoconiosis). Workers’ compensation laws in all states (except Texas) require compulsory in-
- 48. surance coverage, though many states do permit certain waivers. In most states em- ployers may insure through private insurance carriers. State funds have been set up in approximately half the states, with the option for employers to purchase the insurance competitively through the state fund or from a private carrier. Employers in North Dakota, Wyoming, Puerto Rico, and the Virgin Islands must insure exclusively through a state fund. Several other states give the option of the state fund or self- insurance. Self-insurance by individual employers or a group of employers is allowed in a majority of states. Summary on Adequacy, Equity, and Efficiency for Funding through Social Insurance. Collectively, the nation’s social insurance programs have established a formidable record in providing a safety net for countless individuals and families in our society when personal resources are inadequate to maintain basic standards for quality of living. As we have seen, however, there continue to be issues of adequacy, equity, and efficiency, all of which present serious challenges for policy makers. Particularly vexing C H A P T E R 8 / How Do We Pay for Social Welfare Policies and Programs? 187 IS B N
- 49. : 0 -5 3 6 -1 2 1 1 2 -5 Social Policy and Social Programs: A Method for the Practical Public Policy Analyst, Fourth Edition, by Donald E. Chambers and Kenneth R. Wedel. Published by Allyn and Bacon. Copyright © 2005 by Pearson Education, Inc. is the issue of adequate future funding for OASDI and Medicare as these programs mature and societal demographics change. Proposals for infusing these governmental programs with elements of privatization require careful study by the policy analyst. Public/Government Funding The U.S. social welfare system relies heavily on the public sector to fund the bulk of so- cial policy and programming, particularly the large-scale public assistance programs. The funding methods are several, but primary among them is taxation at the various lev-
- 50. els of government. Other public funding sources are fees and licenses, child support payments, fines, royalties, earned interest trust fund securities, and other miscellaneous revenue sources. Our focus in this chapter is on taxation as a funding source; we will want to briefly review where tax money comes from and its influence on different seg- ments of the population, where it goes, and the methods used to appropriate funds for social programs or reimburse providers’ benefits/services. A listing of all social programs that receive funding raised by general taxation would be unwieldy to present, but the following are major examples of these programs and services: � Temporary Assistance for Needy Families (TANF) � Supplemental Security Income (SSI) � Medicaid � Children’s Health Insurance � Women, Infants and Children (WIC) � Community Mental Health � Social Services under the Social Services Block Grant (Title XX) � Child Welfare � Disability Services � Aging Services The collection of tax money is undertaken at all levels of government, and al- though folks grumble about paying taxes, it is probably the most widely accepted ap- proach to raising funds for public use. However, there are some inherent social policy
- 51. issues at the very heart of taxing practice. We address some of the key issues surround- ing taxation before discussion of specific taxes used to finance social policy and pro- gramming. First, we look at the attributes of tax systems and taxation practice. “A tax is a tax is a tax,” and everyone directly or indirectly pays. In that regard, we all carry part of the load. However, there are some major inequities in tax systems that affect the proportion of the burden carried by different individuals. In this regard, taxes are considered to be regressive, neutral, or progressive. These three types of tax sys- tems, along with examples, are identified in Table 8.3. By definition, a regressive tax system taxes persons who have lower earnings at higher rates as in the example of Social Security taxes. This can be confusing, since the tax rate (percentage of wages contributed) for Social Security is the same for all persons regardless of wage level. What makes it regressive is an earnings cap (discussed earlier) 188 P A R T T W O / A Style of Policy Analysis IS B N : 0 -5
- 52. 3 6 -1 2 1 1 2 -5 Social Policy and Social Programs: A Method for the Practical Public Policy Analyst, Fourth Edition, by Donald E. Chambers and Kenneth R. Wedel. Published by Allyn and Bacon. Copyright © 2005 by Pearson Education, Inc. over which high-income wage earners pay no further Social Security wage tax. Another issue can be seen in regard to a flat tax system. In theory, a flat tax is neutral (neither re- gressive nor progressive) as in the example of a sales tax. In practice, however, sales taxes tend to be regressive, particularly when the basic items needed for survival are covered, for example, groceries for home consumption, fuel to heat a home, and basic personal supplies. As such, this flat tax has the effect of being regressive since at any tax rate (say, 5 percent) it will require more of a poor person’s resources needed for survival than in the case of a well-to-do person. Individual income tax systems are more progressive when the tax kicks in only for persons with incomes over the poverty level, and the rate of tax to be paid progresses (increases) as income increases.
- 53. Other attributes add to the complexity and fairness of tax systems—tax credits, tax deductions, and tax shelters. Tax credits, as in the example of food purchases, child care, or earned income credit, serve as an offset in the amount of tax owed. Such credits can be very favorable to low-wage earners. Deductions are expenses, which defray the amount of income subject to income tax. Examples of tax deductions are health care ex- penses over a specified standard amount in the tax code and interest on mortgage pay- ments for individuals and couples purchasing a home. Tax shelters come in the form of moving income into certain retirement accounts, pretax health expense accounts, edu- cational saving accounts, and so on. Examples of the latter tend to favor middle-income and high-income persons and families. Federal Government Taxes The federal government levies taxes and charges fees in a number of areas. Federal taxes include individual income tax, corporation income tax, excise taxes, income tax of es- tates and trusts, and employment taxes (for Social Security and Medicare). Among the fee charges by the federal government, we note in particular the monthly charge for Medicare beneficiaries receiving medical care insurance. The federal individual income tax is the greatest producer for federal general revenue used to finance federally funded social welfare programs.
- 54. C H A P T E R 8 / How Do We Pay for Social Welfare Policies and Programs? 189 TABLE 8.3 Types of Tax Systems with Examples Tax System Regressive Flat Progressive Who It Taxes Taxes those who earn the least at higher rates Taxes everyone at the same rate, regardless of income Taxes those who earn the most at higher rates Example Old Age, Survivors and Disability (OASDI) Social Security tax Health Insurance (HI) Medicare tax Federal and state excise tax State and local sales tax Federal individual income tax Most state individual income tax Federal estate tax Most state estate tax IS
- 55. B N : 0 -5 3 6 -1 2 1 1 2 -5 Social Policy and Social Programs: A Method for the Practical Public Policy Analyst, Fourth Edition, by Donald E. Chambers and Kenneth R. Wedel. Published by Allyn and Bacon. Copyright © 2005 by Pearson Education, Inc. Nearly everyone who works for a wage is required to file an Internal Revenue Ser- vice (IRS) Form 1040 by April 15 of each year. The IRS, a program division within the U.S. Treasury, collects the tax. This money is considered general revenue to pay for government expenditures appropriated by Congress in interaction with the administra- tive branch of the federal government. The federal individual income tax system raises over half the revenue collected by the federal government each year. It is an enormous
- 56. amount of money—in the early years of the twenty-first century the amount has ex- ceeded $1 trillion annually.25 Although the federal individual income tax system is progressive, and generally considered the most efficient way to raise revenue in this county, it is not without its problems. One of the problems is cheating—most people who cheat do it by deliber- ately underreporting income. And it is believed that most people who cheat are middle- income earners.26 A growing concern centers on tax evasion through offshore schemes in which individuals move funds into accounts “near” the United States, and hiding money overseas. In addition, there are complicated tax laws associated with the federal personal income tax system and honest mistakes are made that end up reducing the ef- fectiveness of this tax. State and Local Government Taxes States and U.S. territories utilize three major types of taxes to raise revenues: (1) con- sumption or sales tax, (2) individual income tax, and (3) corporate income tax. Sales tax is the largest generator of state tax revenue and includes a general sales tax or selective sales taxes on products such as gasoline, utilities, insurance, tobacco products, and alco- holic beverages. Most states also utilize an individual income tax—though nine states do not have a broad-based personal income tax. Corporate income is usually apportioned among states according to how much sales, payroll, and
- 57. property the corporation has in each state. Corporate income tax is complicated, and the tax burden is controversial. This tax tends to be largely borne by customers in the form of higher prices, by work- ers in the form of lower wages, and by property owners.27 As a result, it can be difficult to conclude whether a state corporate tax is regressive or progressive (tax burden carried by corporate owners). The largest generator of state tax revenue is sales tax. As we noted in Table 8.3, the state sales tax system tends to be regressive. States can choose to offset the effect of re- gressive sales taxes through various low-income tax relief approaches.28 One popular ap- proach is to exclude, reduce, or offset the tax as applied to food for home consumption. Another example is providing a refundable credit for low- income individuals, usually by offering the credit as part of the state individual income tax system. Yet another way to provide tax relief for the poor is through a credit for low- income working families with children. This approach is a supplement to the federal earned income credit, also done in conjunction with a state’s individual income tax system. In some states sales tax relief is targeted to a special group or groups—senior citizen low- income renters, for example. An advantage of state individual income tax, from a social policy perspective, is the progressive nature of a state tax in taking a larger proportion of income from the afflu-
- 58. ent than from the poor. Although some states tax very low- income individuals, personal 190 P A R T T W O / A Style of Policy Analysis IS B N : 0 -5 3 6 -1 2 1 1 2 -5 Social Policy and Social Programs: A Method for the Practical Public Policy Analyst, Fourth Edition, by Donald E. Chambers and Kenneth R. Wedel. Published by Allyn and Bacon. Copyright © 2005 by Pearson Education, Inc. exemptions, standard deductions, and low-income credits can fully exempt some tax- payers with low incomes. Another approach to shield the poor from the impact of taxes (particularly at times of tax increases) is to set an income below which low-income indi-
- 59. viduals and families are exempt from paying the tax. Local governments utilize a variety of taxes, with consumption or sales tax and property tax as the major types. The greatest proportion of revenue for local govern- ments is from taxes on property. Property taxes include taxation on homes, rental prop- erty, business property, farms, and ranches. Taxes on homes and rental property tend to be regressive because the ratio of home value to income and also of rental payments to income tends to decline as income rises. To the extent that business property owners do not pass on tax burdens to customers, they may be progressive. One way that states (and localities) use to provide low-income tax relief is through a tax relief approach called a cir- cuitbreaker. A circuitbreaker involves a credit based on a household’s residential property tax payments and its income—the greater a family’s property tax and the lower its in- come, the higher the credit benefit. As in the use of low-income credits discussed earlier, the circuitbreaker may be a refundable income tax credit, or it may be administered sep- arately from the income tax system. In most states where the circuitbreaker is applied, renters are also eligible—with percentage of rent treated as a property tax payment. Summary on Adequacy, Equity, and Efficiency for Public/Government Funding through Taxation. “It is generally recognized that no tax plan can at once be per- fectly fair, utterly simple, and economically neutral.”29 We
- 60. have seen that regressive tax systems often provide the funding for social programming, particularly at the state and local levels. In that regard the taxes are harmful to the very people who receive the help. However, we also identified a number of ways that a tax system can provide tax relief for low-income individuals and families affected by regressive taxes. In the case of some tax systems, the policy analyst will note that a regressive tax may lead ultimately to positive income redistribution. As we noted earlier, Old Age, Survivors and Disability Insurance (OASDI-Social Security) is a case in point. OASDI payroll taxes are regressive in that earned income is taxed up to a maximum ($87,900 in 2004). However, upon retirement, the Social Security program is structured to pay out benefits in greater proportion to low and moderate wage earners than to higher-wage employees. Finally, there is the issue of complexity. Some taxes, sales taxes in particular, are generally simple for the taxpayer to understand and pay. Their collection does, however, require merchants to keep accurate records of accounting and the task of giving taxes collected over to governmental revenue agents. When tax relief is available for low- income individuals and families, it usually requires initiative on the part of the taxpayer to take advantage of the offer. And that implies an understanding of the tax break and in some cases an application for such relief. Tax codes for federal and state income tax sys- tems are subject to continuous efforts at reform. Even though
- 61. major efforts have been made to simplify the federal internal revenue tax code over the past twenty or so years, it still represents a high degree of complexity, and a large proportion of taxpayers rely on a service to fill out their annual tax forms for federal and state individual income taxes. As noted earlier, there is also the problem of taxpayers’ purposefully cheating the various tax systems. C H A P T E R 8 / How Do We Pay for Social Welfare Policies and Programs? 191 IS B N : 0 -5 3 6 -1 2 1 1 2 -5 Social Policy and Social Programs: A Method for the Practical Public Policy Analyst, Fourth Edition, by Donald E. Chambers and Kenneth R. Wedel. Published by Allyn and Bacon. Copyright © 2005 by Pearson Education, Inc.
- 62. Federal Government Appropriations and Reimbursements It was not until 1913 that the federal individual income tax as we know it today came into being as an amendment to the Constitution of the United States. Prior to that time, the federal government had no power to collect such a national tax.30 Furthermore, the federal government was not really a player of any consequence in the nation’s social wel- fare system, and for that matter, did not have revenues of a magnitude to assist states in their modest social welfare efforts. All of that changed during the twentieth century. As we reviewed earlier, the federal government is capable of raising huge sums of money through taxes, and also the federal role in returning revenues to the states (and directly to citizens) is substantial. The role of the federal government in making grants available to states from general federal revenues remained modest until the New Deal of Presi- dent Franklin D. Roosevelt—beginning during the depression years of the 1930s. Several different arrangements are used in making federally collected general rev- enue money available for social policy and programs. In some cases, the federal govern- ment pays directly for social policy and program benefits and costs—Social Security, SSI, and Medicare are examples. In most cases, however, the federal government pro-
- 63. vides funding through various grants made to the states and U.S. territories. First, we will describe examples of direct federal payments, and then we will examine the federal grant-in-aid approach to states. The Supplemental Security Income (SSI) program is administered by state gov- ernmental agencies. Funding for SSI comes from congressional appropriation of federal general revenue funds. States may, and most do, add their own funds to augment the SSI program; however, the basic program is one we consider an example of direct federal funding. Another such program is the Women, Infants and Children (WIC) program, administered by state and local governmental units. As in the case of SSI, WIC funding comes from federal general revenue. Additional programs, which receive direct federal funding, are the food and nutrition programs: food stamp program, school lunch and breakfast programs. Finally, we cite federal correctional programs, military human ser- vices, Veterans Administration programs, and the Indian Health Service as additional examples of direct federal government funding from general revenue. There are more that will be familiar to the practitioner/analyst. Although the federal government uses a wide variety of granting approaches, we examine the two types of federal grants that are widely utilized for social programs in- volving a federal match of funds to state dollars for ongoing benefits and services. Table
- 64. 8.4 identifies the two federal grant types and their characteristics, along with examples of social programs that are funded by each type of grant. The amount of state match for each of the larger public assistance categorical grants is determined by a formula, as noted in Table 8.4. The formula takes into account the social conditions of a state. As a result, each state’s federal match can be somewhat different from the match in other states. However, for most social programs the major share of funding is the federal match (often over 70 percent). Medicaid provides a good example. The federal match for Medicaid services is a variable formula, which is ad- justed annually. The federal matching rate is inversely related to a state’s per capita in- come, with a range for the federal match from 50 to 83 percent. Federal matching for 192 P A R T T W O / A Style of Policy Analysis IS B N : 0 -5 3 6 -1 2
- 65. 1 1 2 -5 Social Policy and Social Programs: A Method for the Practical Public Policy Analyst, Fourth Edition, by Donald E. Chambers and Kenneth R. Wedel. Published by Allyn and Bacon. Copyright © 2005 by Pearson Education, Inc. the U.S. territories is set at 50 percent with a maximum dollar amount limiting the funds each territory can receive. The federal match for program services continues for each dollar the state spends but with some limits built into the reimbursement policy. For ex- ample, spending caps are placed on reimbursement for some hospital expenses, pre- scription drug charges, and payments to institutions for mental disease and other mental health facilities. In addition to funding for Medicaid services, the federal government C H A P T E R 8 / How Do We Pay for Social Welfare Policies and Programs? 193 TABLE 8.4 Federal Grants-in-Aid to States: Categorical and Block Grants Categorical grant Block grant
- 66. 1. Uses a formula to determine federal financial match of state dollars (typically based on): � Population � Per capita income � Population at risk 2. State plan designates a single state agency to receive the federal funding and administer the program or supervise local government administration 3. Strict definition of program category, entitlement, and extensive federal rules and regulations on how the funds are to be spent 4. Amount of federal funding based on reimbursement of entitled benefits or services provided Examples of social programs involving categorical grants: � Medicaid � State Children’s Health Insurance Program (SCHIP) � Women, Infants and Children (WIC) � Child welfare foster care services � Food stamps 1. Uses criteria from past state performance to determine amount of grant to state when block grant replaces categorical grant (typically based on): � Program expenditures for a selected past base year � Numbers of individuals/families who received benefits/services
- 67. 2. States given flexibility how funds will be parceled out to state agencies or local government administration 3. States required to maintain effort (maintenance of effort, MOE) in comparison with standard of base year 4. States given basic guidelines and flexibility on how the funds are to be spent 5. Amount of federal funding based on funding cap for set time Examples of social programs involving block grants: � Temporary Assistance for Needy Families (TANF) � Social Services Block Grant (SSBG)—Title XX � Alcohol, drug abuse, and mental health � Maternal and child care � Child care IS B N : 0 -5 3 6 -1 2 1 1 2 -5
- 68. Social Policy and Social Programs: A Method for the Practical Public Policy Analyst, Fourth Edition, by Donald E. Chambers and Kenneth R. Wedel. Published by Allyn and Bacon. Copyright © 2005 by Pearson Education, Inc. provides a 50 percent match to states and territories for administrative costs (except for certain items that are matched at a higher rate). An ongoing issue in the federal grant-in-aid process of financing state and local governments for social policy and programming, and other areas, is the question of fed- eral control over funds granted. This issue concerns a “balance of power” between states and the federal government. The states form a union and agree to subordinate some of their powers to the federal government in order to further common goals. This rela- tionship, referred to as federalism, shifts and changes over time.31 Categorical grants represent the greatest federal control. These grants specify in detail how the federal funds are to be spent by states and require elaborate accountability to ensure that funds are spent by states in accordance with federal intent.32 Categorical grants were initially used for the public assistance titles of the Social Security Act of 1935 to assist states in funding for aid to children, the aged, and the blind. Changes have occurred (and are on- going) in the use of categorical grants, resulting in changes in federal/state relation-
- 69. ships. As we noted earlier, in one case categorical grants for the public assistance titles for the aged, blind, and disabled were consolidated and federalized into the SSI program in 1974. In recent years, however, momentum is growing to replace categorical grants to states with block grants, a process often referred to as devolution of federal power and control for social programs. Block grants provide greater flexibility to states and fewer mandates for how the money is to be spent. However, block grants provide a specified dollar amount for states to spend on designated program areas and a loss of funding certainty. There are three basic arguments given in favor of block grants: (1) programs could be streamlined in ways that will be easier to administer and simpler for consumers to use; (2) there may be a perceived political advantage to shifting the control of funds to another level of gov- ernment; and (3) block grants control spending. Block grants have been used since the 1960s, but a major move toward the block approach occurred when Congress converted the AFDC categorical grant program into the TANF block grant program in 1996. In 2003, the Bush administration was promoting proposals to block grant federal pro- grams serving the unemployed and working poor. The programs under consideration include Medicaid, housing workforce development, child protection, transportation as- sistance in the Job Access program, and Head Start.
- 70. In addition to federal grants-in-aid to states and U.S. territories, some social pro- grams involve a reimbursement process to participants or benefit/service providers. The prime example is the Medicare program. The federal government appoints orga- nizations engaged in the health insurance field (mainly insurance companies such as Blue Cross and Blue Shield) to act as contractors in administering Medicare. Contrac- tors use federal guidelines to determine approved charges and make payments, directly or by way of reimbursement, to participants and suppliers of services. Although the SSI program is not a social insurance program, Congress has made appropriations for funding increases sufficient to cover benefit COLA increases. By contrast, Temporary Assistance for Needy Families (TANF) represents a standstill bud- get of federal block grant funds to states and U.S. territories. Under the later circum- stances, states and territories will not have an incentive to increase cash income benefits for clients/consumers. 194 P A R T T W O / A Style of Policy Analysis IS B N : 0 -5
- 71. 3 6 -1 2 1 1 2 -5 Social Policy and Social Programs: A Method for the Practical Public Policy Analyst, Fourth Edition, by Donald E. Chambers and Kenneth R. Wedel. Published by Allyn and Bacon. Copyright © 2005 by Pearson Education, Inc. Summary on Adequacy, Equity, and Efficiency for Public/Government Funding through Appropriations and Reimbursements. The net effect of federal tax col- lections, state demographics, differences in state economies, and the various federal appropriation and reimbursement approaches leads to an equity problem for states. At the macro level, analysts point to a “balance of payments” issue. The balance of pay- ments equation is generally expressed by amount of federal spending attributable to each state in comparison to federal taxes and fee revenue dollars collected in each state. Although this balance of payments equity issue includes all federal expenditures (not just for social programs as we discussed earlier), appropriations for social programs and
- 72. social insurance benefits are major inputs influencing the equation. In fiscal year 2002, the District of Columbia was the biggest gainer at $6.44 received for every dollar paid to the federal government. New Mexico followed as a top gainer state with $2.37 in return for every dollar paid in. New Jersey ranked lowest, receiving just 62 cents for every dollar paid in. Other states with a very negative balance were Connecticut, New Hampshire, and Nevada.33 Although this equity issue may appear somewhat abstract, it is well worth watching by the policy analyst in terms of how the federal balance of pay- ments can influence decisions of policy makers about social programs. Next, we exam- ine how the federal funding approach to Medicare achieves its goal to increase equity among the states. A primary goal in establishing Medicaid’s statutory formula, whereby states with lower per capita incomes receive higher rates of federal reimbursement for program costs, was to narrow differences among states in their ability to fund Medicaid services. States’ ability to fund services depends on their financial resources in relation to their number of and costs to serve people in poverty. The U.S. General Accounting Office (GAO) and others have testified before Congress that the current formula does not ad- dress wide differences among states in their ability to fund their Medicaid programs and the formula’s reliance on per capita income is the primary cause. The Medicaid formula
- 73. narrows the average difference in states’ funding ability by 20 percent but often widens the gap between individual states and the national average, making the average differ- ence in funding ability smaller. It also moves 21 states further from the average, widen- ing the average difference. Two factors constrain the formula. First, per capita income is not a comprehensive indicator of a state’s total available resources and is a poor mea- sure of the size of and cost to serve a state’s people in poverty. Second, the statutory pro- vision that guarantees no state will receive less than a 50 percent matching rate benefits many states that already have above-average resources to fund health care for their pop- ulations in poverty. GAO used an alternative to per capita income that more directly measures states’ resources, number of people in poverty, and cost of providing services to this population—the formula would have reduced differences by 105 percent.34 Unfunded Policies Not all social policies result in social programs, per se. That doesn’t mean there are no financial issues involved, but rather a different approach than we have discussed previ- ously may be required to ferret out financing issues. The policy analyst will be con- cerned with how costs involving such policies are allocated, who pays, and what the C H A P T E R 8 / How Do We Pay for Social Welfare Policies and Programs? 195
- 74. IS B N : 0 -5 3 6 -1 2 1 1 2 -5 Social Policy and Social Programs: A Method for the Practical Public Policy Analyst, Fourth Edition, by Donald E. Chambers and Kenneth R. Wedel. Published by Allyn and Bacon. Copyright © 2005 by Pearson Education, Inc. costs are. Consider, for example, the social policy of “minimum wage.” There is obvi- ously a cost involved in minimum wage and, hence, a financing issue. However, unlike the cost of providing TANF client/consumers with vocational training and/or child care, minimum wage is a cost to employers (and, of course, any persons who can’t find a job because of the effects of minimum wage). Another example is the Family Medical Leave Act. This social policy requires covered employers to
- 75. provide eligible employees with up to twelve workweeks per year of job-protected leave to care for the employee’s newborn child (or adopted or foster care child); to care for the employee’s spouse, child, or parent who has a serious health condition; or because of the employee’s own serious health condition. There are costs to employers and coworkers who donate work hours, but no funding is required to operate a social program. Additional examples in the cat- egory of “other” are the Child Care Credit and Earned Income Tax Credit (EITC). In the case of both these social policy provisions the costs are borne primarily by the gov- ernmental units (federal and state) in lost tax revenue. Finally, there is the issue of unfunded mandates. Legislators have been prone to pass legislation that compels both public and private organizations to implement poli- cies at their own expense, or the costs are to be incurred by consumers or others. We have presented some examples throughout this text. Unfunded mandates can be legis- lated at all levels of government. As states have been required to take on a greater role in funding social programs, sensitivities to unfunded federal mandates have heightened. In 1995, Congress passed the Unfunded Mandate Reform Act, which helped diminish new unfunded mandates on state and local governments. However, as Congress adds rules and regulations to reauthorization of block grants (including new set-asides and cost ceilings), some have the effect of unfunded mandates to
- 76. states. Program Funding Information In many cases, a logical starting point for analysis of financing is at the program or agency level. Budgets and financial statements can be very informative sources for the practical policy analyst to begin analysis. Budgetary funding sources and amounts give an overall picture of the funding base. Review of budgetary funding over previous years (usually at least five or ten years) produces information on funding levels and trends. When examining the budget of a program funded entirely, or in part, by charitable giv- ing, it will be helpful to question whether the funding has been adequate to provide a consistent stream of benefits or services throughout the budget year—usually twelve months. Do financial statements reveal deficit funding, a balanced budget, or annual ex- cess of funds to begin the next year of operation? Is there overdependence (and risk) in funding source(s)? Has the program been able to expand and, if so, in what ways? Has the program been forced into cutback management, and if so, what are the approaches and outcomes? Answers to the preceding questions help inform the analyst on the specifics of funding and set the stage for determining adequacy, equity, and efficiency/ effectiveness in financing. The beginning process is quite similar for analysis of financing for public pro- grams. Although examination of actual budgets may be
- 77. required, in many cases the practical analyst will find that such analysis is already being carried out by federal and 196 P A R T T W O / A Style of Policy Analysis IS B N : 0 -5 3 6 -1 2 1 1 2 -5 Social Policy and Social Programs: A Method for the Practical Public Policy Analyst, Fourth Edition, by Donald E. Chambers and Kenneth R. Wedel. Published by Allyn and Bacon. Copyright © 2005 by Pearson Education, Inc. state units responsible for preparing budgets and/or leading policy research centers. At the federal level, information and materials are available in printed form and at the Web sites of the White House, Government Accounting Office
- 78. (GAO), the adminis- tration’s Office of Management and Budget (OMB), and the Congressional Budget Office (CBO). A composite of budgetary information is available from the Green Book on social programs, which has been published every two or three years by the U.S. House of Representatives, Committee on Ways and Means. Private policy research centers that regularly produce useful budgetary and program information include the Brookings Institution, the Center on Budget Priorities, and the Urban Institute. The major task for the policy-critical analyst is to determine whether such comparisons over time yield the evidence required to make judgments on adequacy of funding and also address issues of equity and efficiency/effectiveness. Some social programs have a history of insufficient financing to keep benefits coming for the entire fiscal year of funding. The Women, Infants and Children (WIC) program is a case in point. In the past, WIC has experienced discontinuity in service delivery because client/consumer demand outpaced resources available. During fiscal year 2002, emergency supplemental funding for WIC was tied up in a comprehensive supplemental bill, which included funding for many other programs. Service delivery providers had to wait for months on emergency funding while the bill was debated in Congress. More common are examples occurring for programs financed at state and local levels in both public and private sector programming.
- 79. Mental health facilities are unable to see new clients/consumers and must make referrals to the next best service when personnel budgets are inadequate to add professional staff necessary to handle service demand. Privately sponsored food closets often run out of resources prior to the next scheduled fund-raising effort or United Way appropriation. Unfortunately, such problems tend to occur at times of a weak economy and when need for benefits and services is greatest. A significant problem occurred for state and local government program funding following the economic downturn of the late 1990s and early 2000s. Loss of tax rev- enues forced cutbacks in most states. Adding to continuity in funding for social welfare programs in many states are laws requiring a balanced budget. Such states are prohib- ited from spending more than the revenues coming into state government, and clever means to raise funds, such as voter approval of bond issues, usually don’t apply well to human service programs. Other alternatives such as passage of laws that legalize gaming and lotteries may help in some areas, though most are not very consistent with the goal of adequately funding social policies and programs. The alternative chosen in many cases is to require some percentage cut for all state program budgets. When this hap- pens and involves some services that are mandated by law, for example, child protection, it is the legislatively mandated service that will be the program
- 80. priority. In some cases, that can be a disaster. Since investigation of child abuse reports is mandated by law, that will surely be done, but other nonmandated services will be reduced—follow-up ser- vices and treatment most likely. Although it is important to bring child abuse to the at- tention of judicial authorities, investigations can be an exercise in futility absent the ability of either the court or the social service agency to do anything beyond a radical separation of children from their biological parents. C H A P T E R 8 / How Do We Pay for Social Welfare Policies and Programs? 197 IS B N : 0 -5 3 6 -1 2 1 1 2 -5 Social Policy and Social Programs: A Method for the Practical Public Policy Analyst, Fourth Edition, by Donald E. Chambers
- 81. and Kenneth R. Wedel. Published by Allyn and Bacon. Copyright © 2005 by Pearson Education, Inc. Not only that. Mindless percentagewise budget cuts can reduce staff so radically that abuse investigations either overlook serious child abuse or result in false reports that can create terrible damage to innocent parents (and in both cases can create sub- stantial legal liabilities for agencies as well). When such budget cuts occur, social program managers and practitioners are ethically obligated to make clear (and public) how such reductions affect the ability of the program to serve its target group. Those who make those kinds of budget cuts will not be at all pleased to have this news made public. But there are fund- ing levels below which program objectives and performance standards simply cannot be achieved. One way to fight that is to make the consequences plain to the public. One reason to construct target group specifications (and include them in statements of goals and objectives as discussed in Chapter 4) is to have an established baseline by which the impact of fiscal reductions can be demonstrated. There are also multiplier effects, which influence decision makers about program funding choices in hard times. For example, one of the largest funding demands in most states and U.S. territories occurs with Medicaid. Based on the federal formula for fund- ing Medicaid, a state’s federal funding match is between 50 and
- 82. 80 percent. A dollar cut from the state portion of a Medicaid budget, therefore, results in loss of a dollar or more in federal dollars! As a result, state legislators may be persuaded to preserve state fund- ing of this and similar programs that rely on a generous formula for federal funds com- ing into the state. The budget cuts will be made for programs that rely less on federal support. The net effect can be a serious inequity in funding of the various social pro- grams in the state. An even more serious scenario occurs when social programs are discontinued en- tirely. Too often, programs are discontinued, not because their program ideas and im- plementation were lacking or ineffective, but because they failed to reach a target group or performance standard that, with proper foresight, would have been known to be un- reachable, given the resources at hand. This happens when administrators and social program innovators become so enthusiastic about their ideas and operations that, with- out realizing it, they overcommit their organization—a lethal choice in times of revenue shortfalls. This is unfortunate because good ideas are scarce. Finally, competition for so- cial programming is fierce, and interested parties will seize on the other’s shortcomings like sharks in a feeding frenzy. The Privatization Movement We close this chapter by identifying several features of the
- 83. trend to privatize social pro- grams, the philosophy behind this trend, and note some reports on how privatization can influence the financing of social welfare programs and services. Privatization has an influence on social programs in different ways, especially as an approach to service delivery (as noted in Chapter 7), and also with regard to financial reimbursement to service providers. The privatization trend can be observed in many areas of social policy and programming, including adult and juvenile correctional facil- ities, workforce development, child support enforcement, child care, child welfare, and mental health services. Privatization of social welfare programs and services primarily involves a public sector agency or jurisdiction contracting out35 to a private sector con- 198 P A R T T W O / A Style of Policy Analysis IS B N : 0 -5 3 6 -1 2
- 84. 1 1 2 -5 Social Policy and Social Programs: A Method for the Practical Public Policy Analyst, Fourth Edition, by Donald E. Chambers and Kenneth R. Wedel. Published by Allyn and Bacon. Copyright © 2005 by Pearson Education, Inc. tractor for program management functions or purchase of service. Major issues have emerged concerning the privatization movement in social welfare. The discussion that follows is a brief review of the experience with the privatization in one area of social wel- fare, child welfare services. Although there is ongoing debate regarding privatization of social services in gen- eral, in child welfare state and local governments have paid private, voluntary agencies to provide child welfare services since the early 1800s.36 The extent to which privatiza- tion occurs today in child welfare is reflected in a report by the U.S. Department of Health and Human Services (DHHS). Based on a survey of local child welfare agencies, it is reported that 58 percent of all family preservation services, 42 percent of all resi- dential treatment, and 52 percent of case management services for adoption are being contracted out.37 Assessments of privatization in this field have turned up some very
- 85. mixed results. One of the most well-known examples of a statewide privatization initiative in child welfare began in Kansas in 1996. It began at a time that many would argue was the worst-case scenario for shifting to a comprehensive privatized system. The Kansas De- partment of Social and Rehabilitation Services (SRS) was experiencing a range of sys- temic issues that signaled the need for major reform: an uncoordinated, crisis-oriented approach to service delivery; the fact that client/consumers were subject to multiple as- sessments and the involvement of multiple staff; an evaluation of services that was process based rather than outcome based; and reliance on multiple funding streams that often were at cross-purposes and too categorical to effectively support client/consumers in making needed changes.38 It is the latter point about funding that concerns us most in this discussion. A central feature in the privatization plan was a shift to managed care principles for reimbursement of service providers. A case rate was used to cover the costs of all services by a child or family while being served through the family preserva- tion, foster care, and adoption programs.39 Kansas SRS did not use any pilot programs to test the initiative’s cost assumptions or evaluate the contractors’ ability to deliver ser- vices under new case rates, nor did it test the service assumptions or new performance- based standards.40 Initial results were disastrous for some of the original contractors,
- 86. particularly the vendor providing adoption services, and the contractors for foster care. The first contract for privatized adoption services in Kansas was let through a sole source contract to Lutheran Social Services (LSS)—the only bidder. The contract called for statewide coverage of services. During the initial contract year, LSS experi- enced significant financial difficulties generally attributed to the inadequacy of the case rate. By summer of 2000, LSS would have gone bankrupt if not for infusion of addi- tional state funds to pay its creditors.41 In July 2000, the contract was rebid and awarded to Kansas Children’s Service League. Severe problems occurred as well for contracts to provide foster care. A total of three contractors were awarded contracts to oversee the provision of foster care and group care services in five geographic regions covering the state. Initial experience with privatization in this area was described as “chaotic.”42 Coverage in the media raised a concern that privatization was “wrecking” foster care and driving away many providers and foster parents.43 As a result of high service demands, increased foster caseloads, and court delays, contractors repeatedly experienced cost overruns in the first year of their contracts.44 All three of the original contractors had first-year losses over $1 million. One contractor, United Methodist C H A P T E R 8 / How Do We Pay for Social Welfare Policies and Programs? 199
- 87. IS B N : 0 -5 3 6 -1 2 1 1 2 -5 Social Policy and Social Programs: A Method for the Practical Public Policy Analyst, Fourth Edition, by Donald E. Chambers and Kenneth R. Wedel. Published by Allyn and Bacon. Copyright © 2005 by Pearson Education, Inc. Youthville, went into bankruptcy in June 2001, and subsequently reorganized under bankruptcy protection following a $7.5 million deficit. Many of the original problems were dealt with through improvements in the case rate methodology to reimburse con- tractors and the state’s allocation of additional funds for child welfare. However, there is still doubt that the privatized system is an improvement over direct state operation.