SlideShare a Scribd company logo
1 of 6
Business KPI Dashboard Showing Average Revenue and…
$45 $30 $33 $43 $50 $45
$… $33 $45 $…
$48
In Dollars($)
CAC
LAST 12 MONTH
$35 $42 $53 $50 $60 $45 $50 $62 $80 $62 $53 $70
In Dollars($)
ARPU
LAST 12 MONTH
$40 $45 $62
$120 $100 $120 $110
$220
$100
$250 $250 $300
In Dollars($)
CLV
LAST 12 MONTH
Customer Lifetime Value
300$
Customer Acquisition Cost
500$
Average Revenue Per Unit
100$
AVERAGE WEEKLY SALES REVENUE
74.043$
0
20
40
60
80
100
95%
TARGET MET
ABOVE SALES TARGET YTD
354.043$
144
NEW CUSTOMER YTD
866.453$
SALES REVENUE YTD
200.123$
PROFIT YTD
This graph/chart is linked to excel, and changes automatically based on data. Just left click on it and select “Edit Data”.
Instructions To Edit This Slide
This slide has been made in PowerPoint using basic PowerPoint shapes, and all
graphics are 100% editable in PowerPoint.
You can change color, size and orientation of any element to your liking, and add/edit
any piece of text anywhere.
All images are 100% editable in PowerPoint
“Change color, size and orientation of any icon to your liking”
1. Select the Graph and right click on "Edit Data“.
2. An excel matrix will automatically show up.
3. Enter the values based on your requirements and hit enter.
4. The Graph/Chart shape will automatically adjust according to your data,
and anytime you change the value again.
Edit Excel-linked Chart
This is a Data Driven Chart/Graph and the shape automatically adjusts according to your data
1 2 3
Edit Color
1. Select the shape to change the color and Right click the object (click any object which you want
to change color)
2. Choose Format Data Series in the dialog box.
3. Choose “Fill” in the Format Shape box then “Solid” or “Gradient” depending on the appearance
of the object. Change colour as shown in the picture.
1 2 3
Select From Thousands Of Editable Icons On Every Topic
These icons are available at the Icons section on www.slideteam.net

More Related Content

Similar to business_kpi_dashboard_showing_average_revenue_and_clv.pptx

Project Status KPI Dashboard Showing Task Summary
Project Status KPI Dashboard Showing Task SummaryProject Status KPI Dashboard Showing Task Summary
Project Status KPI Dashboard Showing Task Summary
SlideTeam
 

Similar to business_kpi_dashboard_showing_average_revenue_and_clv.pptx (20)

Hr Dashboard Recruitment Performance Key Metrics
Hr Dashboard Recruitment Performance Key MetricsHr Dashboard Recruitment Performance Key Metrics
Hr Dashboard Recruitment Performance Key Metrics
 
Quality Dashboard With Quality Index By Measures And Quality Index
Quality Dashboard With Quality Index By Measures And Quality IndexQuality Dashboard With Quality Index By Measures And Quality Index
Quality Dashboard With Quality Index By Measures And Quality Index
 
Open Position And New Roles Recruitment Dashboard
Open Position And New Roles Recruitment DashboardOpen Position And New Roles Recruitment Dashboard
Open Position And New Roles Recruitment Dashboard
 
Goal Status Dashboard
Goal Status DashboardGoal Status Dashboard
Goal Status Dashboard
 
Social Media KPI Dashboard Showing Facebook Impression By Demographic Instagr...
Social Media KPI Dashboard Showing Facebook Impression By Demographic Instagr...Social Media KPI Dashboard Showing Facebook Impression By Demographic Instagr...
Social Media KPI Dashboard Showing Facebook Impression By Demographic Instagr...
 
Project Status Kpi Dashboard Showing Delivery Roadmap And Resource Allocation
Project Status Kpi Dashboard Showing Delivery Roadmap And Resource AllocationProject Status Kpi Dashboard Showing Delivery Roadmap And Resource Allocation
Project Status Kpi Dashboard Showing Delivery Roadmap And Resource Allocation
 
Manufacturing KPI Dashboard Showing Production Rate And Lost Units
Manufacturing KPI Dashboard Showing Production Rate And Lost UnitsManufacturing KPI Dashboard Showing Production Rate And Lost Units
Manufacturing KPI Dashboard Showing Production Rate And Lost Units
 
Project Status KPI Dashboard Showing Task Summary
Project Status KPI Dashboard Showing Task SummaryProject Status KPI Dashboard Showing Task Summary
Project Status KPI Dashboard Showing Task Summary
 
Retail Kpi Dashboard Showing Sales Revenue Customers And Out Of Stock Items
Retail Kpi Dashboard Showing Sales Revenue Customers And Out Of Stock ItemsRetail Kpi Dashboard Showing Sales Revenue Customers And Out Of Stock Items
Retail Kpi Dashboard Showing Sales Revenue Customers And Out Of Stock Items
 
Project Status KPI Dashboard Showing Completed Tasks And Task In Progress
Project Status KPI Dashboard Showing Completed Tasks And Task In ProgressProject Status KPI Dashboard Showing Completed Tasks And Task In Progress
Project Status KPI Dashboard Showing Completed Tasks And Task In Progress
 
KPI Dashboard Showing Overtime Cost Gender Diversity Ratio
KPI Dashboard Showing Overtime Cost Gender Diversity RatioKPI Dashboard Showing Overtime Cost Gender Diversity Ratio
KPI Dashboard Showing Overtime Cost Gender Diversity Ratio
 
Risk Management KPI Dashboard Showing Overall Security Risk And Regulatory Co...
Risk Management KPI Dashboard Showing Overall Security Risk And Regulatory Co...Risk Management KPI Dashboard Showing Overall Security Risk And Regulatory Co...
Risk Management KPI Dashboard Showing Overall Security Risk And Regulatory Co...
 
Progress Bar Graph Powerpoint Ideas
Progress Bar Graph Powerpoint IdeasProgress Bar Graph Powerpoint Ideas
Progress Bar Graph Powerpoint Ideas
 
Procurement Purchase Orders And Cost Reduction Dashboard
Procurement Purchase Orders And Cost Reduction DashboardProcurement Purchase Orders And Cost Reduction Dashboard
Procurement Purchase Orders And Cost Reduction Dashboard
 
Fuel Gauge Four Clockwise Speedometers
Fuel Gauge Four Clockwise SpeedometersFuel Gauge Four Clockwise Speedometers
Fuel Gauge Four Clockwise Speedometers
 
Supply Chain Management KPI Dashboard Showing Cost Reduction And Procurement Roi
Supply Chain Management KPI Dashboard Showing Cost Reduction And Procurement RoiSupply Chain Management KPI Dashboard Showing Cost Reduction And Procurement Roi
Supply Chain Management KPI Dashboard Showing Cost Reduction And Procurement Roi
 
Audit KPI Dashboard Showing Audit Status Auditable Entry Risk Rating
Audit KPI Dashboard Showing Audit Status Auditable Entry Risk RatingAudit KPI Dashboard Showing Audit Status Auditable Entry Risk Rating
Audit KPI Dashboard Showing Audit Status Auditable Entry Risk Rating
 
Compliance And Legal KPI Dashboard Showing Compliance Issues And Resolution Time
Compliance And Legal KPI Dashboard Showing Compliance Issues And Resolution TimeCompliance And Legal KPI Dashboard Showing Compliance Issues And Resolution Time
Compliance And Legal KPI Dashboard Showing Compliance Issues And Resolution Time
 
Procurement Purchase Order Cycle Dashboard
Procurement Purchase Order Cycle DashboardProcurement Purchase Order Cycle Dashboard
Procurement Purchase Order Cycle Dashboard
 
Status Symbol Six Horizontal Progress Bars
Status Symbol Six Horizontal Progress BarsStatus Symbol Six Horizontal Progress Bars
Status Symbol Six Horizontal Progress Bars
 

Recently uploaded

Powerpoint showing results from tik tok metrics
Powerpoint showing results from tik tok metricsPowerpoint showing results from tik tok metrics
Powerpoint showing results from tik tok metrics
CaitlinCummins3
 
Constitution of Company Article of Association
Constitution of Company Article of AssociationConstitution of Company Article of Association
Constitution of Company Article of Association
seri bangash
 
What is paper chromatography, principal, procedure,types, diagram, advantages...
What is paper chromatography, principal, procedure,types, diagram, advantages...What is paper chromatography, principal, procedure,types, diagram, advantages...
What is paper chromatography, principal, procedure,types, diagram, advantages...
srcw2322l101
 
Creating an Income Statement with Forecasts: A Simple Guide and Free Excel Te...
Creating an Income Statement with Forecasts: A Simple Guide and Free Excel Te...Creating an Income Statement with Forecasts: A Simple Guide and Free Excel Te...
Creating an Income Statement with Forecasts: A Simple Guide and Free Excel Te...
Aurelien Domont, MBA
 

Recently uploaded (20)

Raising Seed Capital by Steve Schlafman at RRE Ventures
Raising Seed Capital by Steve Schlafman at RRE VenturesRaising Seed Capital by Steve Schlafman at RRE Ventures
Raising Seed Capital by Steve Schlafman at RRE Ventures
 
بروفايل شركة ميار الخليج للاستشارات الهندسية.pdf
بروفايل شركة ميار الخليج للاستشارات الهندسية.pdfبروفايل شركة ميار الخليج للاستشارات الهندسية.pdf
بروفايل شركة ميار الخليج للاستشارات الهندسية.pdf
 
The Truth About Dinesh Bafna's Situation.pdf
The Truth About Dinesh Bafna's Situation.pdfThe Truth About Dinesh Bafna's Situation.pdf
The Truth About Dinesh Bafna's Situation.pdf
 
Blinkit: Revolutionizing the On-Demand Grocery Delivery Service.pptx
Blinkit: Revolutionizing the On-Demand Grocery Delivery Service.pptxBlinkit: Revolutionizing the On-Demand Grocery Delivery Service.pptx
Blinkit: Revolutionizing the On-Demand Grocery Delivery Service.pptx
 
Hyundai capital 2024 1q Earnings release
Hyundai capital 2024 1q Earnings releaseHyundai capital 2024 1q Earnings release
Hyundai capital 2024 1q Earnings release
 
Powerpoint showing results from tik tok metrics
Powerpoint showing results from tik tok metricsPowerpoint showing results from tik tok metrics
Powerpoint showing results from tik tok metrics
 
MichaelStarkes_UncutGemsProjectSummary.pdf
MichaelStarkes_UncutGemsProjectSummary.pdfMichaelStarkes_UncutGemsProjectSummary.pdf
MichaelStarkes_UncutGemsProjectSummary.pdf
 
Innomantra Viewpoint - Building Moonshots : May-Jun 2024.pdf
Innomantra Viewpoint - Building Moonshots : May-Jun 2024.pdfInnomantra Viewpoint - Building Moonshots : May-Jun 2024.pdf
Innomantra Viewpoint - Building Moonshots : May-Jun 2024.pdf
 
wagamamaLab presentation @MIT 20240509 IRODORI
wagamamaLab presentation @MIT 20240509 IRODORIwagamamaLab presentation @MIT 20240509 IRODORI
wagamamaLab presentation @MIT 20240509 IRODORI
 
Series A Fundraising Guide (Investing Individuals Improving Our World) by Accion
Series A Fundraising Guide (Investing Individuals Improving Our World) by AccionSeries A Fundraising Guide (Investing Individuals Improving Our World) by Accion
Series A Fundraising Guide (Investing Individuals Improving Our World) by Accion
 
Constitution of Company Article of Association
Constitution of Company Article of AssociationConstitution of Company Article of Association
Constitution of Company Article of Association
 
(推特)Twitter账号批发(自助购买网址🎉top233.com🎉)
(推特)Twitter账号批发(自助购买网址🎉top233.com🎉)(推特)Twitter账号批发(自助购买网址🎉top233.com🎉)
(推特)Twitter账号批发(自助购买网址🎉top233.com🎉)
 
Global Internal Audit Standards 2024.pdf
Global Internal Audit Standards 2024.pdfGlobal Internal Audit Standards 2024.pdf
Global Internal Audit Standards 2024.pdf
 
Creative Ideas for Interactive Team Presentations
Creative Ideas for Interactive Team PresentationsCreative Ideas for Interactive Team Presentations
Creative Ideas for Interactive Team Presentations
 
What is paper chromatography, principal, procedure,types, diagram, advantages...
What is paper chromatography, principal, procedure,types, diagram, advantages...What is paper chromatography, principal, procedure,types, diagram, advantages...
What is paper chromatography, principal, procedure,types, diagram, advantages...
 
Top^Clinic ^%[+27785538335__Safe*Women's clinic//Abortion Pills In Harare
Top^Clinic ^%[+27785538335__Safe*Women's clinic//Abortion Pills In HarareTop^Clinic ^%[+27785538335__Safe*Women's clinic//Abortion Pills In Harare
Top^Clinic ^%[+27785538335__Safe*Women's clinic//Abortion Pills In Harare
 
WAM Corporate Presentation May 2024_w.pdf
WAM Corporate Presentation May 2024_w.pdfWAM Corporate Presentation May 2024_w.pdf
WAM Corporate Presentation May 2024_w.pdf
 
The Risks of Ignoring Bookkeeping in Your Business
The Risks of Ignoring Bookkeeping in Your BusinessThe Risks of Ignoring Bookkeeping in Your Business
The Risks of Ignoring Bookkeeping in Your Business
 
Daftar Rumpun, Pohon, dan Cabang Ilmu (2024).pdf
Daftar Rumpun, Pohon, dan Cabang Ilmu (2024).pdfDaftar Rumpun, Pohon, dan Cabang Ilmu (2024).pdf
Daftar Rumpun, Pohon, dan Cabang Ilmu (2024).pdf
 
Creating an Income Statement with Forecasts: A Simple Guide and Free Excel Te...
Creating an Income Statement with Forecasts: A Simple Guide and Free Excel Te...Creating an Income Statement with Forecasts: A Simple Guide and Free Excel Te...
Creating an Income Statement with Forecasts: A Simple Guide and Free Excel Te...
 

business_kpi_dashboard_showing_average_revenue_and_clv.pptx

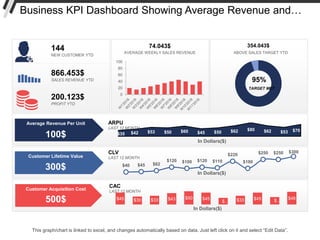
  • 1. Business KPI Dashboard Showing Average Revenue and… $45 $30 $33 $43 $50 $45 $… $33 $45 $… $48 In Dollars($) CAC LAST 12 MONTH $35 $42 $53 $50 $60 $45 $50 $62 $80 $62 $53 $70 In Dollars($) ARPU LAST 12 MONTH $40 $45 $62 $120 $100 $120 $110 $220 $100 $250 $250 $300 In Dollars($) CLV LAST 12 MONTH Customer Lifetime Value 300$ Customer Acquisition Cost 500$ Average Revenue Per Unit 100$ AVERAGE WEEKLY SALES REVENUE 74.043$ 0 20 40 60 80 100 95% TARGET MET ABOVE SALES TARGET YTD 354.043$ 144 NEW CUSTOMER YTD 866.453$ SALES REVENUE YTD 200.123$ PROFIT YTD This graph/chart is linked to excel, and changes automatically based on data. Just left click on it and select “Edit Data”.
  • 2. Instructions To Edit This Slide This slide has been made in PowerPoint using basic PowerPoint shapes, and all graphics are 100% editable in PowerPoint. You can change color, size and orientation of any element to your liking, and add/edit any piece of text anywhere.
  • 3. All images are 100% editable in PowerPoint “Change color, size and orientation of any icon to your liking”
  • 4. 1. Select the Graph and right click on "Edit Data“. 2. An excel matrix will automatically show up. 3. Enter the values based on your requirements and hit enter. 4. The Graph/Chart shape will automatically adjust according to your data, and anytime you change the value again. Edit Excel-linked Chart This is a Data Driven Chart/Graph and the shape automatically adjusts according to your data 1 2 3
  • 5. Edit Color 1. Select the shape to change the color and Right click the object (click any object which you want to change color) 2. Choose Format Data Series in the dialog box. 3. Choose “Fill” in the Format Shape box then “Solid” or “Gradient” depending on the appearance of the object. Change colour as shown in the picture. 1 2 3
  • 6. Select From Thousands Of Editable Icons On Every Topic These icons are available at the Icons section on www.slideteam.net