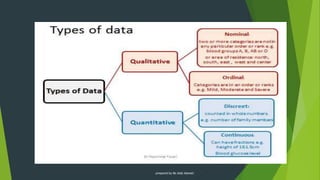
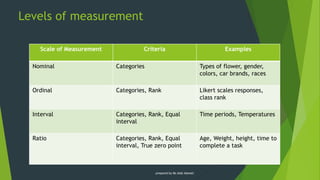
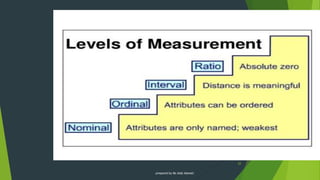
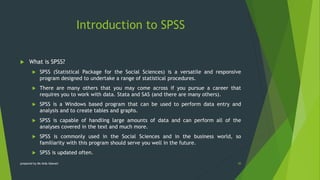
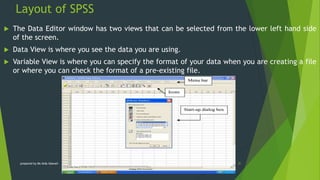
Presentation is made by the student of M.phil Jameel Ahmed Qureshi Faculty of Education Elsa Kazi campus Hyderabad UoS Jamshoron, This presentation is an assignment assign by the Dr. Mumtaz Khwaja
These introductory statistics slides will give you a basic understanding of statistics, types of statistics, variable and its types, the levels of measurements, data collection techniques, and types of sampling.
NCV 3 Business Practice Hands-On Support Slide Show - Module 6Future Managers
This slide show complements the learner guide NCV 3 Business Practice Hands-On Training by Nickey Cilliers, published by Future Managers Pty Ltd. For more information visit our website www.futuremanagers.net
13 Week Four Evaluation Data Sources and DeveCicelyBourqueju
1
3
Week Four: Evaluation Data Sources and Development of Instruments
Jane Doe
The University of Arizona Global Campus
RES7440: Advanced Study in Qualitative Research (QAF135DS)
Dr. John Doe
September 21, 2021
Week Four: Evaluation Data Sources and Development of Instruments
Overview of The Data Source
A questionnaire is an instrument of research used to collect information from respondents and consists of questions and other prompts. A questionnaire can be open-ended or closed-ended although most research questionnaires are usually a mixture of the two. Questionnaires can be used to collect both qualitative and quantitative data depending on the type of research being conducted (Mutepfa & Tapera, 2019). Open-ended questions in questionnaires allow the respondent to express their thoughts, unlike close-ended questions. A questionnaire may be used as an independent data source in research or can be administered as part of a survey. Questions in a questionnaire are usually simple and easy for the respondent to understand (Mutepfa & Tapera, 2019).
The main purpose of a questionnaire in research is to obtain data from the respondents. This data is in turn used to make meaningful insights regarding the research topic, such as hypothesis testing. According to Salemink et al., 2020, questionnaires help in accomplishing the research objectives (p.691). Through multiple-choice questions and ranking or rating scales, questionnaires help the researcher collect information on attitudes, behaviors, opinions, and preferences. Using closed-ended questions, the researcher gets to gather information based on facts. Another purpose of a questionnaire is to avoid bias in research because a well-written questionnaire collects accurate information and avoids bias (Mutepfa & Tapera, 2019).
A well-designed questionnaire allows a researcher to gather a lot of information within a short time and is therefore quick and cost-effective. Responses gathered from questionnaires can also be compared with historical data to determine changes in the choices and experiences of respondents. Questionnaires also allow for anonymity as respondents can answer the questions without revealing their identities. A good research questionnaire should be uniform so that all respondents answer the same questions. It should also be exploratory enough not to limit data collection. There should be a structured flow of questions in questionnaires so that participants can easily respond to them (Mutepfa & Tapera, 2019).
This data source is a study by Zou et al. which was published in 2020. The title of the study is "The impact of the Covid-19 pandemic on firms: a survey in Guangdong Province, China". In this study, the authors aimed to assess how the pandemic has impacted firms. The researchers conducted a survey in 15 cities in Guangdong province and involved 524 firms in the study. The firm's executives were the respondents to the questionnaire which was developed from previous st ...
Chatty Kathy - UNC Bootcamp Final Project Presentation - Final Version - 5.23...John Andrews
SlideShare Description for "Chatty Kathy - UNC Bootcamp Final Project Presentation"
Title: Chatty Kathy: Enhancing Physical Activity Among Older Adults
Description:
Discover how Chatty Kathy, an innovative project developed at the UNC Bootcamp, aims to tackle the challenge of low physical activity among older adults. Our AI-driven solution uses peer interaction to boost and sustain exercise levels, significantly improving health outcomes. This presentation covers our problem statement, the rationale behind Chatty Kathy, synthetic data and persona creation, model performance metrics, a visual demonstration of the project, and potential future developments. Join us for an insightful Q&A session to explore the potential of this groundbreaking project.
Project Team: Jay Requarth, Jana Avery, John Andrews, Dr. Dick Davis II, Nee Buntoum, Nam Yeongjin & Mat Nicholas
Adjusting primitives for graph : SHORT REPORT / NOTESSubhajit Sahu
Graph algorithms, like PageRank Compressed Sparse Row (CSR) is an adjacency-list based graph representation that is
Multiply with different modes (map)
1. Performance of sequential execution based vs OpenMP based vector multiply.
2. Comparing various launch configs for CUDA based vector multiply.
Sum with different storage types (reduce)
1. Performance of vector element sum using float vs bfloat16 as the storage type.
Sum with different modes (reduce)
1. Performance of sequential execution based vs OpenMP based vector element sum.
2. Performance of memcpy vs in-place based CUDA based vector element sum.
3. Comparing various launch configs for CUDA based vector element sum (memcpy).
4. Comparing various launch configs for CUDA based vector element sum (in-place).
Sum with in-place strategies of CUDA mode (reduce)
1. Comparing various launch configs for CUDA based vector element sum (in-place).
More Related Content
Similar to Chapter 3 Introduction to Statisticss.pptx
These introductory statistics slides will give you a basic understanding of statistics, types of statistics, variable and its types, the levels of measurements, data collection techniques, and types of sampling.
NCV 3 Business Practice Hands-On Support Slide Show - Module 6Future Managers
This slide show complements the learner guide NCV 3 Business Practice Hands-On Training by Nickey Cilliers, published by Future Managers Pty Ltd. For more information visit our website www.futuremanagers.net
13 Week Four Evaluation Data Sources and DeveCicelyBourqueju
1
3
Week Four: Evaluation Data Sources and Development of Instruments
Jane Doe
The University of Arizona Global Campus
RES7440: Advanced Study in Qualitative Research (QAF135DS)
Dr. John Doe
September 21, 2021
Week Four: Evaluation Data Sources and Development of Instruments
Overview of The Data Source
A questionnaire is an instrument of research used to collect information from respondents and consists of questions and other prompts. A questionnaire can be open-ended or closed-ended although most research questionnaires are usually a mixture of the two. Questionnaires can be used to collect both qualitative and quantitative data depending on the type of research being conducted (Mutepfa & Tapera, 2019). Open-ended questions in questionnaires allow the respondent to express their thoughts, unlike close-ended questions. A questionnaire may be used as an independent data source in research or can be administered as part of a survey. Questions in a questionnaire are usually simple and easy for the respondent to understand (Mutepfa & Tapera, 2019).
The main purpose of a questionnaire in research is to obtain data from the respondents. This data is in turn used to make meaningful insights regarding the research topic, such as hypothesis testing. According to Salemink et al., 2020, questionnaires help in accomplishing the research objectives (p.691). Through multiple-choice questions and ranking or rating scales, questionnaires help the researcher collect information on attitudes, behaviors, opinions, and preferences. Using closed-ended questions, the researcher gets to gather information based on facts. Another purpose of a questionnaire is to avoid bias in research because a well-written questionnaire collects accurate information and avoids bias (Mutepfa & Tapera, 2019).
A well-designed questionnaire allows a researcher to gather a lot of information within a short time and is therefore quick and cost-effective. Responses gathered from questionnaires can also be compared with historical data to determine changes in the choices and experiences of respondents. Questionnaires also allow for anonymity as respondents can answer the questions without revealing their identities. A good research questionnaire should be uniform so that all respondents answer the same questions. It should also be exploratory enough not to limit data collection. There should be a structured flow of questions in questionnaires so that participants can easily respond to them (Mutepfa & Tapera, 2019).
This data source is a study by Zou et al. which was published in 2020. The title of the study is "The impact of the Covid-19 pandemic on firms: a survey in Guangdong Province, China". In this study, the authors aimed to assess how the pandemic has impacted firms. The researchers conducted a survey in 15 cities in Guangdong province and involved 524 firms in the study. The firm's executives were the respondents to the questionnaire which was developed from previous st ...
1
3
Week Four: Evaluation Data Sources and Development of Instruments
Jane Doe
The University of Arizona Global Campus
RES7440: Advanced Study in Qualitative Research (QAF135DS)
Dr. John Doe
September 21, 2021
Week Four: Evaluation Data Sources and Development of Instruments
Overview of The Data Source
A questionnaire is an instrument of research used to collect information from respondents and consists of questions and other prompts. A questionnaire can be open-ended or closed-ended although most research questionnaires are usually a mixture of the two. Questionnaires can be used to collect both qualitative and quantitative data depending on the type of research being conducted (Mutepfa & Tapera, 2019). Open-ended questions in questionnaires allow the respondent to express their thoughts, unlike close-ended questions. A questionnaire may be used as an independent data source in research or can be administered as part of a survey. Questions in a questionnaire are usually simple and easy for the respondent to understand (Mutepfa & Tapera, 2019).
The main purpose of a questionnaire in research is to obtain data from the respondents. This data is in turn used to make meaningful insights regarding the research topic, such as hypothesis testing. According to Salemink et al., 2020, questionnaires help in accomplishing the research objectives (p.691). Through multiple-choice questions and ranking or rating scales, questionnaires help the researcher collect information on attitudes, behaviors, opinions, and preferences. Using closed-ended questions, the researcher gets to gather information based on facts. Another purpose of a questionnaire is to avoid bias in research because a well-written questionnaire collects accurate information and avoids bias (Mutepfa & Tapera, 2019).
A well-designed questionnaire allows a researcher to gather a lot of information within a short time and is therefore quick and cost-effective. Responses gathered from questionnaires can also be compared with historical data to determine changes in the choices and experiences of respondents. Questionnaires also allow for anonymity as respondents can answer the questions without revealing their identities. A good research questionnaire should be uniform so that all respondents answer the same questions. It should also be exploratory enough not to limit data collection. There should be a structured flow of questions in questionnaires so that participants can easily respond to them (Mutepfa & Tapera, 2019).
This data source is a study by Zou et al. which was published in 2020. The title of the study is "The impact of the Covid-19 pandemic on firms: a survey in Guangdong Province, China". In this study, the authors aimed to assess how the pandemic has impacted firms. The researchers conducted a survey in 15 cities in Guangdong province and involved 524 firms in the study. The firm's executives were the respondents to the questionnaire which was developed from previous st ...
Chatty Kathy - UNC Bootcamp Final Project Presentation - Final Version - 5.23...John Andrews
SlideShare Description for "Chatty Kathy - UNC Bootcamp Final Project Presentation"
Title: Chatty Kathy: Enhancing Physical Activity Among Older Adults
Description:
Discover how Chatty Kathy, an innovative project developed at the UNC Bootcamp, aims to tackle the challenge of low physical activity among older adults. Our AI-driven solution uses peer interaction to boost and sustain exercise levels, significantly improving health outcomes. This presentation covers our problem statement, the rationale behind Chatty Kathy, synthetic data and persona creation, model performance metrics, a visual demonstration of the project, and potential future developments. Join us for an insightful Q&A session to explore the potential of this groundbreaking project.
Project Team: Jay Requarth, Jana Avery, John Andrews, Dr. Dick Davis II, Nee Buntoum, Nam Yeongjin & Mat Nicholas
Adjusting primitives for graph : SHORT REPORT / NOTESSubhajit Sahu
Graph algorithms, like PageRank Compressed Sparse Row (CSR) is an adjacency-list based graph representation that is
Multiply with different modes (map)
1. Performance of sequential execution based vs OpenMP based vector multiply.
2. Comparing various launch configs for CUDA based vector multiply.
Sum with different storage types (reduce)
1. Performance of vector element sum using float vs bfloat16 as the storage type.
Sum with different modes (reduce)
1. Performance of sequential execution based vs OpenMP based vector element sum.
2. Performance of memcpy vs in-place based CUDA based vector element sum.
3. Comparing various launch configs for CUDA based vector element sum (memcpy).
4. Comparing various launch configs for CUDA based vector element sum (in-place).
Sum with in-place strategies of CUDA mode (reduce)
1. Comparing various launch configs for CUDA based vector element sum (in-place).
Opendatabay - Open Data Marketplace.pptxOpendatabay
Opendatabay.com unlocks the power of data for everyone. Open Data Marketplace fosters a collaborative hub for data enthusiasts to explore, share, and contribute to a vast collection of datasets.
First ever open hub for data enthusiasts to collaborate and innovate. A platform to explore, share, and contribute to a vast collection of datasets. Through robust quality control and innovative technologies like blockchain verification, opendatabay ensures the authenticity and reliability of datasets, empowering users to make data-driven decisions with confidence. Leverage cutting-edge AI technologies to enhance the data exploration, analysis, and discovery experience.
From intelligent search and recommendations to automated data productisation and quotation, Opendatabay AI-driven features streamline the data workflow. Finding the data you need shouldn't be a complex. Opendatabay simplifies the data acquisition process with an intuitive interface and robust search tools. Effortlessly explore, discover, and access the data you need, allowing you to focus on extracting valuable insights. Opendatabay breaks new ground with a dedicated, AI-generated, synthetic datasets.
Leverage these privacy-preserving datasets for training and testing AI models without compromising sensitive information. Opendatabay prioritizes transparency by providing detailed metadata, provenance information, and usage guidelines for each dataset, ensuring users have a comprehensive understanding of the data they're working with. By leveraging a powerful combination of distributed ledger technology and rigorous third-party audits Opendatabay ensures the authenticity and reliability of every dataset. Security is at the core of Opendatabay. Marketplace implements stringent security measures, including encryption, access controls, and regular vulnerability assessments, to safeguard your data and protect your privacy.
StarCompliance is a leading firm specializing in the recovery of stolen cryptocurrency. Our comprehensive services are designed to assist individuals and organizations in navigating the complex process of fraud reporting, investigation, and fund recovery. We combine cutting-edge technology with expert legal support to provide a robust solution for victims of crypto theft.
Our Services Include:
Reporting to Tracking Authorities:
We immediately notify all relevant centralized exchanges (CEX), decentralized exchanges (DEX), and wallet providers about the stolen cryptocurrency. This ensures that the stolen assets are flagged as scam transactions, making it impossible for the thief to use them.
Assistance with Filing Police Reports:
We guide you through the process of filing a valid police report. Our support team provides detailed instructions on which police department to contact and helps you complete the necessary paperwork within the critical 72-hour window.
Launching the Refund Process:
Our team of experienced lawyers can initiate lawsuits on your behalf and represent you in various jurisdictions around the world. They work diligently to recover your stolen funds and ensure that justice is served.
At StarCompliance, we understand the urgency and stress involved in dealing with cryptocurrency theft. Our dedicated team works quickly and efficiently to provide you with the support and expertise needed to recover your assets. Trust us to be your partner in navigating the complexities of the crypto world and safeguarding your investments.
As Europe's leading economic powerhouse and the fourth-largest hashtag#economy globally, Germany stands at the forefront of innovation and industrial might. Renowned for its precision engineering and high-tech sectors, Germany's economic structure is heavily supported by a robust service industry, accounting for approximately 68% of its GDP. This economic clout and strategic geopolitical stance position Germany as a focal point in the global cyber threat landscape.
In the face of escalating global tensions, particularly those emanating from geopolitical disputes with nations like hashtag#Russia and hashtag#China, hashtag#Germany has witnessed a significant uptick in targeted cyber operations. Our analysis indicates a marked increase in hashtag#cyberattack sophistication aimed at critical infrastructure and key industrial sectors. These attacks range from ransomware campaigns to hashtag#AdvancedPersistentThreats (hashtag#APTs), threatening national security and business integrity.
🔑 Key findings include:
🔍 Increased frequency and complexity of cyber threats.
🔍 Escalation of state-sponsored and criminally motivated cyber operations.
🔍 Active dark web exchanges of malicious tools and tactics.
Our comprehensive report delves into these challenges, using a blend of open-source and proprietary data collection techniques. By monitoring activity on critical networks and analyzing attack patterns, our team provides a detailed overview of the threats facing German entities.
This report aims to equip stakeholders across public and private sectors with the knowledge to enhance their defensive strategies, reduce exposure to cyber risks, and reinforce Germany's resilience against cyber threats.
2. Objectives
Successful students will be able to:
Define the meaning of Statistics and other terms
Describe the types of statistics
Describe the sources of data, the types of data and variable
Understand the level of measurement
Become familiar with SPSS
2
prepared by Ms Aida Idawati
3. 1.1 Definition
3
Statistics is a science that involves the efficient use of numerical data relating to group of
individuals (or trial).
As widely known, ‘statistics’ is defined as the science of:
◦ Collecting
◦ Organizing
◦ Summarizing
◦ Analyzing
◦ Interpreting numerical data
to efficiently help the process of making decisions.
prepared by Ms Aida Idawati
4. 1.2 Populations & Samples
Another important aspect of statistics that needs to be dealt with is to be
able to differentiate a sample from a population
◦ Population → a very large amount of data, where making a complete sampling of all
of the population would be impractical or impossible.
◦ Sample →a subset of the population . Samples are collected and statistics are
calculated from the samples in order to make the conclusions about the populations.
4
prepared by Ms Aida Idawati
6. 1.3 Types of Statistics
6
There are 2 types of Statistics
Descriptive Statistics
Describes the sample data
Inferential Statistics
Reach conclusions that go beyond the existing data
prepared by Ms Aida Idawati
7. Definition of Descriptive Statistics
7
• The statistical methods used to describe the basic features of the data that have been collected in a
study.
• Consists of organizing and summarizing the information collected.
• Describes the information collected through numerical measurements, charts, graphs and tables.
prepared by Ms Aida Idawati
8. Definition of Inferential Statistics
8
• Uses data that have been collected from a small group to draw conclusions about the larger group.
• These methods are used to make decisions
• These includes the t – test, Analysis of variance, etc.
prepared by Ms Aida Idawati
9. 1.4 Sources of Data
9
There are two sources of data
1. Primary data: the specific information collected by the person who is doing the research. They
collect data through surveys, interviews, direct observations and experiments.
2. Secondary data : any material that has been collected Eg. Data from Statistical department of
Malaysia
prepared by Ms Aida Idawati
10. Primary Data
10
• Data is collected by researchers, for a specific
research.
1. Surveys:
describing, recording, analyzing and interpreting conditions that exist
or existed by asking from respondents.
i. Face-to-face interview
ii. Phone interview
iii. Questionaire
2. Observations:
the information is sought by way of investigators own direct observation
without asking from respondents.
3. Experiments:
investigators manipulate variable to study the effects on respondents.
prepared by Ms Aida Idawati
11. Face-to-face interview
11
Two-way communication.
Researcher asks question directly to respondent.
Advantages:
Precise answer.
Minimizes non-responses.
Allows for in-depth questioning.
Disadvantages:
Expensive.
Interviewer might influence respondent’s responses.
Respondent may refuse to answer sensitive or personal question.
prepared by Ms Aida Idawati
12. Phone Interview
12
Advantages:
Fast.
Less costly.
Wider respondent coverage.
less interviewer bias than personal interview
Disadvantages:
Information obtained might not represent the whole population.
Limited interview duration.
Not appropriate for long and contemplate question.
Low response rate (unanswered calls).
prepared by Ms Aida Idawati
13. Questionnaire
13
• A set of questions to obtain related information for a
conducted study.
posted to respondents either by postal service or email or
website.
Advantages:
Wider respondent coverage.
Respondent have enough time to answer questions.
Minimizes interviewer bias
Cost effective.
Disadvantages:
One-way interaction.
Low response rate.
Not suitable for numerous and hard questions.
Time consuming (faster on internet).
Questionnaire may be answered by unqualified respondent.
prepared by Ms Aida Idawati
14. Observation
14
Observing and measuring specific characteristics without
attempting to modify the subjects being studied.
Record human behaviour, objects and situations without
asking the respondent.
E.g. In a study relating to consumer behaviour, the investigator
instead of asking the make of car used by the respondent, look at
the car directly.
Advantages:
Direct observation of actual situation.
Minimizes response bias.
Disadvantages:
Limited to specific observable subjects or behaviour.
May be time consuming.
prepared by Ms Aida Idawati
15. EXPERIMENT
investigators manipulate variable to study the effects on
respondents.
e.g. A bank may conduct an experiment to know what
attracts depositors: profit or security or liquidity.
Advantages:
Designed to suit purpose.
May use actual clients (field) or volunteers (lab).
Disadvantages:
May be costly.
15
prepared by Ms Aida Idawati
16. 1.5 Types of data
16
There are two types of data
1. Qualitative
provide items in a variety of quality or categories.
classification or characteristic.
Such as gender, age, occupation or courses.
2. Quantitative
Data that measures or identifies based on a numerical scale
Quantitative data can be further classified as either discrete or continuous.
a. Discrete variable
b. Continuous variables
prepared by Ms Aida Idawati
18. Exercise 1
1. Identify each of the following as an example of (1) attribute
(qualitative) or (2) numerical (quantitative) variables.
The number of stop signs in town of less than 500 people.
quantitative
Whether or not a camera is defective.
Qualitative
The number of questions answered correctly on a standardized test.
quantitative
The length of time required to answer a telephone call at a certain real
estate office.
quantitative
18
18
prepared by Ms Aida Idawati
19. • 1. 6 Variables
19
prepared by Ms Aida Idawati
20. 1.7 Levels of measurement
20
1. Nominal : categorizes responses (eg. Gender, favorite color)
2. Ordinal : allow comparisons of the degree, Class Rank (eg. poor, average, good & excellent)
3. Interval : numerical scales in which intervals have the same interpretation (eg. 30 degrees & 40
degrees)
4. Ratio : have a value of zero (eg. the number of clients in past six months)
prepared by Ms Aida Idawati
21. Levels of measurement
21
Scale of Measurement Criteria Examples
Nominal Categories Types of flower, gender,
colors, car brands, races
Ordinal Categories, Rank Likert scales responses,
class rank
Interval Categories, Rank, Equal
interval
Time periods, Temperatures
Ratio Categories, Rank, Equal
interval, True zero point
Age, Weight, height, time to
complete a task
prepared by Ms Aida Idawati
24. Nominal
24
A qualitative variable that characterizes (or
describes/names) an element of a population.
Arithmetic operations are not meaningful for such data.
Order or rank cannot be assigned to the categories.
Examples:
Survey responses:- Yes, No.
Gender: Male, Female.
prepared by Ms Aida Idawati
25. Ordinal
25
A qualitative variable that incorporates an ordered
position, or ranking.
Differences between data values either cannot be
determined or are meaningless.
Examples:
Level of satisfaction: “very satisfied”, “satisfied”,
“somewhat satisfied”.
Course grades:- A, B, C, D, or F.
prepared by Ms Aida Idawati
26. Interval
26
Involves a quantitative variable.
A scale where distances between data are
meaningful.
Differences make sense, but ratios do not :
e.g., 30°-20°C = 20C°-10C°, but 20°C/10°C
is not twice as hot!).
No natural zero
prepared by Ms Aida Idawati
27. Interval
27
Examples:
Temperature scales are interval data with 25oC
warmer than 20oC and a 5oC difference has
some physical meaning.
Note that 0oC is arbitrary, so that it does not make sense
to say that 20oC is twice as hot as 10oC.
The year 0 is arbitrary and it is not sensible to
say that the year 2000 is twice as old as the
year 1000.
prepared by Ms Aida Idawati
28. Ratio
28
A scale in which both intervals between values
and ratios of values are meaningful.
A real zero point.
Examples:
- Temperature measured in degrees Kelvin is
a ratio scale because we know a meaningful
zero point (absolute zero).
- Physical measurements of height, weight,
length are typically ratio variables. It is now
meaningful to say that 10 m is twice as long
as 5 m. This is because there is a natural
zero. prepared by Ms Aida Idawati
29. Exercise 2
29
Classify each type of data:
a. Ratings of newscasts in Malaysia.
(poor, fair, good, excellent)
b. Temperature of automatic popcorn
poppers.
c. Marital status of respondents to a
survey on saving accounts.
d. Age of students enrolled in a martial
arts course.
e. Salaries of cashiers of C-Mart stores.
ordinal
interval
nominal
ratio
ratio
prepared by Ms Aida Idawati
30. Introduction to SPSS
What is SPSS?
SPSS (Statistical Package for the Social Sciences) is a versatile and responsive
program designed to undertake a range of statistical procedures.
There are many others that you may come across if you pursue a career that
requires you to work with data. Stata and SAS (and there are many others).
SPSS is a Windows based program that can be used to perform data entry and
analysis and to create tables and graphs.
SPSS is capable of handling large amounts of data and can perform all of the
analyses covered in the text and much more.
SPSS is commonly used in the Social Sciences and in the business world, so
familiarity with this program should serve you well in the future.
SPSS is updated often.
30
prepared by Ms Aida Idawati
31. Layout of SPSS
The Data Editor window has two views that can be selected from the lower left hand side
of the screen.
Data View is where you see the data you are using.
Variable View is where you can specify the format of your data when you are creating a file
or where you can check the format of a pre-existing file.
31
prepared by Ms Aida Idawati
32. The other most commonly used SPSS window is the SPSS Viewer window which displays the output
from any analyses that have been run and any error messages.
32
prepared by Ms Aida Idawati
33. Exercise 3
1. Explain the differences between primary and secondary data.
2. Determine whether each of the following statements is TRUE or FALSE.
◦ If a researcher uses descriptive statistics, the researcher will be able to conclude about the
population based on a sample.
◦ Marital status is an example of a qualitative data.
◦ The highest level of measurement is the ratio level.
3. Determine whether each of the following variables is qualitative or quantitative.
o Number of children in a group families
o Monthly amount spend on electricity for the last 12 months.
o Favorite foods
o Most likely waiting period at a clinic (morning, afternoon, or evening)
o The temperatures for 31 consecutive days in January
o Height of students in a classroom
o Monthly earnings of employees.
33
prepared by Ms Aida Idawati