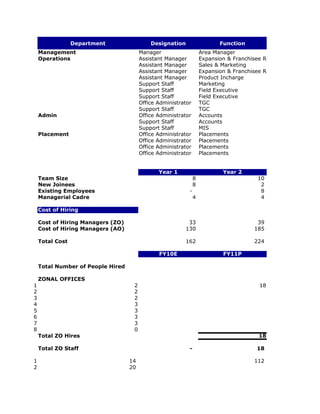
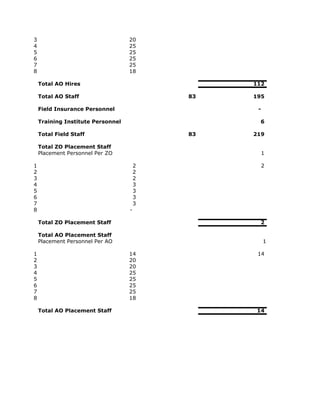
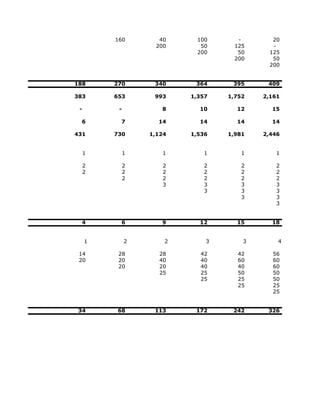
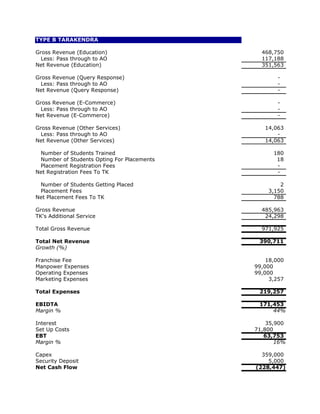
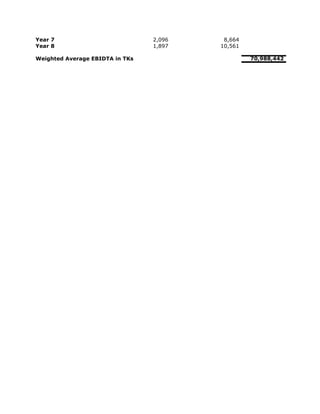
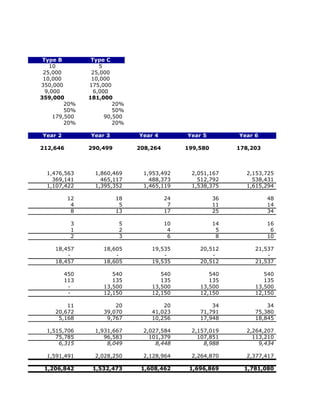
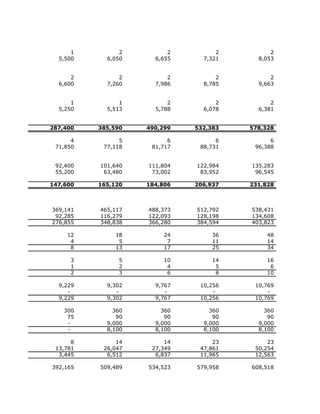
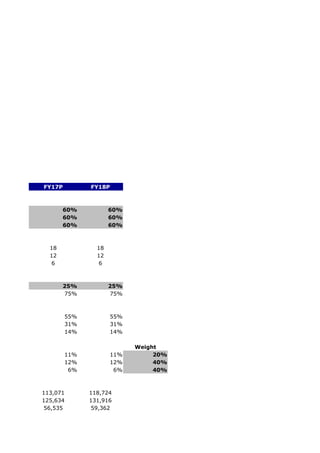
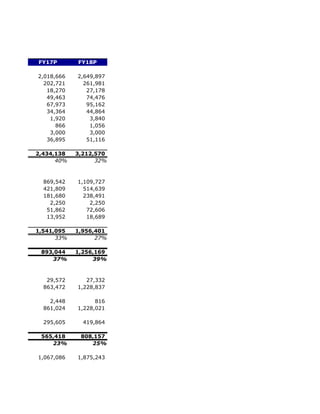
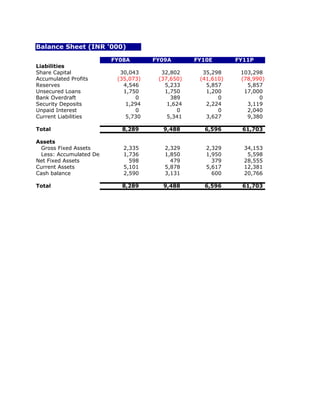
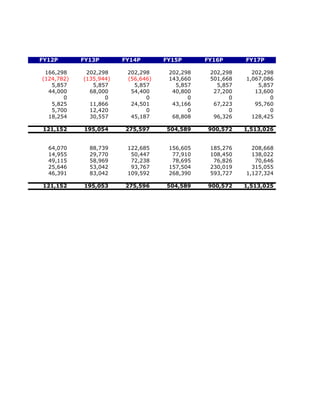
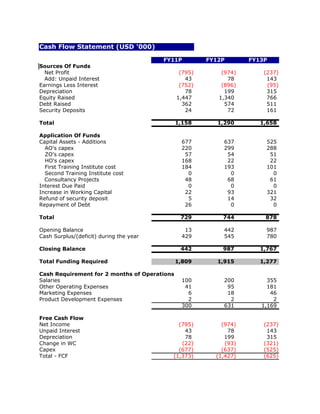
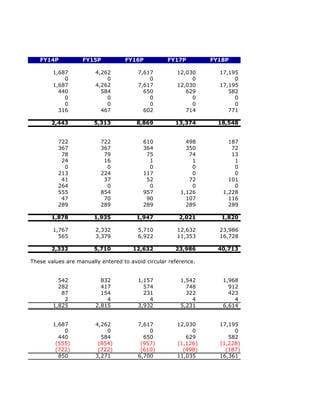
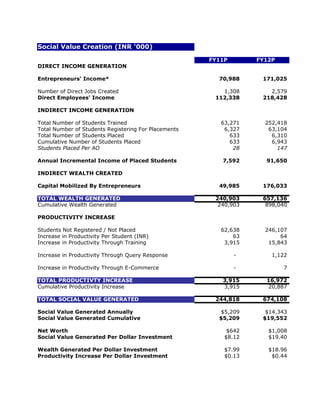
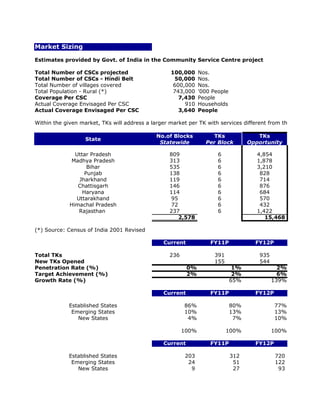
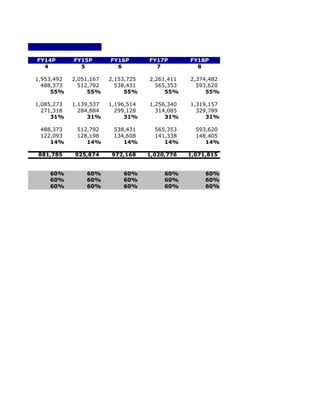
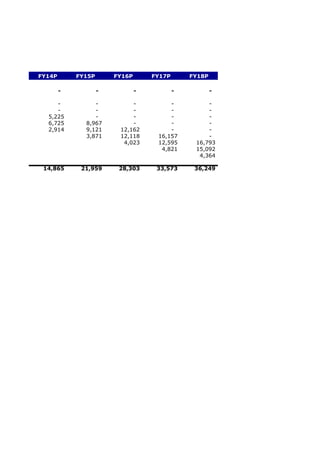
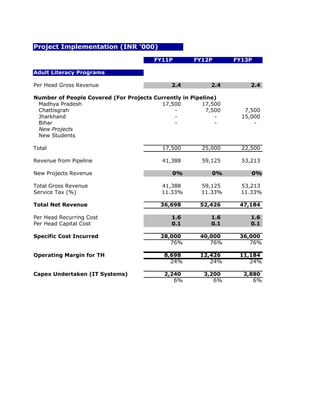
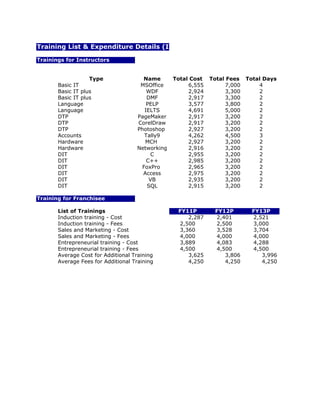
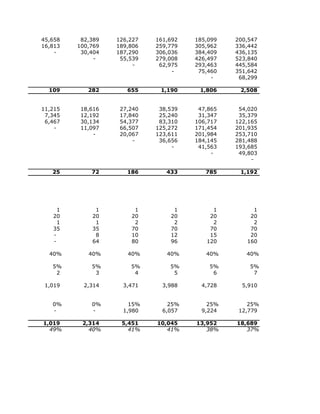
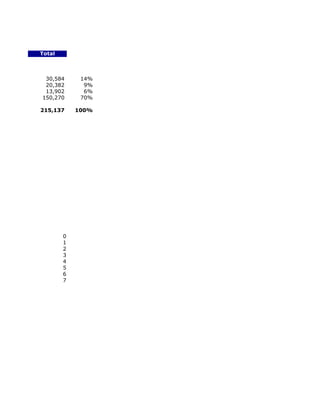
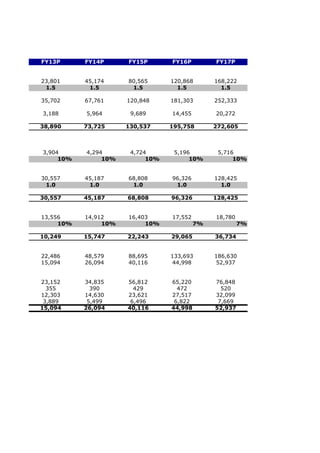
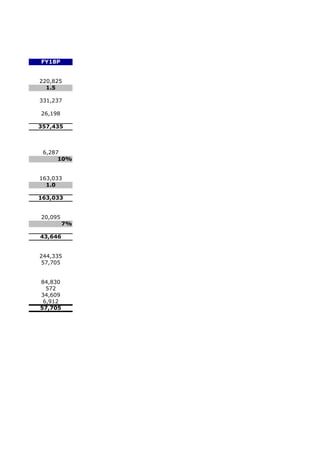
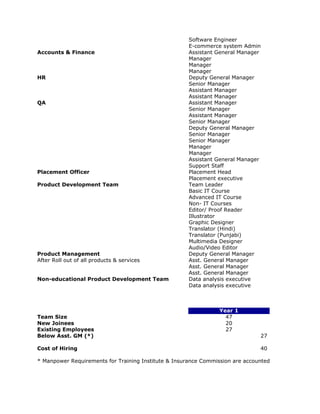
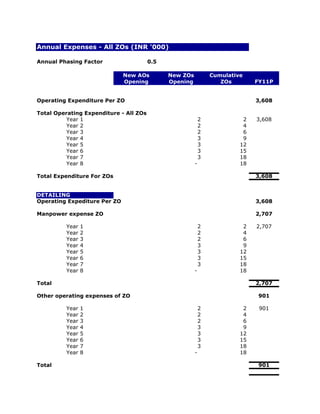
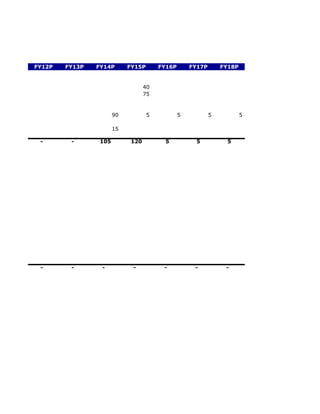
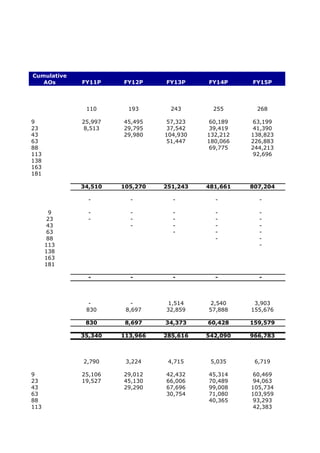
The document provides operational and financial projections for TARAhaat Information & Marking Services Limited from FY 2010-11 through FY 2017-18. Key highlights include an expected increase in the number of TARA Kendras (training centers) from 391 in FY 2011 to over 10,000 by FY 2018 along with growth in total revenue from INR 80 million to over INR 3 billion. While losses are projected in early years, the company expects to become profitable by FY 2014 with net profits growing over 25% annually through FY 2018. The projections assume continued expansion of training centers and programs along with increasing student placements and associated revenues.

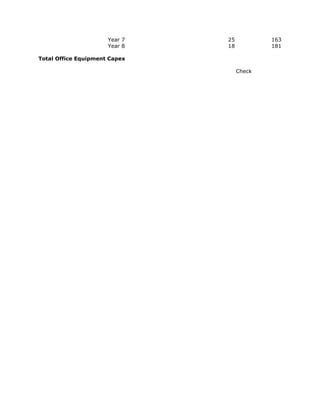
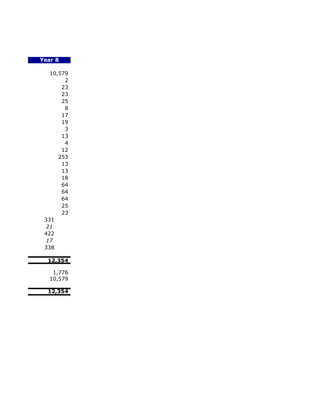
![Summary Information
Monetary Values in INR '000
Select Scenario Here
Base Case Scenario (BC) Normal Case 100% 100%
FY09A FY10E FY11P FY12P FY13P FY14P FY15P FY16P FY17P FY18P
OPERATIONAL INFORMATION
Number of TARA Kendras (TK) Added (19) 106 155 544 934 1,267 1,683 1,749 2,096 1,897
Number of TARA Kendras (TK) Cumulative 130 236 391 935 1,869 3,136 4,819 6,568 8,664 10,561
Number of Area Offices (AO) Added 2 - 14 20 20 25 25 25 25 18
Number of Area Offices (AO) Cumulative 9 9 23 43 63 88 113 138 163 181
TKs per AO 14 26 17 22 30 36 43 48 53 58
Number of Zonal Offices (ZO) Added 2 2 2 3 3 3 3 -
Number of Zonal Offices (ZO) Cumulative - - 2 4 6 9 12 15 18 18
AOs per ZO 12 11 11 10 9 9 9 10
Total Headcount (HO) 27 27 47 57 61 63 63 65 66 68
Total Headcount (Field) 83 83 219 431 730 1,124 1,536 1,981 2,446 2,845
Total Headcount (Field) Growth (%) 0% 164% 97% 69% 54% 37% 29% 23% 16%
Total Students Placed 633 6,310 22,708 38,100 97,581 133,004 175,450 213,868
Total Placement Staff (All AOs) 14 34 68 113 172 242 326 414
Students Placed Per AO Placement Staff Per Month 4 15 28 28 47 46 45 43
FINANCIAL INFORMATION
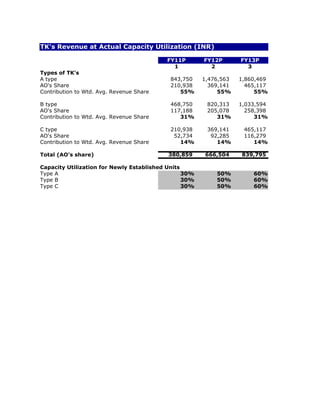
Total Revenue 16,648 17,140 80,864 186,275 377,056 659,699 1,149,827 1,738,377 2,434,138 3,212,570
Revenue growth (%) 372% 130% 102% 75% 74% 51% 40% 32%
EBIDTA (3,106) (4,010) (31,692) (32,775) 10,373 117,451 324,125 582,470 893,044 1,256,169
EBIDTA Margin (%) -19% -23% -39% -18% 3% 18% 28% 34% 37% 39%
Net Profit / (Loss) (2,576) (3,960) (37,380) (45,792) (11,162) 79,298 200,306 358,008 565,418 808,157
Net Profit Margin (%) -15% -23% -46% -25% -3% 12% 17% 21% 23% 25%
TK Related [Field] Revenue 8,272 12,940 42,959 131,210 324,852 619,687 1,100,994 1,661,763 2,326,015 3,064,648
Revenue per TK 64 55 110 140 174 198 228 253 268 290
Revenue per TK growth (%) -14% 101% 28% 24% 14% 16% 11% 6% 8%
Revenue per AO 1,850 1,904 3,516 4,332 5,985 7,497 10,175 12,597 14,933 17,749
Revenue per AO growth (%) 85% 23% 38% 25% 36% 24% 19% 19%
EBIDTA per AO (345) (446) (1,378) (762) 165 1,335 2,868 4,221 5,479 6,940
Revenue Per Employee (Field) 100 156 196 304 445 551 717 839 951 1,077
Revenue Per Employee Growth (%) 56% 26% 55% 46% 24% 30% 17% 13% 13%
TKs per field employee 1.57 2.84 1.78 2.17 2.56 2.79 3.14 3.32 3.54 3.71
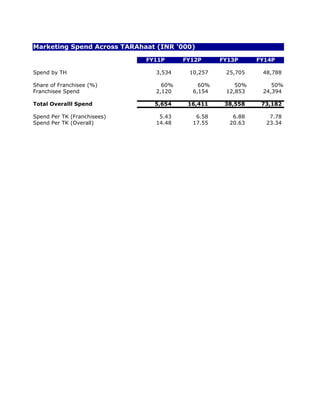
Marketing Spend per TK 9.05 10.97 13.75 15.56 18.06 19.87 20.97 22.58
Summary businessplansample-091111061657-phpapp02.xls 7 of 158](https://image.slidesharecdn.com/businessplansample-091111061657-phpapp02/85/Business-Plan-Sample-7-320.jpg)
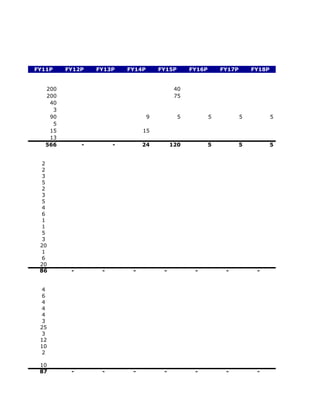
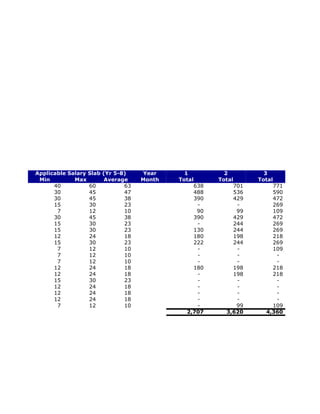
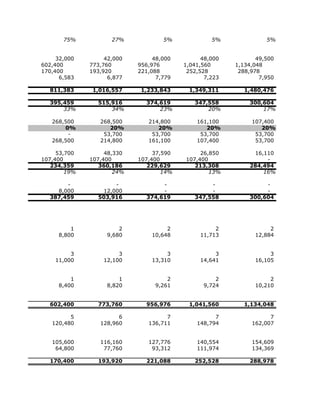
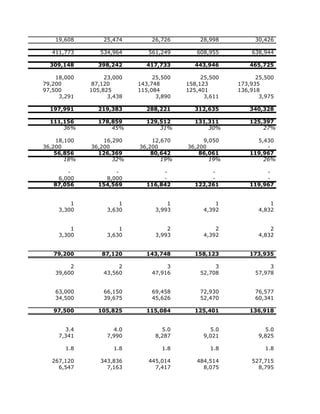
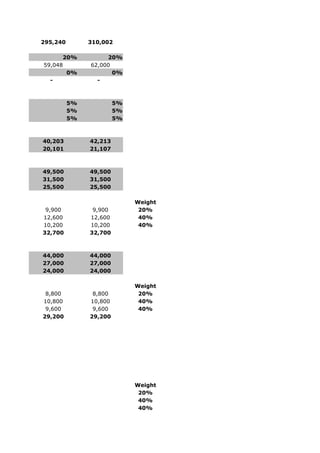
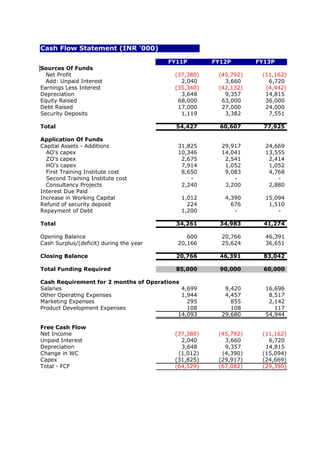
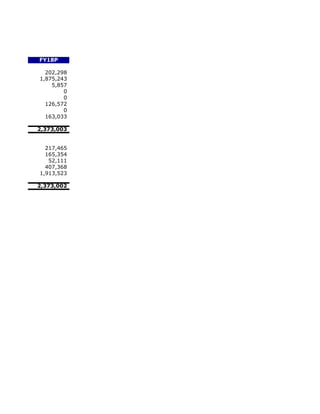
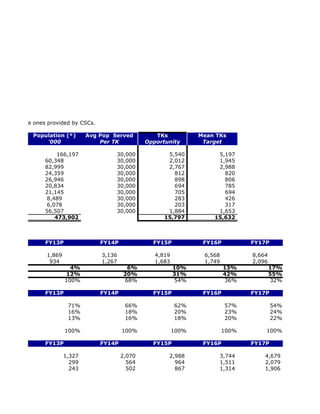
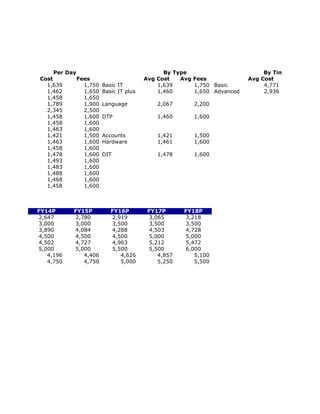
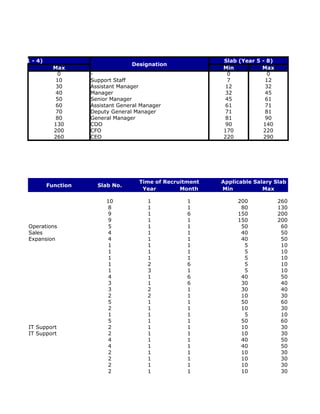
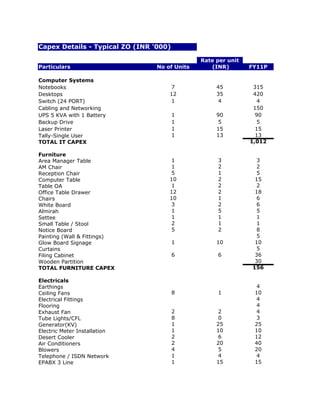
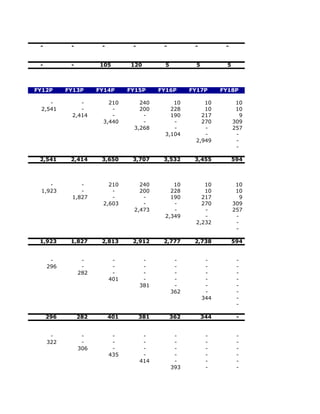
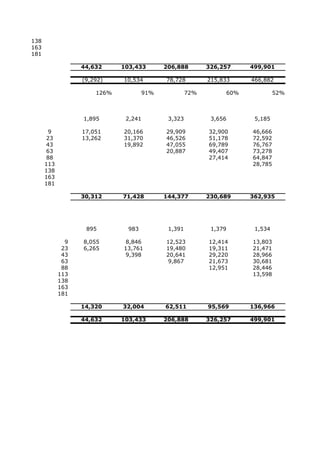
![Funding Details (INR '000)
FY11P FY12P FY13P FY14P
Total Capital Required 85,000 90,000 60,000
Fixed Assets 28,555 49,115 58,969 72,238
Total Debt Available (xFA) 0.75 0.75 0.75 0.75
Total Debt Possible [1] 21,417 36,836 44,227 54,179
Debt Portion 20% 30% 40% 0%
Debt Raised 17,000 27,000 24,000 -
Total Debt 18,200 44,000 68,000 68,000
Repayment Schedule 0% 0% 0% 20%
Repayment 1,200 13,600
O/S Debt 17,000 44,000 68,000 54,400
12% 12% 12% 12%
Interest Cost Accrued 2,040 3,660 6,720 7,344
Interest Paid - - - 19,764
EBIT (35,340) (42,132) (4,442) 96,774
Interest Coverage Ratio (17.32) (11.51) (0.66) 3.57
Debt Service Coverage Ratio (10.91) (11.51) (0.66) 4.62
Equity Raised 68,000 63,000 36,000 0
Total Equity 103,298 166,298 202,298 202,298
Debt / Equity 0.18 0.26 0.34 0.34
[1] Based on the assumption that a bank will not extend more debt than 0.75x Net Fixed Assets as collatera
FUND UTILIZATION SCHEDULE (INR '000)
Total Capital Raised 85,000 90,000 60,000
Capex 31,825 29,917 24,669 86,411
Repayment of Debt 1,200 - - 1,200
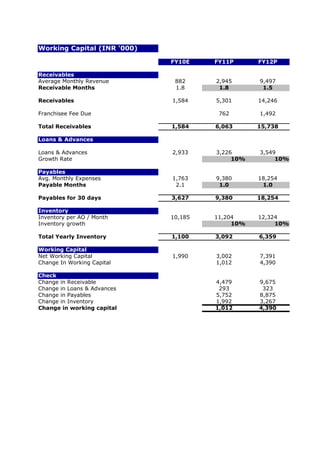
Working Capital 1,012 4,390 15,094 20,496
Opex 50,963 55,694 20,237 126,893](https://image.slidesharecdn.com/businessplansample-091111061657-phpapp02/85/Business-Plan-Sample-8-320.jpg)
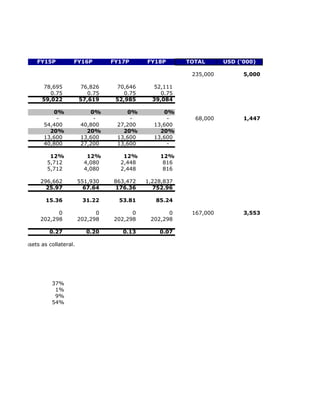

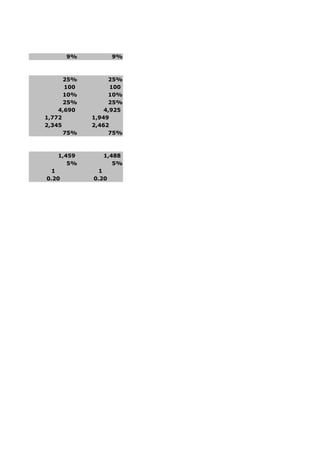
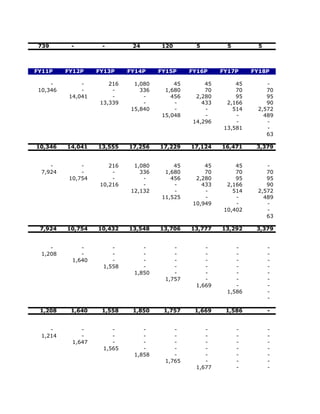
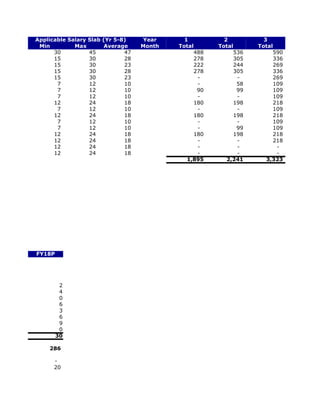
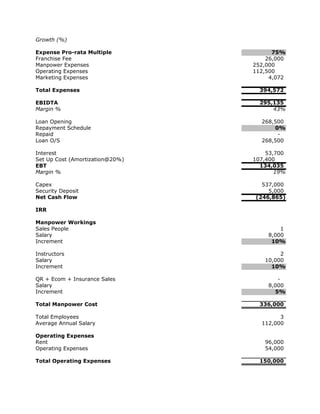
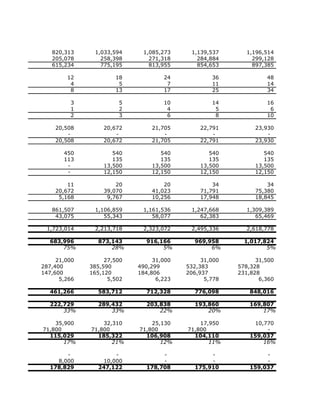
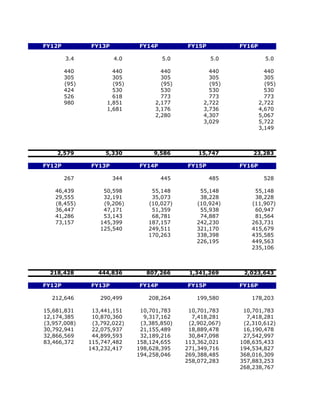
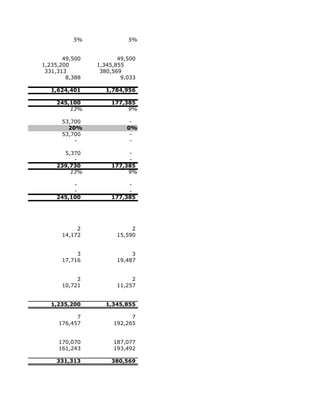
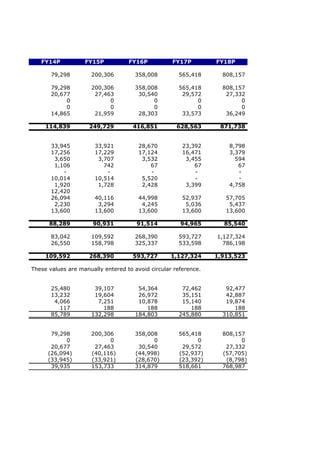
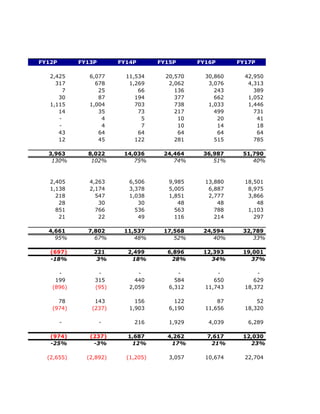
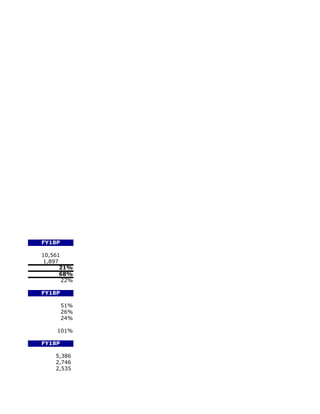
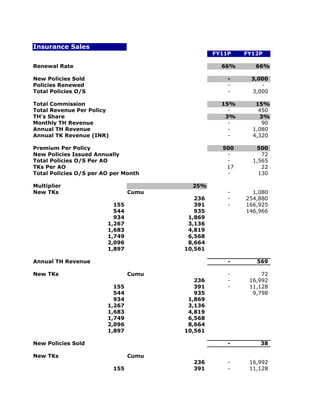
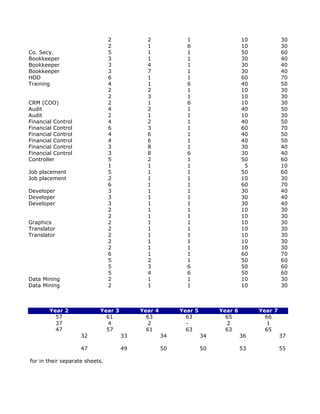
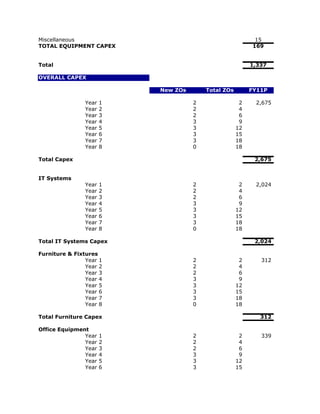
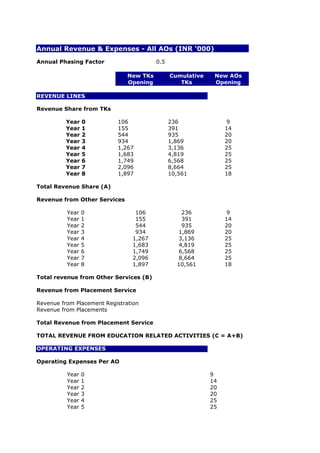
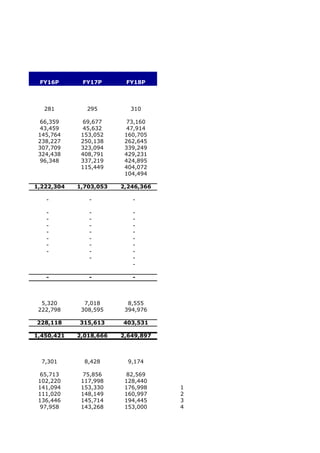
![Profit and Loss Statement (INR '000)
FY08A FY09A FY10E
Revenue
Education Related Services (TKs) 4,815 5,953 10,580
Franchisee Fee (TKs) 2,011 2,318 2,360
E-Commerce - - -
Query Response - - -
TARA Akshar 178 5,990 2,926
Training Institute - - -
Market Research - - -
Advertising - - -
Projects 7,498 2,387 1,274
Insurance Commissions - - -
Total Revenue 14,502 16,648 17,140
Growth Rate % 15% 3%
Expenses
Salaries 12,946 12,818 10,789
Other Operating Expenses 6,047 4,437 9,013
Marketing expenses 280 194
Product Development Expenses [#] - -
TARA Akshar Costs 2,305 1,347
Insurance Commission Costs - - -
Total Expenses 19,273 19,755 21,150
Growth Rate % 3% 7%
EBITDA (4,771) (3,106) (4,010)
Margin % -33% -19% -23%
Other Income 1,075 838 300
Depreciation 207 140 100
EBIT (3,903) (2,409) (3,810)
Interest - - 150
EBT (3,903) (2,409) (3,960)
Tax 162 167 -
Net profit (4,065) (2,576) (3,960)
Margin % -28% -15% -23%
Accumulated Profit/(Loss) (35,073) (37,650) (41,610)
[#] For FY10E, Product Development Expenses are included in Manpower Cost](https://image.slidesharecdn.com/businessplansample-091111061657-phpapp02/85/Business-Plan-Sample-22-320.jpg)
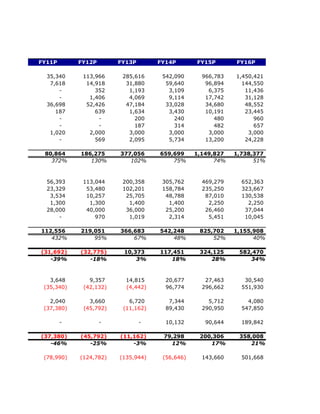
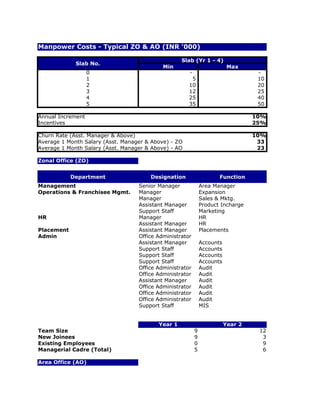
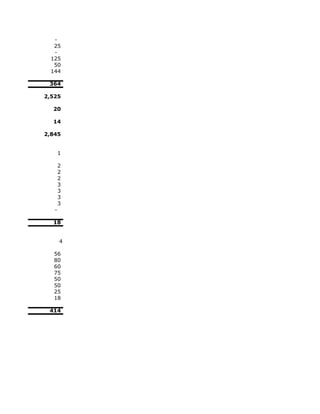
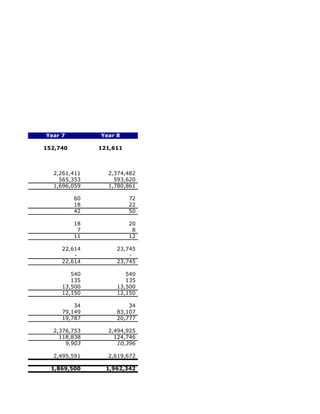
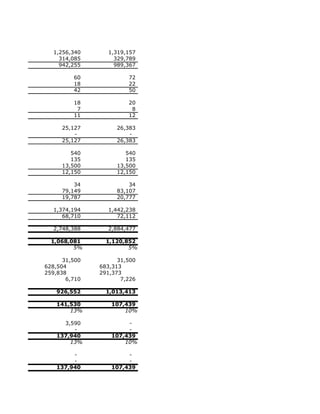
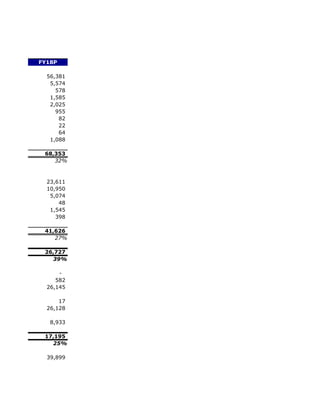
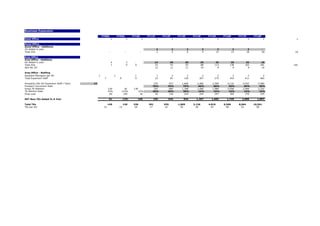
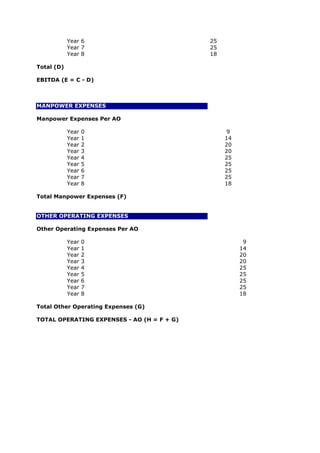
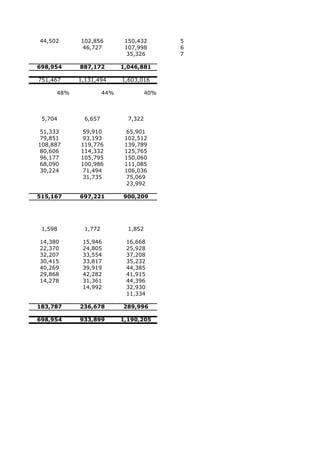
![Profit and Loss Statement (USD '000)
FY09A FY10E FY11P
Revenue
Education Related Services (TKs) 127 225 752
Franchisee Fee (TKs) 49 50 162
E-Commerce - - -
Query Response - - -
TARA Akshar 127 62 781
Training Institute - - 4
Market Research - - -
Advertising - - -
Projects 51 27 22
Insurance Commissions - - -
Total Revenue 354 365 1,721
Growth Rate % 3% 372%
Expenses
Salaries 273 230 1,200
Other Operating Expenses 94 192 496
Marketing expenses 4 - 75
Product Development Expenses [#] - - 28
TARA Akshar Costs 49 29 596
Insurance Commission Costs - - -
Total Expenses 420 450 2,395
Growth Rate % 7% 432%
EBITDA (66) (85) (674)
Margin % -19% -23% -39%
Other Income 18 6 -
Depreciation 3 2 78
EBIT (51) (81) (752)
Interest - 3 43
EBT (51) (84) (795)
Tax 4 - -
Net profit (55) (84) (795)
Margin % -15% -23% -46%
Accumulated Profit/(Loss) (801) (885) (1,681)
[#] For FY10E, Product Development Expenses are included in Manpower Cost](https://image.slidesharecdn.com/businessplansample-091111061657-phpapp02/85/Business-Plan-Sample-30-320.jpg)


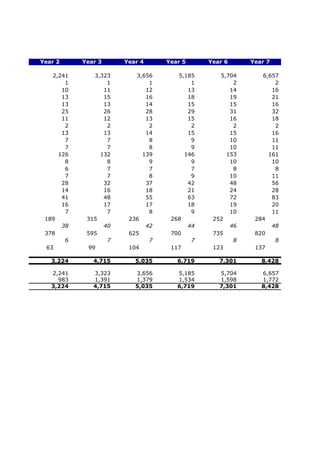
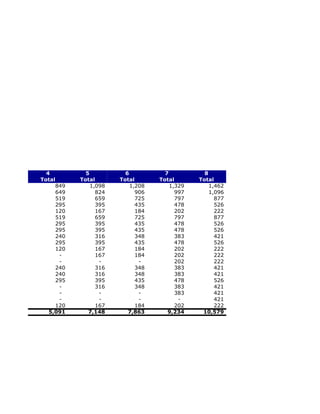
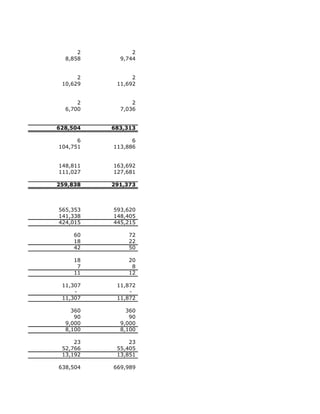
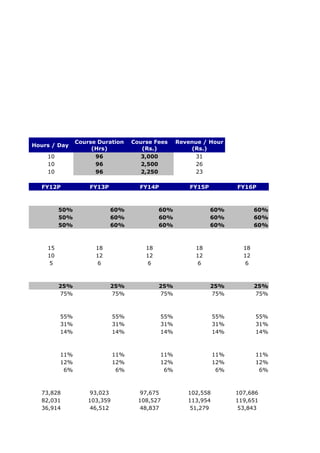
![Training Institute - P&L Statement (INR '000)
Type A 9
Type B 12
Space Per
Total Space
Construction Cost (INR) Units Person Per No of Persons Per Unit Cost
Requirment
Room
Type Total Cost
(Nos.) (Sq. Metre) (Nos.) (Sq. Metres) (Rs./Sq. Metre)
Large Training Hall 1 2 70 140 A 9 1,260
Small Training Hall 1 2 30 60 A 9 540
Resource Center 2 2 20 80 A 9 720
Toilets 30 B 12 360
Office Space 1 8 4 32 A 9 288
Small Meeting Rooms 2 2 20 80 A 9 720
IT Room 1 25 A 9 225
Small Studio 1 50 A 9 450
Library 1 3 20 60 A 9 540
Residence for double rooms 8 70 560 B 12 6,720
Cafeteria + Kitchen 100 B 12 1,200
Service Rooms 50 B 12 600
1,267 13,623
Equipment Cost (INR) Units Cost per unit Amount
Computer Terminals 45 25 1,125
Software 45 25 1,125
UPS 45 6 270
Colour Printer 1 20 20
Black and White Printer 3 10 30
Xerox Machine 1 100 100
Generator 1 700 700
LAN Network Cost Per Terminal 45 12 540
LCD Projector 4 60 240
Video Camera 4 50 200
Still Camera 4 10 40
Switch 1 5 5
Connectors 50 0 1
Hardware Computer Kit 10 15 150
UTP Cable 100 0 2
Total 4,548
Buffer For Cost Overruns 10%
Total Equipment Cost 5,003
Total cost of 1st training institute 21,626 Location: Orcha
Furniture 3,000
Equipment 5,003
Construction 13,623
Infrastructure cost of 2nd training institute 21,626 Location: Pahuj
Furniture 3,000
Equipment 5,003
Construction 13,623
Total Fixed Cost Estimated 43,251
1 2 3 4 5 6 7 8
FY11P FY12P FY13P FY14P FY15P FY16P FY17P FY18P
Capex Schedule 1st institute 40% 40% 20% 0% 0% 0% 0% 0%
Completion 40% 80% 100% 100% 100% 100% 100% 100%
Capex on 1st institute 8,650 9,083 4,768 - - - - -
Capex Schedule 2nd institute 0% 0% 0% 40% 40% 20% 0% 0%
Completion 0% 0% 0% 40% 80% 100% 100% 100%
Capex on 2nd institute - - - 10,014 10,514 5,520 - -
Actual Capex for The Year 8,650 9,083 4,768 10,014 10,516 5,521 1 1
Cumulative Capex 8,650 17,733 22,501 32,516 43,031 48,553 48,554 48,555
Construction Cost 5,449 5,722 3,004 6,308 6,624 3,477 - -
Furniture Cost 1,200 1,260 662 1,389 1,459 766 - -
Equipment Cost 2,001 2,101 1,103 2,316 2,432 1,277 - -
Total Capex 8,650 9,083 4,768 10,014 10,514 5,520 - -
Total number of working days in a year 300 300 300 300 300 300 300 300
Average Batch Size 20 20 20 20 20 20 20 20
Average Training Session Duration 3 3 3 3 3 3 3 3
Total Student Capacity Per Day 28 56 70 98 126 140 140 140
Actual Batches Per Day 1.00 1.25 1.50 2.00 2.50 3.50 4.50 5.50
Functional Capacity 2,113 2,642 3,170 4,227 5,284 7,397 9,510 11,624
FRANCHISEE TRAINING
Total TKs 391 935 1,869 3,136 4,819 6,568 8,664 10,561
No of New TKs (Gross) 193 680 1,168 1,490 1,980 2,058 2,466 2,232
% of new franchisees coming for Induction Training 0% 50% 50% 70% 70% 70% 70% 70%
Number of New Franchisees Coming for Induction Training - 340 584 1,043 1,386 1,441 1,726 1,562
Number of Days of Induction Training 4 4 4 4 4 4 4 4
Class Size 25 25 25 25 25 25 25 25
Number of New Franchisees Paying for Induction Training - - 1,168 1,490 1,980 2,058 2,466 2,232
Fees of Induction training (INR) [#] 2,500 2,500 3,000 3,000 3,000 3,500 3,500 3,500
Total fees of Induction Training (INR '000) - - 3,503 4,471 5,940 7,203 8,631 7,812
Number of Days - 54 93 167 222 230 276 250
[#] Induction Training Cost is incuded in Franchisee Fee from FY13
% of franchisees coming for Additional Training 3% 5% 10% 20% 25% 25%
No of franchisees coming for Additional Training 28 93 314 964 1,642 2,166
Number of Days of Additional Training 2 2 2 2 2 2 2 2
Class Size 25 25 25 25 25 25 25 25
Fees of Additional training (INR) 4,250 4,463 4,686 4,920 5,166 5,424
Total fees of Additional Training (INR '000) - - 119 417 1,451 4,681 8,374 11,599
Number of Days - - 2 7 25 77 131 173
Total Fees of Franchisee Trainings - - 3,622 4,888 7,391 11,884 17,005 19,411
INSTRUCTOR TRAINING
Avg No of Instructors per franchise 1.2 1.8 1.8 1.8 1.8 1.8 1.8 1.8
Total No of Instructors 469 1,683 3,364 5,644 8,674 11,823 15,596 19,011
% of Instructors coming for Basic Courses 0% 3% 5% 5% 10% 15% 15% 15%
Number of Instructors coming for Basic Courses - 50 168 282 867 1,773 2,339 2,852
Average Number of Days of Basic Courses 3 3 3 3 3 3 3 3
Class Size 20 20 20 20 20 20 20 20
Fees Per Person of Basic Courses (INR) 5,075 5,329 5,595 5,875 6,169 6,477 6,801 7,141
Total fees of trainings for Basic Courses - 269 941 1,658 5,351 11,486 15,910 20,363
Number of Days - 7 23 39 119 244 322 392
% of Instructors coming for Advanced Courses 0% 1.5% 2.5% 5% 10% 15% 15% 15%
Number of Instructors coming for Advanced Courses - 25 84 282 867 1,773 2,339 2,852
Average Number of Days of Advanced Courses 2 2 2 2 2 2 2 2
Class Size 20 20 20 20 20 20 20 20
Fees Per Person of Advanced Courses (INR) 3,215 3,376 3,545 3,722 3,908 4,104 4,309 4,524
Total fees of trainings for Advanced Courses - 85 298 1,050 3,390 7,278 10,080 12,902
Number of Days - 3 8 28 87 177 234 285
Total fees of Instructor Trainings - 354 1,239 2,709 8,741 18,764 25,990 33,265
INTERNAL STAFF TRAINING
Internal Staff Trained - Induction 150 249 302 381 410 445 463 396
Number of Days of First Training 4 4 4 4 4 4 4 4
Class Size 14 14 14 14 14 14 14 14
Number of Days 43 71 86 109 117 127 132 113
Internal Staff Trained - Refresher 77 186 342 396 475 480 409 502
Total Staff 110 266 488 791 1,187 1,599 2,046 2,512 2,913
% of Total Staff Trained - Refresher 70% 70% 70% 50% 40% 30% 20% 20%
Number of Days of Refresher Training 2 2 2 2 2 2 2 2
Class Size 14 14 14 14 14 14 14 14
Number of Days 11 27 49 57 68 69 58 72
Total No of People Coming For Training 227 851 1,508 2,478 4,319 6,876 8,919 10,330
Spare Capacity 89% 68% 52% 41% 18% 7% 6% 11%
No of unutilized days 107 163 157 174 99 42 37 67
Total revenue earned from training - 354 4,861 7,597 16,131 30,648 42,995 52,676
Total Rent 50% 187 285 275 304 - - - -
Rent per day earned (INR '000) 3.50
Total Revenue Earned (Including Induction Training Fee) 187 639 5,137 7,901 16,131 30,648 42,995 52,676
Total Revenue Earned (Excluding Induction Training Fee) 187 639 1,634 3,430 10,191 23,445 34,364 44,864
Year 1 Year 2 Year 3 Year 4 Year 5 Year 6 Year 7 Year 8
Total Operating Cost 1,020 2,655 4,899 9,425 17,834 31,349 43,213 53,081
Maintenance as a percentage of total cost 5% - 433 887 1,125 1,626 2,152 2,428 2,428
Training camp in Punjab 30 180 180 180 180 180 180 180 180
Total Salary Cost 624 686 889 2,252 2,477 2,725 2,997 3,297
Induction Training Instructors - - 11 49 54 60 66 72
Salary per month 19 20 22 25 27 30 33 36
No of Instructors - - 1 2 2 2 2 2
Technical Support 10 11 12 27 29 32 35 39
Salary per month 10 11 12 13 15 16 18 19
No of tech support staff 1 1 1 2 2 2 2 2
Reception & Adm Officer 8 9 10 21 23 26 28 31
Salary per month 8 9 10 11 12 13 14 16
No of receptionist 1 1 1 2 2 2 2 2
Accounts Officer 12 13 15 32 35 39 43 47
Salary per month 12 13 15 16 18 19 21 23
No of accounts officers 1 1 1 2 2 2 2 2
Training Coordinators 12 13 15 32 35 39 43 47
Salary per month 12 13 15 16 18 19 21 23
No of coordinators 1 1 1 2 2 2 2 2
Office Boys 10 11 12 27 29 32 35 39
Number of Office Boys 2 2 2 4 4 4 4 4
Salary per month 5 6 6 7 7 8 9 10
Increase in salaries 10%
Cost of Induction Training Per Head (INR) 2,287 2,401 2,521 2,647 2,780 2,919 3,065 3,218
Total Cost of Induction Training - 817 1,472 2,762 3,853 4,205 5,290 5,028
Cost of Additional Training Per Head (INR) 3,625 3,806 3,996 4,196 4,406 4,626 4,857 5,100
Total Cost of Additional Training - - 112 392 1,382 4,458 7,976 11,047
Cost of Basic Course Per Instructor Trained (INR) 4,771 5,009 5,260 5,523 5,799 6,089 6,394 6,713
Total Cost of Basic Courses (Instructor) - 253 885 1,559 5,030 10,798 14,957 19,143
Cost of Advanced Courses Per Instructor Trained (INR) 2,936 3,083 3,237 3,399 3,569 3,748 3,935 4,132
Total Cost of Advanced Courses (Instructor) - 78 272 959 3,096 6,646 9,205 11,782
Broadband Line 180 171 162 154 147 139 132 126
Broadband Per Month 15.0 14.3 13.5 12.9 12.2 11.6 11.0 10.5
Communication Expenses 36 38 40 42 44 46 48 51
Communication Per Month 3.0 3.2 3.3 3.5 3.6 3.8 4.0 4.2](https://image.slidesharecdn.com/businessplansample-091111061657-phpapp02/85/Business-Plan-Sample-65-320.jpg)


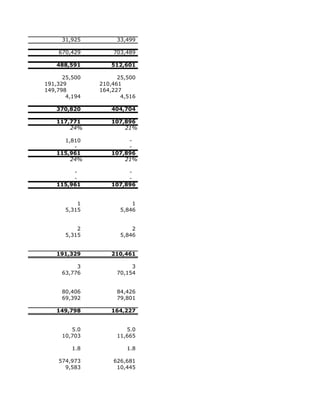
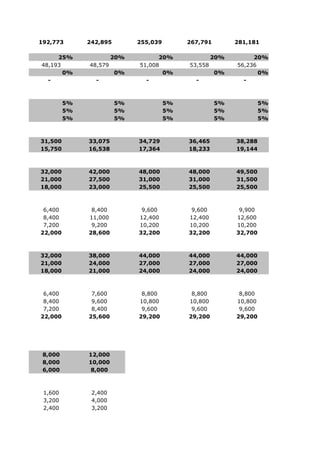
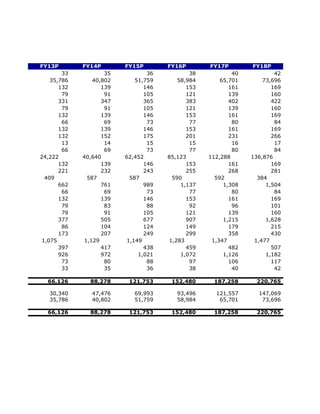
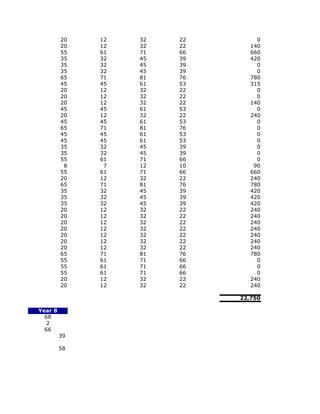
![Annual Expenses - HO (INR '000)
PARTICULARS
Growth (%) [#] FY11P FY12P
Bank Charges 30 32
Manpower Costs 22,750 30,847
Consumables 120 126
Courier/ Speed Post 15% 60 69
Electricity Exp. 300 315
Freight & Cartage 15% 60 69
Generator Operations 120 126
Generator Expenses 60 63
Insurance Expense 120 126
Legal Charges 15% 100 115
Newspaper & Magazine 12 13
Office supply (Tea, Coffee, Water etc.) 60 63
Printing Expenses 2,531 10,097
Professional Charges 120 126
Public Relations 200 210
Recruitment Expenses [*] 222 299
Rent 600 630
Repair & Maintenance 60 63
Stationary 120 126
Stipend 72 76
Sundry Expenses 15% 60 69
Telephone/ Fax/ Email Local 210 281
STD/ ISD 20% 60 72
Mobile 20% 120 144
Training Expenses 1,005 1,906
Travel Local 360 378
Travel National 840 882
Office Support Wages 10% 60 66
Xeroxing 30 32
Total Operating Expenses 30,462 47,419
Other expenses 7,712 16,572
Personnel expense 22,750 30,847
Total expense 30,462 47,419
[#] For items with no growth rate, inflation rate is assumed as growth rate
[*] Includes a 10% buffer over actual calculated costs for unforeseen circumstances
[1] Includes cost for outsourcing email, internet connection & video conferencing](https://image.slidesharecdn.com/businessplansample-091111061657-phpapp02/85/Business-Plan-Sample-84-320.jpg)
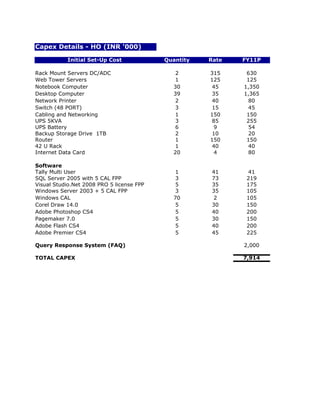
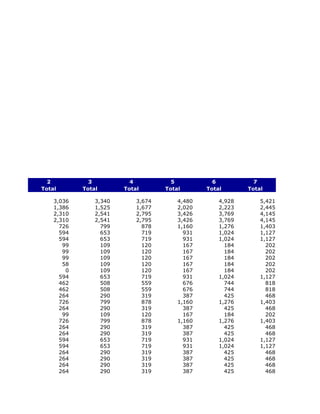
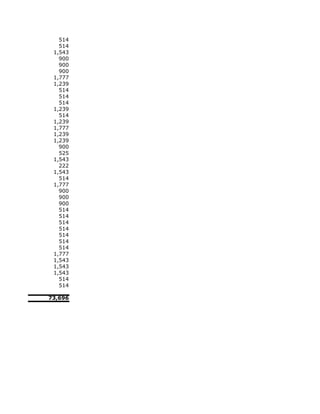


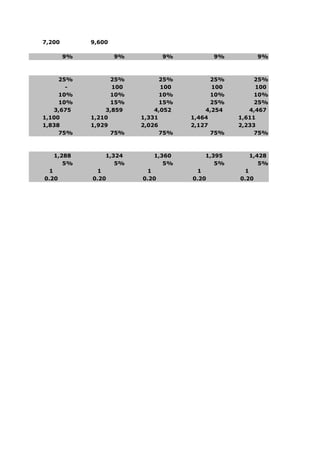
![Annual Expenses - Typical ZO (INR '000)
PARTICULARS Growth (%) [#] Year 1
Consultancy Fee 2,707
Bank Charges 1
Consumables 10% 12
Courier/ Speed post 10% 12
Electricity Exp. 18
Freight & Cartage 10% 4
Generator expenses 12
Legal charges 10% 10
Newspaper & magazine 2
Office supply (Tea, Coffee, Mineral Water etc.) 9
Photographs/ Slides/ Display 10% 2
Printing Expenses 10% 6
Rent 180
Repair & Maintenance -
Stationary 9
Sundry Expenses 10% 9
Telephone/ Fax/ Email 15% 24
STD/ ISD 15% 24
Mobile 15% 24
Wages 18
Xeroxing 10% 12
Training Expenses 270
Local Travel Per Team Member 15
Travel Local 135
National Travel Per Team Member 12
Travel National 108
Total Operating Expenses 3,608
Other expenses 901
Personnel 2,707
Total Operating Expenses 3,608
[#] Inflation rate is used as rate of growth where growth rate is not explicitly mentioned](https://image.slidesharecdn.com/businessplansample-091111061657-phpapp02/85/Business-Plan-Sample-102-320.jpg)

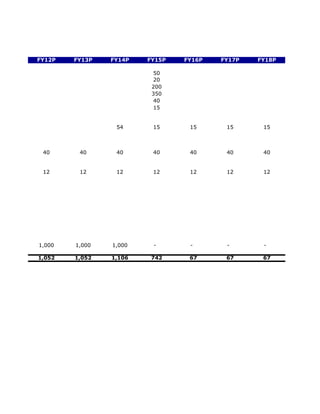
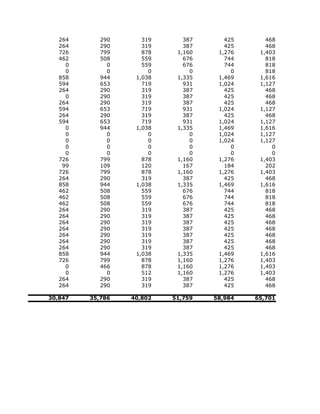
![Annual Expenses - Typical AO (INR '000)
Growth (%) [#] Year 1
Manpower Expenses 1,895
Bank Charges 1
Consumables 10% 9
Courier/ Speed post 10% 12
Electricity Exp. 12
Generator expenses 24
Legal charges 10% 10
Newspaper & magazine 2
Office supply (Tea, Coffee, Mineral Water etc.) 12
Photographs/ Slides/ Display 10% 6
Printing Expenses 10% 6
Rent 120
Repair & Maintenance (Computer equipments) -
Stationary 6
Sundry Expenses 10% 6
Telephone/ Fax/ Email 15% 24
STD/ ISD 15% 12
Mobile 15% 36
Wages 15
Xeroxing 10% 6
Training Expenses 240
Local Travel Per Team Member 36
Travel Local 288
National Travel Per Team Member 6
Travel National 48
Total Operating Expenses 2,790
Manpower Expenses 1,895
Other Expenses 895
Total Expenses 2,790](https://image.slidesharecdn.com/businessplansample-091111061657-phpapp02/85/Business-Plan-Sample-117-320.jpg)