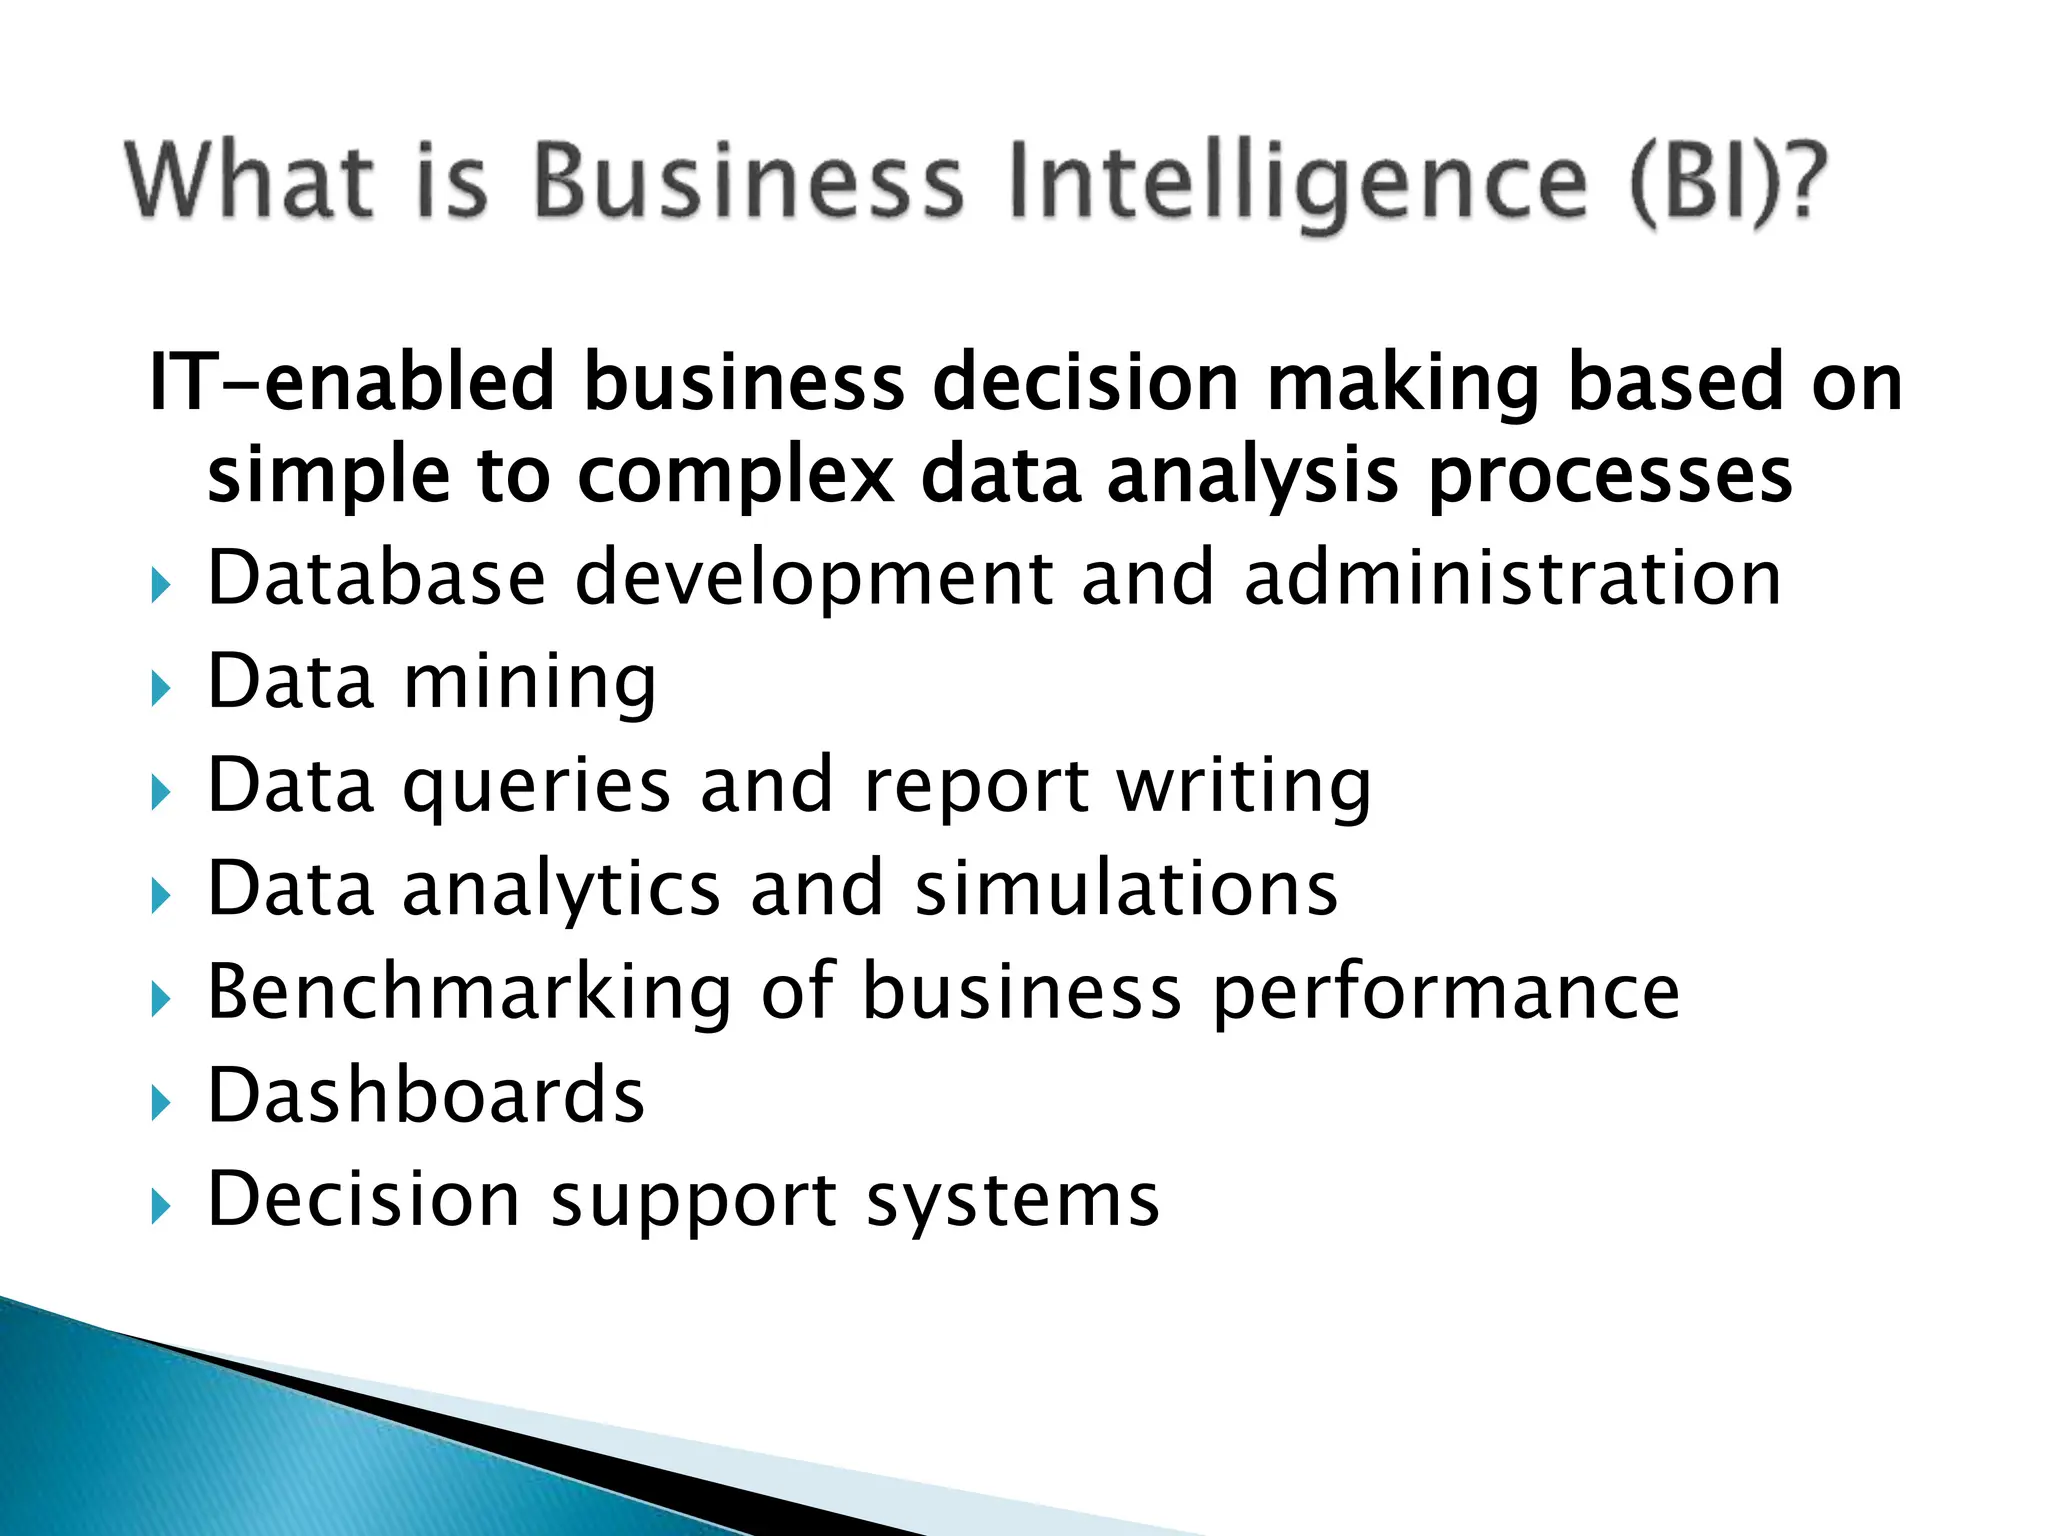
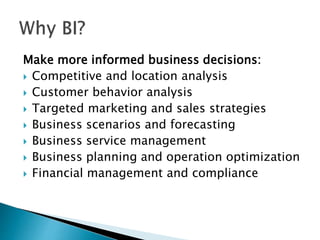
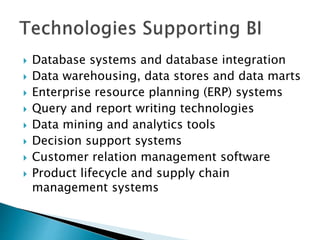
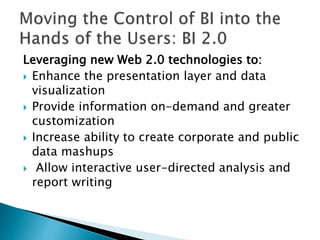
IT-enabled business decision making based on
simple to complex data analysis processes
 Database development and administration
 Data mining
 Data queries and report writing
 Data analytics and simulations
 Benchmarking of business performance
 Dashboards
 Decision support systems
Make more informed business decisions:
 Competitive and location analysis
 Customer behavior analysis
 Targeted marketing and sales strategies
 Business scenarios and forecasting
 Business service management
 Business planning and operation optimization
 Financial management and compliance
 Through 2012, more than 35 % of the top 5,000 global companies will
regularly fail to make insightful decisions about significant changes in
their business and markets
 By 2012, business units will control at least 40% of the total budget for
BI
 By 2010, 20% of organizations will have an industry-specific analytic
application delivered via software as a service (SaaS) as a standard
component of their BI portfolio
 In 2009, collaborative decision making will emerge as a new product
category that combines social software with BI Platform capabilities
 By 2012, one-third of analytic applications applied to business
processes will be delivered through coarse-grained application mashups
 Database systems and database integration
 Data warehousing, data stores and data marts
 Enterprise resource planning (ERP) systems
 Query and report writing technologies
 Data mining and analytics tools
 Decision support systems
 Customer relation management software
 Product lifecycle and supply chain
management systems
Leveraging new Web 2.0 technologies to:
 Enhance the presentation layer and data
visualization
 Provide information on-demand and greater
customization
 Increase ability to create corporate and public
data mashups
 Allow interactive user-directed analysis and
report writing
BI careers cross over all industries:
 BI solution architects and integration
specialists
 Business and BI analysts
 BI application developers and testers
 Data warehouse specialists
 Database analysts, developers and testers
 Database support specialists
 Database theory and practice
 Data mining and relational report writing
 Enterprise data and information flow
 Information management and regulatory
compliance
 Analytical processing and decision making
 Data presentation and visualization
 BI technologies and systems
 Value chain and customer service management
 Business process analysis and design
 Transaction processing systems
 Management information systems
 Knowledge of database systems and data
warehousing technologies
 Ability to manage database system
integration, implementation and testing
 Ability to manage relational databases and
create complex reports
 Knowledge and ability to implement data and
information policies, security requirements,
and state and federal regulations
 Understanding of the flow of information
throughout the organization
 Ability to effectively communicate with and get
support from technology and business specialists
 Ability to understand the use of data and
information in each organizational units
 Ability to present data in a user-centric
framework
 Ability to understand the decision making
process and to focus on business objectives
 Ability to train business users in information
management and interpretation
For rapid analysis and display of large amounts
of data:
 On-Line Analytical Processing (OLAP)
 Multidimensional/ hyper cubes
 OLAP operations: Slice, Dice, Drill Down/Up,
Roll-up, Pivot
 OLAP vendors and products
 Basics of data warehousing design and
management
 Data warehouse architectures
 Data marts and data stores
 Data structures and data flow
 Dimensional modeling
 Extract, clean, conform and deliver
 Server management tools to package, backup
and restore
 Database server activity monitoring and
performance optimization
Data mining: the extraction of predictive
information from large databases.
 Data trend, connection and behavior pattern
analysis
 Data quality
 Data mining tools
 Predictive and business analytics
 Descriptive and decision models
 Statistical techniques and algorithms
 Data representations
 Information graphics
 Data representation techniques and tools
 Visual representation – trends and best
practices
 Interactivity in data representation
 Tools and applications
 The user perspective on information
presentation
 Capturing and documenting the business
requirements for BI solution
 Translating business requirements into technical
requirements
 BI project lifecycle and management
 Key Performance Indicators (KPIs), actions, and
stored procedures
 User education and training
 Data-based decision making
 Effective communication and consultation with
business users
 Business Intelligence (BI) Specialist works with
business users to obtain data requirements for
new analytic applications, design conceptual and
logical models for the data warehouse and/or
data mart and communicate physical designs to
the database group. The BI specialist also
develops processes for capturing and
maintaining metadata from all data warehousing
components.
 Business Intelligence Developer is responsible for designing and
developing Business Intelligence solutions for the enterprise. The
Developer works on-site at the corporate head quarters. Key
functions include designing, developing, testing, debugging, and
documenting extract, transform, load (ETL) data processes and
data analysis reporting for enterprise-wide data warehouse
implementations. Responsibilities include: working closely with
business and technical teams to understand, document, design
and code ETL processes; working closely with business teams to
understand, document and design and code data analysis and
reporting needs; translating source mapping documents and
reporting requirements into dimensional data models; designing,
developing, testing, optimizing and deploying server integration
packages and stored procedures to perform all ETL related
functions; develop data cubes, reports, data extracts,
dashboards or scorecards based on business requirements.
 The Business Intelligence Report Developer is responsible
for developing, deploying and supporting reports, report
applications, data warehouses and business intelligence
systems. Primary responsibilities include creating and
automating quality control processes and methods,
providing maintenance and enhancement of data
warehouse reports, creating ad hoc data warehouse
queries, solving data related reporting issues and
documenting all reports created. The report developer
must have experience in user facing roles (e.g. gathering
requirements, establishing project objectives, leading
meetings) and in developing, selecting and conducting
user training as needed. The Developer also participates in
all aspects of data warehouse projects including
conceptualization, design, construction, testing, selection,
deployment and post-support implementation.
 Data mining is the process of extracting hidden patterns from data. As more data is gathered,
with the amount of data doubling every three years data mining is becoming an increasingly
important tool to transform this data into information. It is commonly used in a wide range of
profiling practices, such as marketing, surveillance, fraud detection and scientific discovery.
 Dashboards: Typically, information is presented to the manager via a graphics display called a
Dashboard. A BIS (Business Intelligence System) Dashboard serves the same function as a car’s
dashboard. Specifically, it reports key organizational performance data and options on a near
real time and integrated basis. Dashboard based business intelligence systems do provide
managers with access to powerful analytical systems and tools in a user friendly environment.
 Enterprise resource planning (ERP) is a company-wide computer software system used to
manage and coordinate all the resources, information, and functions of a business from shared
data stores.
 Online analytical processing, or OLAP is an approach to quickly answer multi-dimensional
analytical queries. OLAP is part of the broader category of business intelligence, which also
encompasses relational reporting and data mining. The typical applications of OLAP are in
business reporting for sales, marketing, management reporting, business process management
(BPM), budgeting and forecasting, financial reporting and similar areas. The term OLAP was
created as a slight modification of the traditional database term OLTP (Online Transaction
Processing)
 Multidimensional/ hyper cubes: A group of data cells arranged by the dimensions of the data.
For example, a spreadsheet exemplifies a two-dimensional array with the data cells arranged in
rows and columns, each being a dimension. A three-dimensional array can be visualized as a
cube with each dimension forming a side of the cube, including any slice parallel with that side.
Higher dimensional arrays have no physical metaphor, but they organize the data in the way
users think of their enterprise. Typical enterprise dimensions are time, measures, products,
geographical regions, sales channels, etc. Synonyms: Multi-dimensional Structure, Cube,
Hypercube
 OLAP operations: Slice, Dice, Drill Down/Up, Roll-up, Pivot

businessIntelligence p.ppt

  • 1.
    IT-enabled business decisionmaking based on simple to complex data analysis processes  Database development and administration  Data mining  Data queries and report writing  Data analytics and simulations  Benchmarking of business performance  Dashboards  Decision support systems
  • 2.
    Make more informedbusiness decisions:  Competitive and location analysis  Customer behavior analysis  Targeted marketing and sales strategies  Business scenarios and forecasting  Business service management  Business planning and operation optimization  Financial management and compliance
  • 3.
     Through 2012,more than 35 % of the top 5,000 global companies will regularly fail to make insightful decisions about significant changes in their business and markets  By 2012, business units will control at least 40% of the total budget for BI  By 2010, 20% of organizations will have an industry-specific analytic application delivered via software as a service (SaaS) as a standard component of their BI portfolio  In 2009, collaborative decision making will emerge as a new product category that combines social software with BI Platform capabilities  By 2012, one-third of analytic applications applied to business processes will be delivered through coarse-grained application mashups
  • 4.
     Database systemsand database integration  Data warehousing, data stores and data marts  Enterprise resource planning (ERP) systems  Query and report writing technologies  Data mining and analytics tools  Decision support systems  Customer relation management software  Product lifecycle and supply chain management systems
  • 5.
    Leveraging new Web2.0 technologies to:  Enhance the presentation layer and data visualization  Provide information on-demand and greater customization  Increase ability to create corporate and public data mashups  Allow interactive user-directed analysis and report writing
  • 6.
    BI careers crossover all industries:  BI solution architects and integration specialists  Business and BI analysts  BI application developers and testers  Data warehouse specialists  Database analysts, developers and testers  Database support specialists
  • 7.
     Database theoryand practice  Data mining and relational report writing  Enterprise data and information flow  Information management and regulatory compliance  Analytical processing and decision making  Data presentation and visualization  BI technologies and systems  Value chain and customer service management  Business process analysis and design  Transaction processing systems  Management information systems
  • 8.
     Knowledge ofdatabase systems and data warehousing technologies  Ability to manage database system integration, implementation and testing  Ability to manage relational databases and create complex reports  Knowledge and ability to implement data and information policies, security requirements, and state and federal regulations
  • 9.
     Understanding ofthe flow of information throughout the organization  Ability to effectively communicate with and get support from technology and business specialists  Ability to understand the use of data and information in each organizational units  Ability to present data in a user-centric framework  Ability to understand the decision making process and to focus on business objectives  Ability to train business users in information management and interpretation
  • 10.
    For rapid analysisand display of large amounts of data:  On-Line Analytical Processing (OLAP)  Multidimensional/ hyper cubes  OLAP operations: Slice, Dice, Drill Down/Up, Roll-up, Pivot  OLAP vendors and products
  • 11.
     Basics ofdata warehousing design and management  Data warehouse architectures  Data marts and data stores  Data structures and data flow  Dimensional modeling  Extract, clean, conform and deliver  Server management tools to package, backup and restore  Database server activity monitoring and performance optimization
  • 12.
    Data mining: theextraction of predictive information from large databases.  Data trend, connection and behavior pattern analysis  Data quality  Data mining tools  Predictive and business analytics  Descriptive and decision models  Statistical techniques and algorithms
  • 13.
     Data representations Information graphics  Data representation techniques and tools  Visual representation – trends and best practices  Interactivity in data representation  Tools and applications  The user perspective on information presentation
  • 14.
     Capturing anddocumenting the business requirements for BI solution  Translating business requirements into technical requirements  BI project lifecycle and management  Key Performance Indicators (KPIs), actions, and stored procedures  User education and training  Data-based decision making  Effective communication and consultation with business users
  • 15.
     Business Intelligence(BI) Specialist works with business users to obtain data requirements for new analytic applications, design conceptual and logical models for the data warehouse and/or data mart and communicate physical designs to the database group. The BI specialist also develops processes for capturing and maintaining metadata from all data warehousing components.
  • 16.
     Business IntelligenceDeveloper is responsible for designing and developing Business Intelligence solutions for the enterprise. The Developer works on-site at the corporate head quarters. Key functions include designing, developing, testing, debugging, and documenting extract, transform, load (ETL) data processes and data analysis reporting for enterprise-wide data warehouse implementations. Responsibilities include: working closely with business and technical teams to understand, document, design and code ETL processes; working closely with business teams to understand, document and design and code data analysis and reporting needs; translating source mapping documents and reporting requirements into dimensional data models; designing, developing, testing, optimizing and deploying server integration packages and stored procedures to perform all ETL related functions; develop data cubes, reports, data extracts, dashboards or scorecards based on business requirements.
  • 17.
     The BusinessIntelligence Report Developer is responsible for developing, deploying and supporting reports, report applications, data warehouses and business intelligence systems. Primary responsibilities include creating and automating quality control processes and methods, providing maintenance and enhancement of data warehouse reports, creating ad hoc data warehouse queries, solving data related reporting issues and documenting all reports created. The report developer must have experience in user facing roles (e.g. gathering requirements, establishing project objectives, leading meetings) and in developing, selecting and conducting user training as needed. The Developer also participates in all aspects of data warehouse projects including conceptualization, design, construction, testing, selection, deployment and post-support implementation.
  • 18.
     Data miningis the process of extracting hidden patterns from data. As more data is gathered, with the amount of data doubling every three years data mining is becoming an increasingly important tool to transform this data into information. It is commonly used in a wide range of profiling practices, such as marketing, surveillance, fraud detection and scientific discovery.  Dashboards: Typically, information is presented to the manager via a graphics display called a Dashboard. A BIS (Business Intelligence System) Dashboard serves the same function as a car’s dashboard. Specifically, it reports key organizational performance data and options on a near real time and integrated basis. Dashboard based business intelligence systems do provide managers with access to powerful analytical systems and tools in a user friendly environment.  Enterprise resource planning (ERP) is a company-wide computer software system used to manage and coordinate all the resources, information, and functions of a business from shared data stores.  Online analytical processing, or OLAP is an approach to quickly answer multi-dimensional analytical queries. OLAP is part of the broader category of business intelligence, which also encompasses relational reporting and data mining. The typical applications of OLAP are in business reporting for sales, marketing, management reporting, business process management (BPM), budgeting and forecasting, financial reporting and similar areas. The term OLAP was created as a slight modification of the traditional database term OLTP (Online Transaction Processing)  Multidimensional/ hyper cubes: A group of data cells arranged by the dimensions of the data. For example, a spreadsheet exemplifies a two-dimensional array with the data cells arranged in rows and columns, each being a dimension. A three-dimensional array can be visualized as a cube with each dimension forming a side of the cube, including any slice parallel with that side. Higher dimensional arrays have no physical metaphor, but they organize the data in the way users think of their enterprise. Typical enterprise dimensions are time, measures, products, geographical regions, sales channels, etc. Synonyms: Multi-dimensional Structure, Cube, Hypercube  OLAP operations: Slice, Dice, Drill Down/Up, Roll-up, Pivot