Downloaded 17 times


![ARCTIC CENOZOIC ZONATION
SUMMARY
[1] fluorescence microscopy provides a high-resolution zonal scheme
by helping us to see the in situ palynomorphs
[2] the cooling steps provide a chronostratigraphic framework tied to the south
[3] the scheme can be applied to the entire Arctic region because the Arctic
was centered on the North Pole through the Cenozoic](https://image.slidesharecdn.com/bujakarcticcenozoictalk-140523103544-phpapp01/75/Bujak-Arctic-Cenozoic-talk-68-2048.jpg)

![BUJAK’S ARCTIC CENOZOIC
PALYNOLOGICAL ZONATION
[1] has good resolution
though most of the section
[2] avoids local biofacies
[3] can be tied to
lower-latitudes and
hence absolute time](https://image.slidesharecdn.com/bujakarcticcenozoictalk-140523103544-phpapp01/75/Bujak-Arctic-Cenozoic-talk-70-2048.jpg)


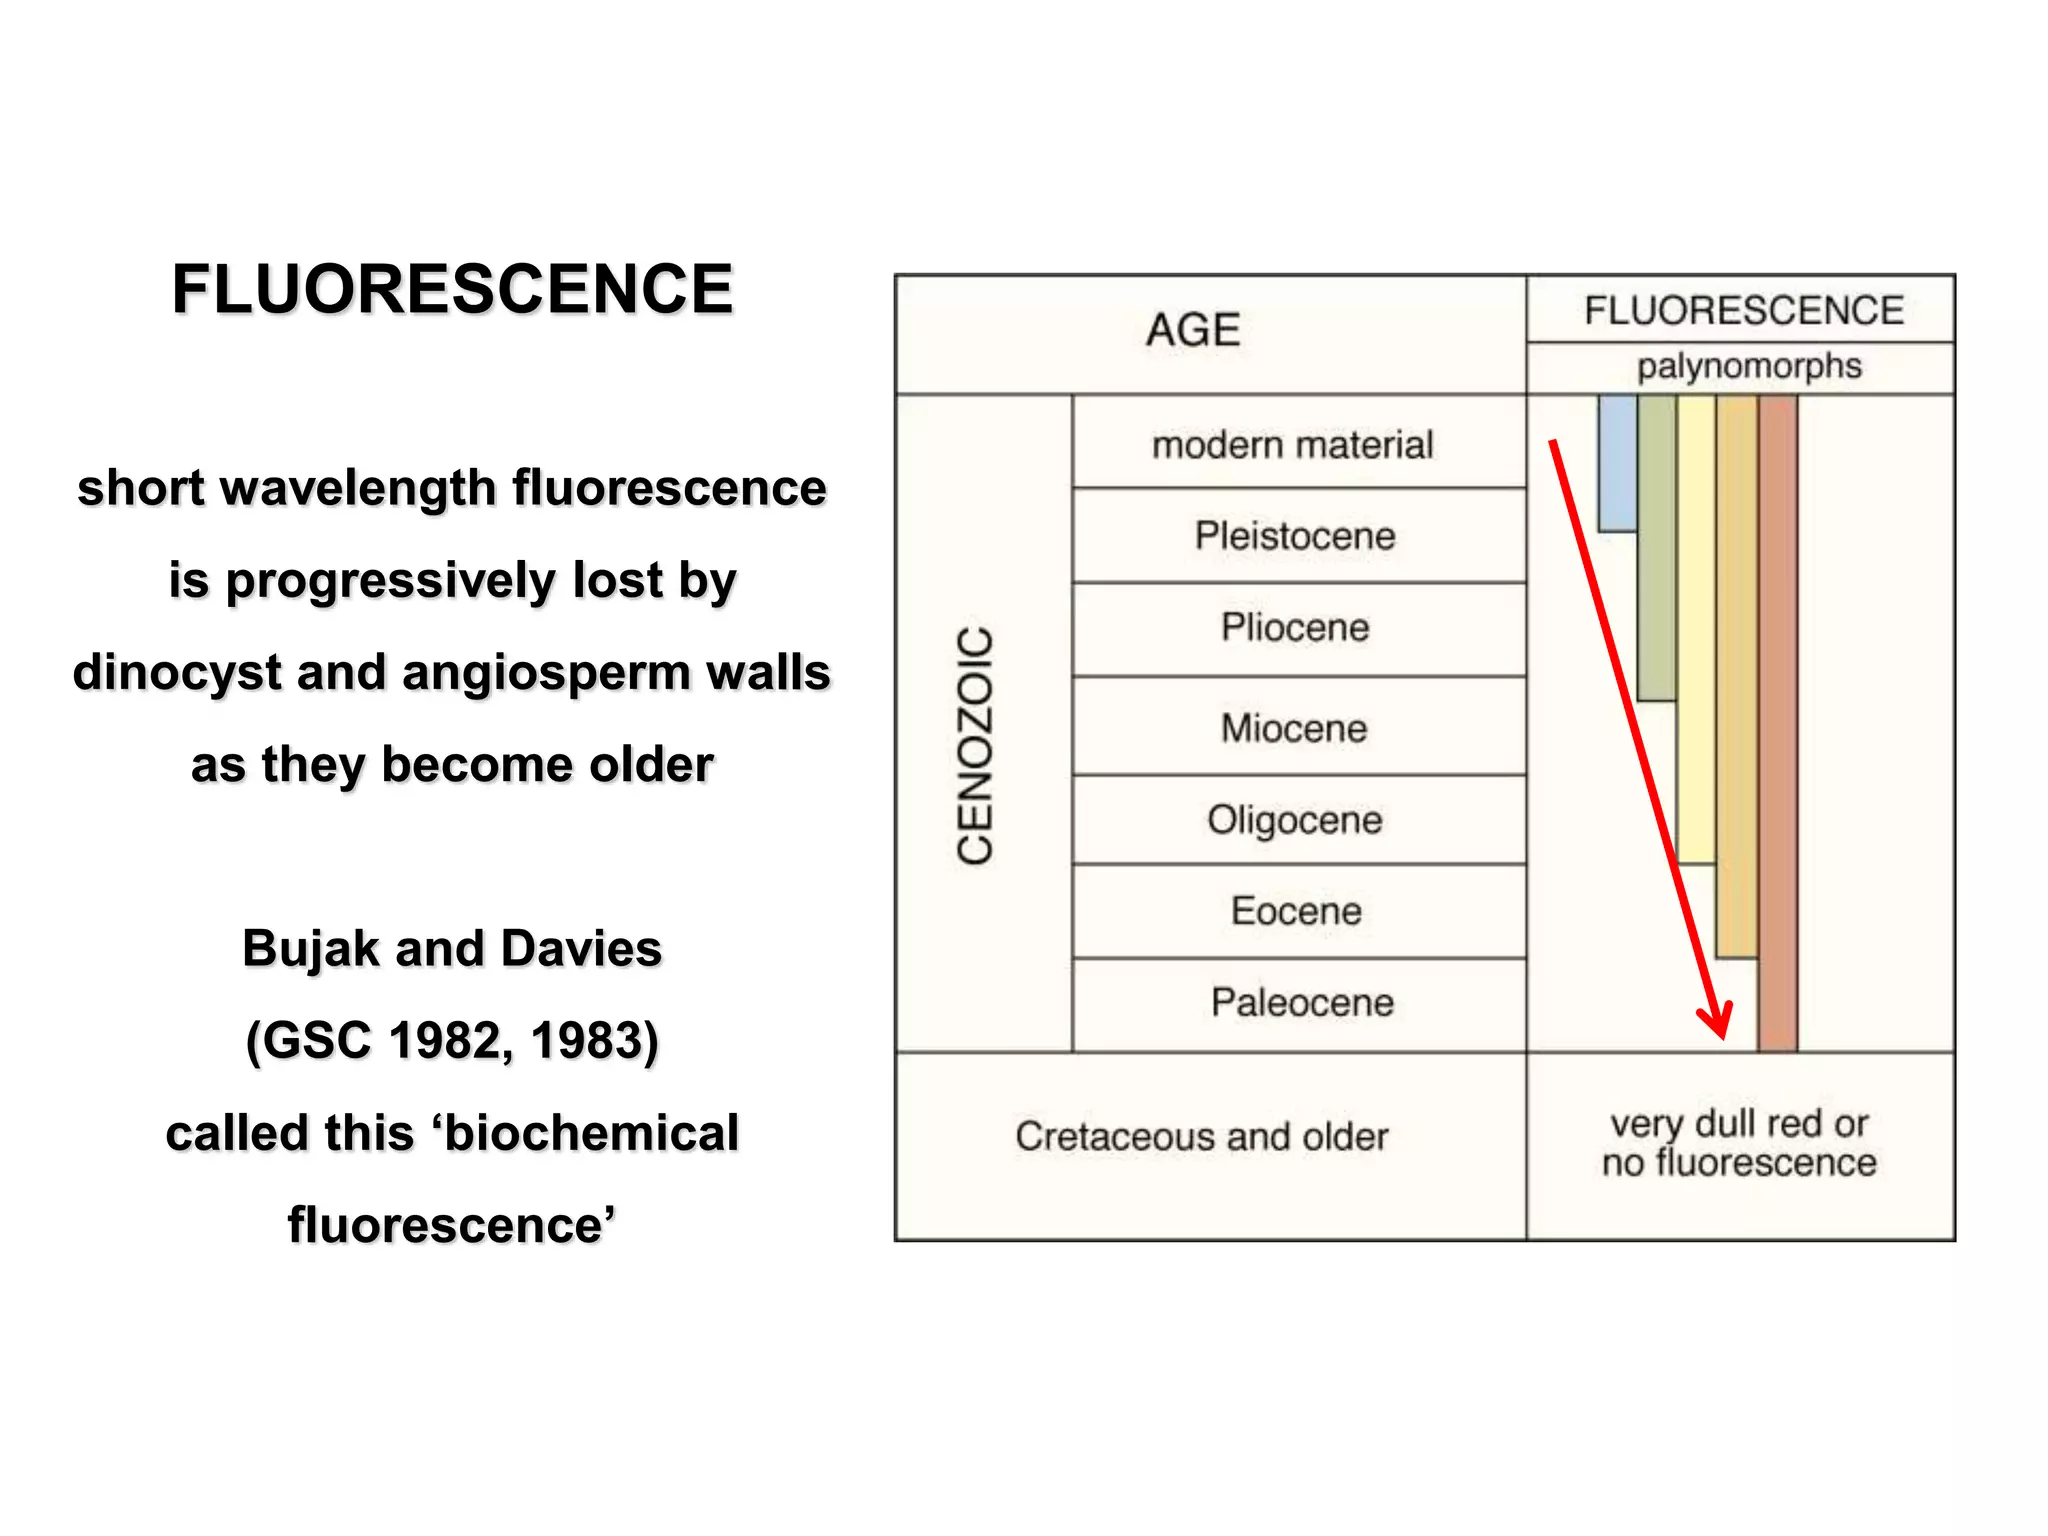
Dr. Jonathan Bujak's talk presents an overview of Arctic Cenozoic biostratigraphy, focusing on changes in climate and oceanography from the Mesozoic to the present. It addresses key challenges in creating a reliable Arctic-wide biostratigraphic scheme due to significant Cenozoic temperature shifts and the complexity of correlating Arctic and lower latitude sections. Innovative methodologies, such as fluorescence microscopy, are suggested to enhance the resolution of biostratigraphy and provide a framework for understanding the Arctic's climatic history.