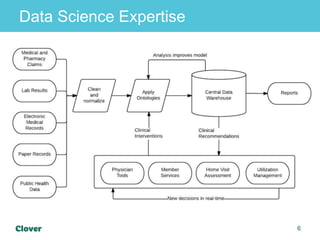
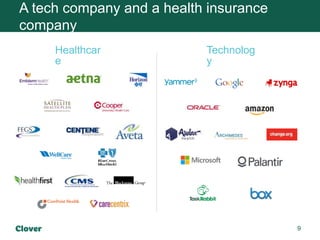
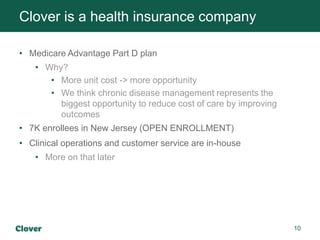
A brief tour of why we focused on building out a data warehouse early on at Clover, and why we think the Data Science function has room to grow in health insurance.
4. 4
Data Science at Clover
Ian Blumenfeld
Platform - Health modeling at
Archimedes, lapsed physics Phd
Otis Anderson
Product - analytics at Yammer, MS
Office, former affirmative action
consultant
9. 9
A tech company and a health insurance
company
Healthcar
e
Technolog
y
10. 10
• Medicare Advantage Part D plan
• Why?
• More unit cost -> more opportunity
• We think chronic disease management represents the
biggest opportunity to reduce cost of care by improving
outcomes
• 7K enrollees in New Jersey (OPEN ENROLLMENT)
• Clinical operations and customer service are in-house
• More on that later
Clover is a health insurance company
11. Our goal is to organize and leverage
data to fix our healthcare system.
Clover is trying to improve health
outcomes for our member population.
We are using the tools of data science
and modern web development to
prioritize, assess and iterate upon our
interventions.
1
1
14. Clinical Outcomes? So What?
There’s measuring clinical outcomes and then there is
optimizing them.
To see what I mean let us imagine two campaigns around
nurse visits.
18. So even when you know the outcomes
. . .you still can push to the optimal result by pushing up the processes
that lead to the outcomes. If you want to talk about outcomes where the
targeting is less obvious than a hospital discharge, then predictive
modeling is more important.
What do you want to optimize outcomes then?
• Flexible clinical operations team
• Data warehouse full of joinable outcome and process data
• Apps that gather information as they enable operations
• Speed – data speed and decision speed
21. Difficulties we faced, part I
• Assembling catalogue of necessary
data
• Adding joinable keys into separate
data sources
• Pinning down when membership
starts and stops
• Parsing unstructured data
• Transforming hard to scrape-data
(PDFs, invoices, one actual
photograph of a series of data
points)
• Interpreting claim duplications –
different for different files and
different use cases
• Reconciling multiple sources of truth
• Understanding claim semantics
• PROVIDER DATA
• Interpreting part d accounting rules
• Counting hospital visits
• Automating all of the above
• Making sure that the automation
doesn’t break any of the above
23. An example – provider data
To someone who has thought about it for a few minutes, provider data
seems easy.
You want one row per provider with at least address, an identifier,
name, specialty, and whether they are in network.
What happened?
1. Our provider data migrated from Access 🙀 to a more custom
physician data management solution.
2. UI in new solution made it hard to validate data.
3. Most accurate data ended up going onto paper. All sorts of horrible
consequences follow when the source of truth is paper 🙀 🙀 🙀
24. An example – provider data
What did we do?
We took control of the data validation process. The object was to get
provider data into a good state and be able to maintain and update it.
But provider data is bad because it is complex. You need to reconcile
multiple sources of truth and update based on occasionally provisional
data.
25. An example – provider data
SIMPLIFIED
WORKFLO
W!!!
27. 27Footer
• We can run all of the things you have to do – star ratings, finance, customer
service, claim forensics out of our data warehouse.
• It can all be joined on a unique of a member, so everything can be related to
everything else.
• We can run lots of things in SQL and Python cutting down on less
automatable solutions like Excel and access.
• Speed and flexibility to answer any ad-hoc question quickly!
A working data warehouse!
28. 28
Useful things engineers have built
Member profile used by Clover staff surfaces history and captures observations.
Backgrounds in physics, neuroscience, economics, computer science , applied stats, applied math and operations research. One person worked for a health insurance company, in an actuarial support role
Turning all of this into scalable decisions. Not dissimilar to the actuarial role in a traditional insurance company. The tools are different, but the outcome is supposed to be advice and insight based on formal reasoning. Some of this will utilize sound statistical inference and machine learning, but the key here is build systems that iterate quickly.
But you need all of those things to run a health insurance company. What’s going on here?
By which I mean, before a lot of the intellectual support roles associated with health insurance
There are lots of things we can influence on this graph. Maybe we can do a series of campaigns to push up the coverage numbers at the end of the funnel. Maybe we’ll get into a state where the clinically superior campaign has the most ocverage too.
You want to build out the human capital of your org as a complement to the software.
On the left we’re curating external data. The bottom reflects app data pushed back in to the loop. Again the bet here is that we can speed up the amount of time it takes us to conclude something about our operations and move on to a different part of the funnel.
All of the people who do those things that aren’t in our realm of expertise. They have hard jobs.
Transitioning between logging systems is messy. Instrumenting human behavior – also messy.
Software eats part of clinical operations
We want it to be easier for NPs to get important information to help set up their visits.
Setting up good nudges to make data capture easy. If we want Nurse Practitioners to send useful data to the data warehouse, we have to make that easy to do.