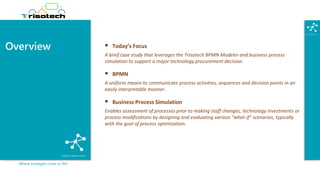
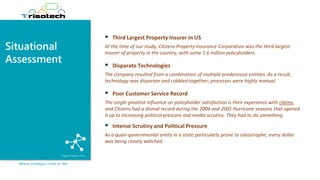
September 28th 2017
Building a bullet-proof
business case using BPMN
modeling and simulation
By
Rob Berg
Perr & Knight
Jonathan L’Ecuyer
Trisotech
Where strategies come to life!
Presenters
Where strategies come to life!
Rob Berg
Principal Director
Operations & Technology
Consulting
Jonathan L’Ecuyer
Manager
Communications & Marketing
Trisotech
Digital
Enterprise
Suite
Cloud-based software to
Visualize, Innovate, Transform,
and Improve your organization
Where strategies come to life!
Companies are facing serious problems:
Trisotech with its Digital Enterprise Suite is in a unique position to help
organizations to transform their business, not only to be more efficient
and effective, but also more agile in delivering and improving customer
experience.
Where strategies come to life!
Overview ▪ Today’s Focus
A brief case study that leverages the Trisotech BPMN Modeler and business process
simulation to support a major technology procurement decision.
▪ BPMN
A uniform means to communicate process activities, sequences and decision points in an
easily interpretable manner.
▪ Business Process Simulation
Enables assessment of processes prior to making staff changes, technology investments or
process modifications by designing and evaluating various “what-if” scenarios, typically
with the goal of process optimization.
Situational
Assessment
Where strategies come to life!
▪ Third Largest Property Insurer in US
At the time of our study, Citizens Property Insurance Corporation was the third largest
insurer of property in the country, with some 1.6 million policyholders.
▪ Disparate Technologies
The company resulted from a combination of multiple predecessor entities. As a result,
technology was disparate and cobbled together; processes were highly manual.
▪ Poor Customer Service Record
The single greatest influence on policyholder satisfaction is their experience with claims,
and Citizens had a dismal record during the 2004 and 2005 Hurricane seasons that opened
it up to increasing political pressure and media scrutiny. They had to do something.
▪ Intense Scrutiny and Political Pressure
As a quasi-governmental entity in a state particularly prone to catastrophe, every dollar
was being closely watched.
Key Challenges
Where strategies come to life!
▪ Identify New Systems
Which commercially-available software applications can address our challenges, and at
what cost?
▪ Convince Decision Makers
How do we convince the Citizens Board of Governors to approve a multimillion dollar
investment in the face of tremendous political pressure and intense media scrutiny?
▪ Build a Bullet-Proof Case
Since the results of the case for making the decision would be made available for public
viewing and press scrutiny under Florida’s “Sunshine Laws”, how do we ensure the case in
support of an affirmative decision is bullet proof?
The Solution
Where strategies come to life!
▪ Process Modeling
Accurate models of the way things are (“As-Is”) and the way we’d like them to be
(“To-Be”).
▪ Use Real Data
An ability to apply real data to process models, including activity durations, resource costs
and transaction volumes to examine the “To-Be” world in advance of taking action.
▪ Use Business Process Simulation
A method that brings static models to life by simulating the impact of process changes,
including staff additions or reductions, automation technologies and workflow
modifications to obtain data to support decisions before taking action.
Process Maps
vs. Models
Where strategies come to life!
o What is being done
o Who is doing it
o What the sequence of activities is
Process Maps
vs. Models
Where strategies come to life!
o What is being done
o Who is doing it
o What they cost
o How long it takes
o Distribution of activity durations
o When it gets done
o What the sequence of activities is
o Alternative paths and probabilities
o Output/capacity
o Overall cost and duration
Using
Simulation to
Support
Procurement
Where strategies come to life!
▪ Newer technology
▪ Business rules-driven
▪ Automates key activities
▪ Costs $2.5 million installed
Should we buy
it?
Evaluation
Objectives
Where strategies come to life!
▪ Compare the current state of operations with some future, desired state.
▪ Identify obvious process challenges, such as excessive handoffs, rework, or
capacity limitations.
▪ Assess the expected financial impact of improvements resulting from new
technology.
▪ Provide solid decision support for the claims replacement project.
Setup
Assumptions
Where strategies come to life!
▪ Claims were called into the customer service center during regular business
hours every 10 to 15 minutes.
▪ Regular business hours were a standard eight-hour workday, five days per
week.
▪ Claims were distributed normally over the estimated interarrival range.
▪ The analysis simulated three months of claims activity.
Runtime
Assumptions
Where strategies come to life!
▪ The time to complete coverage verification will be reduced from 5 – 15
minutes to 30 seconds as a result of policy system integration.
▪ The time required to assign an adjuster will be reduced from 10 – 20 minutes
to 5 minutes as a result of automation.
▪ The time required to adjust a claim will be reduced from 2 – 4 hours (total
contact time) to 2 – 3 hours.
▪ The time required to match checks issued with supporting documentation will
be reduced to nil from 5 – 15 minutes per claim due to automation.
Benefits
Assumptions
Where strategies come to life!
▪ The company will realize 75% of the expected benefits (i.e., potential staff
reductions would not be fully realized).
▪ A 5-year positive ROI supports the claims system replacement project
(indirect benefits provided adequate rationale for going forward with the
project, as long as the project broke even within five years).
▪ No discounting has been applied to account for inflation.
…
Simulation
Results
Where strategies come to life!
▪ Increased claim handling capacity by
26% from 735 to 927 claims over the
three month period studied.
▪ Reduced average cycle time per claim
by 33% from 33 days to 22 days.
▪ Reduced average cost per claim by
36% from $666.88 to $430.12.
Count
0
200
400
600
800
1000
As-Is To-Be
Average Cycle Time (Days)
0
10
20
30
40
As-Is To-Be
Average Cost
0
200
400
600
800
As-Is To-Be
Simulation
Results
Where strategies come to life!
▪ Headcount Reduction = Cost Savings
Productivity increase means staff reductions may be feasible without impacting claim
handling capacity.
▪ Cycle Time Reduction = Satisfied Customers
Reduced average cycle time per claim contributes to productive capacity and customer
satisfaction.
▪ Claim Cost Reduction = Lower Loss Adjustment Expenses
Reduced average cost per claim of $236.76 yields $219,477 in savings over the three-month
simulation period, or more than $877,900 in direct annual benefit.
▪ Solid ROI = Decision Support
The savings amount to a 5-year net tangible benefit of nearly $1.9 million and a 5-year ROI
of 76%.
Simulation
Results
Where strategies come to life!
▪ Adjusted ROI Still Solid
Applying the assumption that the company would realize 75% of potential direct benefits
reduced the expected net tangible benefit to $800,000, with an adjusted 5-year ROI of 32%.
▪ Simulation Study Fully Supported Decision
The simulation results fully supported the claims system replacement project.
Summary
Where strategies come to life!
▪ Get Creative
Go beyond the conventional; think creatively.
▪ Dare to be Different
Esoteric approaches to problem solving and decision support garner greater attention and
interest – if you can make it understandable, you’ll get noticed.
▪ Know Your Stakeholders
Involve decision makers and influencers in the supply and validation of key assumptions.
Get their buy-in early.
▪ Apply Facts
By doing so, you reduce the arguments against an initiative to a debate over the input
assumptions.
▪ Make Your Case Bullet-Proof
Once you gain agreement on the inputs, the outputs become virtually unassailable.
Thank You!
Where strategies come to life!
Rob Berg
Principal & Director
Operations & Technology Consulting
Perr&Knight
561.300.6836
rberg@perrknight.com

Building a bullet proof business case

  • 1.
    September 28th 2017 Buildinga bullet-proof business case using BPMN modeling and simulation By Rob Berg Perr & Knight Jonathan L’Ecuyer Trisotech Where strategies come to life!
  • 2.
    Presenters Where strategies cometo life! Rob Berg Principal Director Operations & Technology Consulting Jonathan L’Ecuyer Manager Communications & Marketing
  • 3.
    Trisotech Digital Enterprise Suite Cloud-based software to Visualize,Innovate, Transform, and Improve your organization Where strategies come to life! Companies are facing serious problems: Trisotech with its Digital Enterprise Suite is in a unique position to help organizations to transform their business, not only to be more efficient and effective, but also more agile in delivering and improving customer experience.
  • 4.
    Where strategies cometo life! Overview ▪ Today’s Focus A brief case study that leverages the Trisotech BPMN Modeler and business process simulation to support a major technology procurement decision. ▪ BPMN A uniform means to communicate process activities, sequences and decision points in an easily interpretable manner. ▪ Business Process Simulation Enables assessment of processes prior to making staff changes, technology investments or process modifications by designing and evaluating various “what-if” scenarios, typically with the goal of process optimization.
  • 5.
    Situational Assessment Where strategies cometo life! ▪ Third Largest Property Insurer in US At the time of our study, Citizens Property Insurance Corporation was the third largest insurer of property in the country, with some 1.6 million policyholders. ▪ Disparate Technologies The company resulted from a combination of multiple predecessor entities. As a result, technology was disparate and cobbled together; processes were highly manual. ▪ Poor Customer Service Record The single greatest influence on policyholder satisfaction is their experience with claims, and Citizens had a dismal record during the 2004 and 2005 Hurricane seasons that opened it up to increasing political pressure and media scrutiny. They had to do something. ▪ Intense Scrutiny and Political Pressure As a quasi-governmental entity in a state particularly prone to catastrophe, every dollar was being closely watched.
  • 6.
    Key Challenges Where strategiescome to life! ▪ Identify New Systems Which commercially-available software applications can address our challenges, and at what cost? ▪ Convince Decision Makers How do we convince the Citizens Board of Governors to approve a multimillion dollar investment in the face of tremendous political pressure and intense media scrutiny? ▪ Build a Bullet-Proof Case Since the results of the case for making the decision would be made available for public viewing and press scrutiny under Florida’s “Sunshine Laws”, how do we ensure the case in support of an affirmative decision is bullet proof?
  • 7.
    The Solution Where strategiescome to life! ▪ Process Modeling Accurate models of the way things are (“As-Is”) and the way we’d like them to be (“To-Be”). ▪ Use Real Data An ability to apply real data to process models, including activity durations, resource costs and transaction volumes to examine the “To-Be” world in advance of taking action. ▪ Use Business Process Simulation A method that brings static models to life by simulating the impact of process changes, including staff additions or reductions, automation technologies and workflow modifications to obtain data to support decisions before taking action.
  • 8.
    Process Maps vs. Models Wherestrategies come to life! o What is being done o Who is doing it o What the sequence of activities is
  • 9.
    Process Maps vs. Models Wherestrategies come to life! o What is being done o Who is doing it o What they cost o How long it takes o Distribution of activity durations o When it gets done o What the sequence of activities is o Alternative paths and probabilities o Output/capacity o Overall cost and duration
  • 10.
    Using Simulation to Support Procurement Where strategiescome to life! ▪ Newer technology ▪ Business rules-driven ▪ Automates key activities ▪ Costs $2.5 million installed Should we buy it?
  • 11.
    Evaluation Objectives Where strategies cometo life! ▪ Compare the current state of operations with some future, desired state. ▪ Identify obvious process challenges, such as excessive handoffs, rework, or capacity limitations. ▪ Assess the expected financial impact of improvements resulting from new technology. ▪ Provide solid decision support for the claims replacement project.
  • 12.
    Setup Assumptions Where strategies cometo life! ▪ Claims were called into the customer service center during regular business hours every 10 to 15 minutes. ▪ Regular business hours were a standard eight-hour workday, five days per week. ▪ Claims were distributed normally over the estimated interarrival range. ▪ The analysis simulated three months of claims activity.
  • 13.
    Runtime Assumptions Where strategies cometo life! ▪ The time to complete coverage verification will be reduced from 5 – 15 minutes to 30 seconds as a result of policy system integration. ▪ The time required to assign an adjuster will be reduced from 10 – 20 minutes to 5 minutes as a result of automation. ▪ The time required to adjust a claim will be reduced from 2 – 4 hours (total contact time) to 2 – 3 hours. ▪ The time required to match checks issued with supporting documentation will be reduced to nil from 5 – 15 minutes per claim due to automation.
  • 14.
    Benefits Assumptions Where strategies cometo life! ▪ The company will realize 75% of the expected benefits (i.e., potential staff reductions would not be fully realized). ▪ A 5-year positive ROI supports the claims system replacement project (indirect benefits provided adequate rationale for going forward with the project, as long as the project broke even within five years). ▪ No discounting has been applied to account for inflation. …
  • 15.
    Simulation Results Where strategies cometo life! ▪ Increased claim handling capacity by 26% from 735 to 927 claims over the three month period studied. ▪ Reduced average cycle time per claim by 33% from 33 days to 22 days. ▪ Reduced average cost per claim by 36% from $666.88 to $430.12. Count 0 200 400 600 800 1000 As-Is To-Be Average Cycle Time (Days) 0 10 20 30 40 As-Is To-Be Average Cost 0 200 400 600 800 As-Is To-Be
  • 16.
    Simulation Results Where strategies cometo life! ▪ Headcount Reduction = Cost Savings Productivity increase means staff reductions may be feasible without impacting claim handling capacity. ▪ Cycle Time Reduction = Satisfied Customers Reduced average cycle time per claim contributes to productive capacity and customer satisfaction. ▪ Claim Cost Reduction = Lower Loss Adjustment Expenses Reduced average cost per claim of $236.76 yields $219,477 in savings over the three-month simulation period, or more than $877,900 in direct annual benefit. ▪ Solid ROI = Decision Support The savings amount to a 5-year net tangible benefit of nearly $1.9 million and a 5-year ROI of 76%.
  • 17.
    Simulation Results Where strategies cometo life! ▪ Adjusted ROI Still Solid Applying the assumption that the company would realize 75% of potential direct benefits reduced the expected net tangible benefit to $800,000, with an adjusted 5-year ROI of 32%. ▪ Simulation Study Fully Supported Decision The simulation results fully supported the claims system replacement project.
  • 18.
    Summary Where strategies cometo life! ▪ Get Creative Go beyond the conventional; think creatively. ▪ Dare to be Different Esoteric approaches to problem solving and decision support garner greater attention and interest – if you can make it understandable, you’ll get noticed. ▪ Know Your Stakeholders Involve decision makers and influencers in the supply and validation of key assumptions. Get their buy-in early. ▪ Apply Facts By doing so, you reduce the arguments against an initiative to a debate over the input assumptions. ▪ Make Your Case Bullet-Proof Once you gain agreement on the inputs, the outputs become virtually unassailable.
  • 19.
    Thank You! Where strategiescome to life! Rob Berg Principal & Director Operations & Technology Consulting Perr&Knight 561.300.6836 rberg@perrknight.com