
More Related Content
What's hot
What's hot (16)
Viewers also liked
Viewers also liked (20)
Similar to brunswick annual reports 2006
Similar to brunswick annual reports 2006 (20)
More from finance36
More from finance36 (20)
Recently uploaded
Recently uploaded (20)
brunswick annual reports 2006
- 1. Brunswick Corporation 2006 Annual Report on Form 10-K
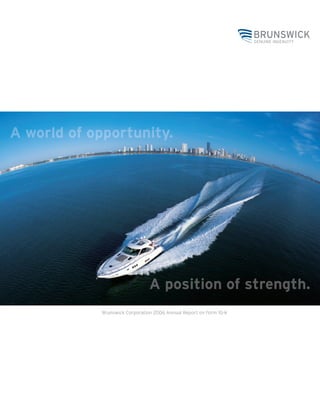
- 2. BRUNSWICK CORPORATION 2006 HIGHLIGHTS* (Amounts in millions, except 2005-2006 2004-2005 percent and per share amounts) 2006 2005 % Change 2004 % Change Corporate Highlights Net sales $5,665.0 $5,606.9 1% $5,058.1 11% Operating earnings $ 341.2 $ 468.7 (27)% $ 394.8 19% Net earnings(1) $ 263.2 $ 371.1 (29)% $ 263.8 41% Diluted earnings per share(1) $ 2.78 $ 3.76 (26)% $ 2.71 39% Diluted shares 94.7 98.8 (4)% 97.3 2% Operating margin 6.0% 8.4% 7.8% Total debt-to-capitalization ratio 28.0% 26.8% 30.2% Market capitalization at year end $2,899.7 $3,887.1 (25)% $4,791.6 (19)% Share price at year end $ 31.90 $ 40.66 (22)% $ 49.50 (18)% Basic shares outstanding at year end 90.9 95.6 (5)% 96.8 (1)% Segment Highlights(2) Boat Net sales $2,864.4 $2,783.4 3% $2,285.0 22% Operating earnings $ 135.6 $ 192.5 (30)% $ 150.4 28% Operating margin 4.7% 6.9% 6.6% Marine Engine Net sales $2,271.3 $2,300.6 (1)% $2,165.8 6% Operating earnings $ 193.8 $ 250.5 (23)% $ 237.2 6% Operating margin 8.5% 10.9% 11.0% Fitness Net sales $ 593.1 $ 551.4 8% $ 558.8 (1)% Operating earnings $ 57.8 $ 56.1 3% $ 44.2 27% Operating margin 9.7% 10.2% 7.9% Bowling & Billiards Net sales $ 458.3 $ 464.5 (1)% $ 442.4 5% Operating earnings $ 22.1 $ 37.2 (41)% $ 41.7 (11)% Operating margin 4.8% 8.0% 9.4% * Results from continuing operations. (1) Diluted earnings per share from continuing operations in 2006, 2005 and 2004 include benefits of $0.50, $0.31 and $0.10, respectively, from tax-related items. Diluted earnings per share in 2005 include a $0.32 benefit from the sale of securities. See the Annual Report on Form 10-K included herein. (2) Segment net sales exclude intercompany eliminations. See Note 5–Segment Information in the Annual Report on Form 10-K. CORPORATE OVERVIEW Brunswick Corporation is a leading producer of marine products, fitness equipment and bowling and billiards products with some of the world’s most recognizable and respected brands. Continuing to expand its global and market presence, Brunswick is built upon a foundation of financial discipline and operational excellence. Brunswick’s 28,000 employees worldwide are dedicated to instilling “Genuine Ingenuity” into everything they make and do to deliver for our customers and consumers. ON TH E C O V ER The new Sea Ray 60 Sundancer
- 3. March 14, 2007 DEAR FELLOW SHAREHOLDER: As we reflect on 2006, we can summarize the year in the following thoughts: ▪ The nature of the industries in which we compete is cyclical; 2006 was a down cycle period, and that is reflected in our results; ▪ Brunswick generates significant cash flow and in 2006, we returned substantial cash to our shareholders through dividends and stock repurchases; and ▪ We continue to make meaningful strides in executing our strategic initiatives. I will expand on each of these thoughts later in this letter. As we enter 2007, we remain leaders in each of our core industries – marine, fitness, bowling and billiards – all market positions that we have sustained for decades. We have an enviable stable of powerhouse brands, market- leading products, unmatched industry knowledge and particular strengths in the markets that we are embracing to execute a solid strategy to grow and prosper in both good times and those not so good. 2006 RESULTS Net sales from continuing operations for 2006 were $5.7 billion, compared with $5.6 billion in 2005. We earned $2.28 per diluted share from continuing operations in 2006, excluding tax benefits, down from $3.13 per diluted share from continuing operations, excluding tax benefits and the gain on a sale of securities, in 2005. Our balance sheet remains healthy with debt-to-total capital of 28.0 percent at the end of 2006 compared with 26.8 percent at the end of 2005. The difference in our 2006 results versus those in 2005 was primarily driven by the decline in the United States recreational marine markets, where we saw nearly double-digit declines at retail. As we look at our business, unit volume is the most important factor in determining our financial performance. When retail markets decline, it results in even greater reductions in unit volume for us and we work to manage the number of boats in our pipeline inventory. Several factors were at work in 2006 causing retail demand to decline. One important factor was disposable income. While disposable income on an absolute basis continues to increase, the rate of growth has slowed. More importantly, however, the dollars actually available to families for use in purchasing non-essential items decreased beginning in late 2005, and we believed this decrease continued during portions of 2006. The cost of gasoline, food, schooling, healthcare and housing, to name a few, ate into the income available for larger ticket consumer discretionary items. Brunswick Corporation 1 N. Field Court Lake Forest, IL 60045-4811 Telephone 847.735.4700
- 4. A second important factor is the price of boats. Not surprisingly, boat price increases are inversely proportional to demand. The average price of powerboats continues to increase, depressing retail demand. Low-emission regulations for outboard engines and underlying inflationary pressures for components and key raw materials such as resins, aluminum and copper, contribute to increase the price of boats to the consumer. As discussed in more detail below, we believe our efforts to improve our cost position will help us address this issue. But while we operate in cyclical segments and cannot control the cycles, we can continue to improve our business model. Our goal has been to produce ever increasing earnings versus the prior cycle at both the peak and at the trough. The chart below, which shows U.S. marine industry retail volumes as well as Brunswick’s diluted earnings per share for the period 2000 to 2006, demonstrates that we are achieving our goal. U.S. Marine Industry Retail Units vs. Brunswick Diluted EPS 350,000 3.50 U.S. Marine Industy Retail (Units) 340,000 3.00 Brunswick Diluted EPS ($) 330,000 2.50 320,000 2.00 310,000 300,000 1.50 290,000 1.00 280,000 0.50 270,000 260,000 0.00 2000 2001 2002 2003 2004 2005 2006 U.S. Marine Industry Retail Units(1) Brunswick Diluted EPS(2) (1) 2000 to 2005 industry data source: National Marine Manufacturers Association; 2006 industry data source: Brunswick estimate. (2) Diluted earnings per share in 2006, 2005 and 2004 exclude tax-related benefits of $47.0 million ($0.50 per diluted share), $30.8 million ($0.31 per diluted share) and $10.0 million ($0.10 per diluted share), respectively. Diluted earnings per share in 2005 exclude a $31.5 million ($0.32 per diluted share) after-tax gain on the sale of securities. Our unrelenting focus on our strategies, which are discussed below in detail, has enabled us to achieve the results shown above. RETURNING CASH OUR SHAREHOLDERS TO We ended 2006 with a cash balance of $283 million. Free cash flow from continuing operations (defined as cash provided by operations less capital expenditures plus proceeds from sales) totaled $153 million in 2006, and capital expenditures totaled $205 million. These numbers are impressive when one considers the lower sales and earnings resulting from the down cycle affecting our businesses, the $86 million we invested in acquisitions during 2006, our dividend and share repurchase program. 2
- 5. During 2006, we purchased more than 5.6 million shares, or about 6 percent of our outstanding shares, at a total cost of $196 million. Our dividend totaled another $55 million, bringing the total amount returned to shareholders to $251 million. Investment in growth is always our highest priority, but we continue to view our stock as an excellent investment during times such as these. We will continue to be as aggressive as possible with our share repurchase program during 2007. For more detailed information on our financial results, I encourage you to read Management’s Discussion and Analysis in the Annual Report on Form 10-K that follows this letter. OUR STRATEGY SOUND STRAIGHTFORWARD IS AND Whether it’s building the perfect boat or providing a family friendly atmosphere at our bowling centers, all Brunswick businesses adhere to a straightforward strategy and approach based upon five pillars. These include: ▪ Get the product right. Introduce the highest quality product at the best price with the most innovative technology and styling at a rate faster than our competitors; ▪ Get the distribution right. Distribute products through a distribution model that brings unparalleled profit opportunities to our distribution channel and service to consumers; ▪ Be best cost in our industries. Develop and maintain low-cost manufacturing; continually improve productivity and efficiency; ▪ Be global. Treat the world as our market; manufacture and distribute products globally with local and regional styling; and ▪ Attract and retain talent. Find, train and challenge the best and brightest people who represent and connect with our consumers – blending cultures, languages and ethnic backgrounds. CONSUMERS WANT WHAT WE MAKE While our products are not necessities, they are aspirational. People want to stay in shape, so they seek out our fitness equipment. People are looking for fun ways to spend time with family and friends. A night at one of our bowling centers, or a game of billiards with friends to share some time and stories provides that opportunity. A day on the water has nearly mythological powers for those who desire to reconnect with others, as well as themselves. For boaters, the allure often runs deep. Many have grown up boating, while still others simply feel the pull of the water. The decision to buy our products, then, is often part emotional and part financial, not necessity. We are constantly looking for ways to remove potential hurdles to the sale, by providing improved quality and durability, ensuring easy access to product and parts, better financing and warranty options. We also work on many levels to Get the Product Right, but also to tap into a consumer’s emotions. We accomplish all of this with great processes, people and investments. 3
- 6. Some of our efforts and investments in 2006 that were aimed at improving products, included: ▪ Life Fitness, which unveiled a newly renovated research and development lab at its Franklin Park, Ill., facility. The 38,000-square-foot facility includes space and equipment dedicated to biomechanical, electromagnetic, environmental and mechanical research and development. From high-speed cameras to usage simulation equipment, the state-of-the-art lab helps Life Fitness drive innovation, allowing tremendous improvements in product time-to-market, as well as increases in our products’ already excellent quality and reliability. The results of such efforts will be seen in 2007 as Life Fitness introduces a number of new products for both the home and commercial markets. Life Fitness has already scored a major coup with its recent announcement of being the first in its industry to seamlessly integrate its fitness equipment and Apple Computer’s popular iPod, blending two of the leading products used by exercise enthusiasts. ▪ In bowling, product quality extends beyond the physical attributes of a bowling ball or other piece of equipment, to the experience offered to the bowler. Our retail bowling center operation has answered by expanding its very popular Brunswick Zone concept with even greater size and offerings with the Brunswick Zone XL. During 2006, we opened our fifth Zone XL just outside of Chicago, featuring over 60,000 square feet of entertainment, including 48 lanes of bowling, laser tag, bumper cars, a fun-filled video game arcade, Brunswick billiards tables, a fireside lounge, spacious meeting rooms and much more. All of this, in a family friendly, smoke-free environment, which is becoming more common throughout Brunswick locations. Nearly 80 percent of Brunswick bowling centers’ lanes are now smoke-free. Brunswick Bowling plans to add four Zone XL locations during 2007. ▪ At the 2007 Miami International Boat Show, Mercury Marine highlighted its revolutionary Zeus propulsion system. Developed by our Cummins-MerCruiser diesel joint venture in conjunction with our MotoTron unit, the highly advanced propulsion system uses rear-facing pod drives that independently articulate. Zeus is safer, more fuel efficient and is highly maneuverable with advanced joystick docking controls. ▪ At the same boat show, Mercury also introduced the Project Apollo, which is an engine control system for independently articulating sterndrives. Like Zeus, Apollo also uses a joystick control enabling the operator of the vessel to do such things as slide a 36-foot boat sideways into a 38-foot space. We also will soon debut a joystick control system that harmonizes the interaction of inboard shaft drives and bow and stern thrusters, bringing the same maneuverability to those boats as is available in the Zeus and Apollo systems. The apprehension many face in maneuvering boats will soon be a thing of the past. ▪ Finally, the spirit of innovation continues to thrive within our Brunswick Boat Group, which will launch 47 new boats in model year 2008, beginning in July 2007. IF OUR DEALERS WIN, EVERYONE WINS As for our second strategic tenet – Get the Distribution Right – we have made numerous strides. Our goal is to bring unparalleled profit opportunities to our dealers, who comprise our industry-leading distribution channel, and offer unsurpassed service to consumers. So our dealers can better focus on their customers’ needs, we offer a wide variety of boats and brands. Since 2000, for example, we’ve added 14 new brands to our boat line-up. Our dealers are thus able to both attract and serve a breadth of boaters, while partnering with only one manufacturer – Brunswick. We have also established the industry’s largest, fastest and most reliable parts and accessories delivery service for both boats and engines to ensure that our dealers – and the consumers they serve – have the right parts when and where they need them. We do so to get boaters back on the water. 4
- 7. In early 2007, we introduced Brunswick Dealer Advantage, our most comprehensive effort to date aimed at forging closer and more mutually beneficial relations with our marine dealers. Making our dealers more profitable is a significant element of our strategy. We believe that more profitable dealers do a better job for their consumers and our brands and are able to reinvest in their businesses, which improves the financial health of their dealership. Brunswick Dealer Advantage changes the way we do business with our dealers and provides them with enhanced profit opportunities not available from other manufacturers. Rather than the traditional dealer-manufacturer relationship, we intend to build a business partnership in which both parties win long term. Brunswick Dealer Advantage is a set of valuable tools, products and services that enable dealers to enhance revenue and reduce costs, develop and retain their valuable employees, and provide a one-stop shop for certain customer services and products. These include business insurance, payroll administration and purchasing programs that reduce costs for services such as package shipping, office supplies, computers and wireless products. Dealers also will have access to retirement plans for their employees and scholarships for their employees’ children. Other services include retail financing and insurance and extended warranty coverage right from the showroom floor, making it convenient for consumers. We developed Dealer Advantage in response to conversations with our dealers about their business “pain points,” then set out to help relieve those pains. As a result, we have focused on areas where we can offer a better solution than what has traditionally been in place. PRODUCING SAVINGS, WITHOUT CUTTING CORNERS In the arena of Be Best Cost, during 2006 we continued to harness the power of Lean Six Sigma principles to improve our manufacturing and back-office processes. We also employ a global perspective in selecting suppliers, as well as sites for new construction or expansion of our manufacturing operations, with an eye not only on quality, but costs as well. For example, we will complete the move of both our bowling ball production and Valley-Dynamo’s commercial billiards and game-table manufacturing to Mexico in 2007. The operations will reside in Reynosa, where we already operate the world’s largest boat manufacturing facility, home to the popular and very affordable Bayliner 175. We also completed the ramp up of Mercury Marine’s new engine plant in China, as well as a new manufacturing facility in Japan for a joint venture Mercury operates with Tohatsu Corporation. These plants focus on production of four-stroke outboard engines at 60 horsepower and below for use throughout the world. Late in the year, we took a series of actions to cut costs, create a flatter and faster organization, better utilize overall capacity and improve operating efficiencies. This was done after a thorough review of our entire manufacturing footprint, as well as carefully scrutinizing all processes and activities throughout our organization to determine how we perform our tasks and the benefit of the tasks performed. In doing so, we took advantage of the more productive work processes we have introduced and employed in the past few years, along with ongoing integration efforts, to improve operations across the entire organization. We consolidated certain boat manufacturing facilities, sales offices and distribution warehouses, while reducing our global work force. Efforts such as these will continue in 2007. TO BE GLOBAL, YOU REALLY NEED LOCAL KNOWLEDGE Brunswick continues to Be More Global. Sales outside the U.S. are growing at rates faster than in the U.S., and based on continuing operations, are becoming a larger portion of our total sales, accounting for nearly 32 percent of sales during 2006, up from 22 percent in 2000. Operations, such as ours in Europe, Asia and Latin America, also expose us to developing and quick-growing markets. These operations not only increase sales, but help to mitigate the cyclicality of the U.S. marine market, which is the world’s largest. 5
- 8. Every day, Brunswick is becoming a more global company, not just a U.S.-based company that merely sells its products abroad. We manufacture around the world. We have people on the ground working directly in the markets with local suppliers, dealers and consumers, learning and satisfying their particular desires and expectations for product use, performance and styling. We believe that building global business is all about knowing local tastes. MANAGEMENT TEAMWORK KEYS AND TH E It is our employees – the people who know the business and those who are close to their local markets, customers and consumers – who truly make the difference at Brunswick. Every day our people around the world use their skills, ideas and ingenuity to create and make products that excite our customers, deliver both quality and the latest in technology, and offer innovative features and styling. Let me thank my fellow 28,000 Brunswick colleagues for a solid performance under difficult conditions. It is their commitment to executing against our strategic initiatives and adapting to changing market conditions that makes this possible. Leading the charge to further break the mold, I believe Brunswick has the finest management group in our industries. Our team is seasoned, accomplished, established and tested. We have been working together for several years, allowing Brunswick to stay on course, quickly spot opportunities and move deftly to exploit our competitive advantages. It is a prime example of our fifth strategic tenet to Attract and Retain Talented People. We further support this ideal throughout our organization with training and educational opportunities designed to prepare, expand and stretch our employees to achieve their potential. Brunswick has an active management development program to nurture and mentor our frontline and emerging management corps. We work hard each day to create an environment in which our businesses and all of our people can excel. SALE BRUNSWICK NEW TECHNOLOGIES OF We are constantly evaluating the businesses and markets in which we participate to ensure that they are a strategic fit and provide value. In 2006, we made the decision to sell essentially all of Brunswick New Technologies (BNT) as it was inconsistent with our long-term strategic objectives. We did not believe that, under our ownership, it could achieve its potential in its global markets. We recently announced the sale of the marine electronics and portable navigation device segments of this unit. At this writing, efforts to sell the fleet navigation, the last segment for sale, continue. Certain BNT businesses, however, are important to us for strategic reasons and will remain a part of our portfolio. We retained IDS, which is a dealer management systems provider to the marine and recreational vehicle markets, and is important for our distribution strategy. We are also keeping MotoTron, which is an engine control technology provider, and is important to our product strategy. Finally, we will keep the engineering talent and skills necessary for us to find the best electronic technologies available for our products and to integrate those technologies into our engines, boats and fitness and bowling equipment. 6
- 9. IN C LO S I N G We take our responsibility to enhance shareholder value very seriously. For more than 160 years, we have successfully assessed the strategic headroom in our businesses to determine whether or not to acquire companies, divest operations or create opportunities with existing assets. Our shareholders have supported and believed in us since 1925, when Brunswick Corporation stock was first listed on the New York Stock Exchange, and we intend to continually create value for our investors. We own the premier brands in each of our industries, and we know how to manage these businesses. No company has Brunswick’s breadth and scope in the marine industry. No company equals Brunswick’s quality and innovation in fitness equipment. No company possesses Brunswick’s knowledge and heritage in bowling and billiards. We can’t change the fact that we operate in a cyclical industry, but we can be the best at managing a cyclical business. Our challenge is to determine how to break the mold to influence the industries in which we operate and to grow Brunswick at even a faster pace. We are prudent in looking forward, remaining vigilant on controlling costs and cutting waste. We continue to get closer to consumers and to invest in research and development to produce new products that spur demand. We seek new markets for growth and opportunity, while continuing to nurture and bolster established markets to improve performance. We seek closer, more mutually beneficial relationships with our dealer network as we stress communication, service and partnership. Finally, we continue to relentlessly execute against our strategy to create value. Every day, Brunswick’s 28,000 employees around the world help accomplish these goals using fresh thinking and good old-fashioned hard work as the backdrop. Our dealers and distributors help accomplish these goals by flawlessly facilitating the sale of our products and providing world-class service. And consumers who buy and use our products help accomplish these goals by continually inspiring us to create innovative and best-in-class products and features. With the support of our employees, our partners and our customers, we will continue to be a vibrant and profitable company for decades to come. Sincerely, Dustan E. McCoy Chairman and Chief Executive Officer 7
- 10. [THIS PAGE INTENTIONALLY LEFT BLANK]
- 11. UNITED STATES SECURITIES AND EXCHANGE COMMISSION Washington, D.C. 20549 _______________ Form 10-K [X] ANNUAL REPORT PURSUANT TO SECTION 13 OR 15(d) OF THE SECURITIES EXCHANGE ACT OF 1934 For the fiscal year ended December 31, 2006 or [ ] TRANSITION REPORT PURSUANT TO SECTION 13 OR 15(d) OF THE SECURITIES EXCHANGE ACT OF 1934 Commission file number 1-1043 _______________ Brunswick Corporation (Exact name of registrant as specified in its charter) Delaware 36-0848180 (State or other jurisdiction of incorporation (I.R.S. Employer Identification No.) or organization) 1 N. Field Court, Lake Forest, Illinois 60045-4811 (Address of principal executive offices) (Zip Code) (847) 735-4700 (Registrant’s telephone number, including area code) Securities registered pursuant to Section 12(b) of the Act: Name of each exchange Title of each class on which registered Common Stock ($0.75 par value) New York, Chicago and Preferred Stock Purchase Rights London Stock Exchanges Securities registered pursuant to Section 12(g) of the Act: None ______________ Indicate by check mark if the registrant is a well-known seasoned issuer, as defined in Rule 405 of the Securities Act. Yes [X] No [ ] Indicate by check mark if the registrant is not required to file reports pursuant to Section 13 or Section 15(d) of the Act. Yes [ ] No [X] Indicate by check mark whether the registrant (1) has filed all reports required to be filed by Section 13 or 15(d) of the Securities Exchange Act of 1934 during the preceding 12 months (or for such shorter period that the registrant was required to file such reports), and (2) has been subject to such filing requirements for the past 90 days. Yes [X] No [ ] Indicate by check mark if disclosure of delinquent filers pursuant to Item 405 of Regulation S-K is not contained herein, and will not be contained, to the best of registrant’s knowledge, in the definitive proxy or information statements incorporated by reference in Part III of this Form 10-K or any amendment to this Form 10-K. [X] Indicate by check mark whether the registrant is a large accelerated filer, an accelerated filer, or a non-accelerated filer. See definition of “accelerated filer and large accelerated filer” in Rule 12b-2 of the Exchange Act. (Check one): Large accelerated filer [X] Accelerated filer [ ] Non-accelerated filer [ ] Indicate by check mark whether the registrant is a shell company (as defined in Rule 12b-2 of the Act). Yes [ ] No [X] As of June 30, 2006, the aggregate market value of the voting stock of the registrant held by non-affiliates was $3,080,527,580. Such number excludes stock beneficially owned by officers and directors. This does not constitute an admission that they are affiliates. The number of shares of Common Stock ($0.75 par value) of the registrant outstanding as of February 21, 2007, was 90,728,138. DOCUMENTS INCORPORATED BY REFERENCE Part III of this Report on Form 10-K incorporates by reference certain information that will be set forth in the Company’s definitive Proxy Statement for the Annual Meeting of Shareholders scheduled to be held on May 2, 2007.
- 12. BRUNSWICK CORPORATION INDEX TO ANNUAL REPORT ON FORM 10-K December 31, 2006 TABLE OF CONTENTS Page PART I Item 1. Business 1 Item 1A. Risk Factors 9 Item 1B. Unresolved Staff Comments 11 Item 2. Properties 11 Item 3. Legal Proceedings 12 Item 4. Submission of Matters to a Vote of Security Holders 14 PART II Item 5. Market for Registrant’s Common Equity, Related Stockholder Matters and Issuer Purchases of Equity Securities 15 Item 6. Selected Financial Data 17 Item 7. Management’s Discussion and Analysis of Financial Condition and Results of Operations 19 Item 7A. Quantitative and Qualitative Disclosures About Market Risk 40 Item 8. Financial Statements and Supplementary Data 41 Item 9. Changes in and Disagreements with Accountants on Accounting and Financial Disclosure 41 Item 9A. Controls and Procedures 41 PART III Item 10. Directors, Executive Officers and Corporate Governance 42 Item 11. Executive Compensation 42 Item 12. Security Ownership of Certain Beneficial Owners and Management and Related Stockholder Matters 42 Item 13. Certain Relationships and Related Transactions, and Director Independence 42 Item 14. Principal Accounting Fees and Services 42 PART IV Item 15. Exhibits and Financial Statement Schedules 42
- 13. PART I Item 1. Business Brunswick Corporation (“Brunswick” or “the Company”) is a leading global manufacturer and marketer of boats, including fiberglass pleasure boats; luxury sportfishing convertibles and motoryachts; high-performance boats; offshore fishing boats; aluminum fishing, deck and pontoon boats; rigid inflatable boats; and marine parts and accessories; of outboard, sterndrive and inboard engines; trolling motors; propellers; marine dealer management systems; and engine control systems; of fitness equipment; and of bowling products, including capital equipment, aftermarket and consumer products; billiards tables and accessories; and Air Hockey and foosball tables. The Company also owns and operates Brunswick bowling centers in the United States and other countries, and retail billiards stores in the United States. Brunswick’s strategy is to introduce the highest quality product with the most innovative technology and styling at a rate faster than its competitors; to distribute products through a model that benefits its partners – dealers and distributors – and provides world-class service to its customers; to develop and maintain low-cost manufacturing, continually improving productivity and efficiency; to manufacture and distribute products globally with local and regional styling; and to attract and retain the best and the brightest people, blending cultures, languages and ethnic backgrounds. In addition, the Company pursues growth from expansion of existing businesses and acquisitions. The Company’s objective is to enhance shareholder value by achieving returns on investments that exceed its cost of capital. Refer to Note 5 – Segment Information and Note 2 – Discontinued Operations in the Notes to Consolidated Financial Statements for additional information regarding the Company’s segments and discontinued operations, including operating earnings and total assets by segment for 2006, 2005 and 2004. Boat Segment The Boat segment consists of the Brunswick Boat Group (Boat Group), which manufactures and markets fiberglass pleasure boats, luxury sportfishing convertibles and motoryachts, high-performance boats, offshore fishing boats; aluminum fishing, pontoon and deck boats; and manufactures and distributes marine parts and accessories. The Company believes that its Boat Group, which had net sales of $2,864.4 million during 2006, has the largest dollar sales and unit volume of pleasure boats in the world. The Boat Group manages most of Brunswick’s boat brands, evaluates and enhances the Company’s boat portfolio, expands the Company’s involvement in recreational boating services and activities to enhance the consumer experience and dealer profitability, and speeds the introduction of new technologies into boat manufacturing processes. The Boat Group is comprised of the following boat brands: Albemarle, Cabo and Hatteras luxury sportfishing convertibles and motoryachts; Sea Ray and Sealine yachts, sport yachts, cruisers and runabouts; Bayliner and Maxum cruisers and runabouts; Meridian motoryachts; Boston Whaler, Sea Pro, Sea Boss, Palmetto, Triton, Trophy and Laguna fiberglass fishing boats; Baja high-performance boats; Crestliner, Harris, Lowe, Lund, Princecraft and Triton aluminum fishing, pontoon and deck boats; and Kayot deck and runabout boats. The Boat Group also includes Integrated Dealer Systems, a leading developer of management systems for dealers of marine products and recreational vehicles; a commercial and governmental sales unit that sells products to the United States Government and state, local and foreign governments; and several brands comprising its boat parts and accessories business, including Attwood and Land ‘N’ Sea. The Boat Group procures most of its outboard engines, gasoline sterndrive engines and gasoline inboard engines from Brunswick’s Marine Engine segment. The Boat Group also purchases a portion of its diesel engines from Cummins MerCruiser Diesel Marine LLC (CMD), a joint venture of Brunswick’s Mercury Marine division with Cummins Marine, a division of Cummins Inc. The Boat Group has manufacturing facilities in California, Florida, Indiana, Maryland, Michigan, Minnesota, Mississippi, Missouri, North Carolina, Ohio, Oregon, South Carolina, Tennessee, Washington, Canada, China, Mexico and the United Kingdom. The Boat Group also utilizes contract manufacturing facilities in Poland. In 2006, the Boat Group introduced its Laguna line of bay and offshore fishing boats to complement its offering of saltwater fishing boats with a more feature-rich product that requires minimal upgrades and added options. Laguna boats, which range from 18 to 24 feet, are manufactured at the Company’s facility in Newberry, South Carolina, along with the Boat Group’s Sea Pro, Sea Boss and Palmetto brands. Also during 2006, with the Company’s phase of acquisitions in the United States largely accomplished and the related integration efforts in progress, the Company implemented several cost-reduction initiatives to achieve better utilization of overall capacity and improve operating efficiencies, including the consolidation of certain boat manufacturing facilities, sales offices and distribution warehouses, and reductions in the Company’s global workforce. The Company believes that these actions will support continued investments in strategic initiatives and partially offset the effects of inflation and higher material, energy and other operating expenses in future years. 1
- 14. In February 2006, Brunswick purchased Cabo Yachts, which builds offshore sportfishing convertibles ranging in length from 31 to 52 feet. The acquisition of Cabo Yachts complements the Company’s previous acquisitions of Albemarle and Hatteras, and allows Brunswick to offer a full range of sportfishing convertibles from 24 to 90 feet. Also in February 2006, Brunswick purchased Great American Marina, a marina near St. Petersburg, Florida, in partnership with MarineMax, Inc. (MarineMax), which will own and operate the sales and service portion of the property, while Brunswick will own the 95 slips at the marina. The Company also made small marina investments in California and Mexico during 2006. In April 2006, Brunswick acquired Diversified Marine Products (Diversified), a leading wholesale distributor of marine parts and accessories headquartered in Los Angeles, California, to complement the previous acquisitions of Land ‘N’ Sea Corporation, Attwood Corporation, Kellogg Marine and Benrock, Inc., furthering its initiative to develop its boat parts and accessories business to better serve boat dealers and consumers. The acquisition of Diversified expands Brunswick’s parts and accessories business to the West Coast of the United States and allows it to provide same- or next-day delivery of marine parts and accessories nationwide. Working with its boat dealer network, Brunswick will continue to strive to improve quality, distribution and delivery of parts and accessories to enhance the boating customer’s experience. The Boat Group’s products are sold to end users through a global network of approximately 2,300 dealers and distributors, each of which carries one or more of Brunswick’s boat brands. Sales to the Boat Group’s largest dealer, MarineMax, which has multiple locations and carries a number of the Boat Group’s product lines, represented approximately 26 percent of Boat Group sales in 2006. Domestic retail demand for pleasure boats is seasonal, with sales generally highest in the second calendar quarter of the year. Marine Engine Segment The Marine Engine segment, which had net sales of $2,271.3 million in 2006, consists of the Mercury Marine Group. The Company believes its Marine Engine segment has the largest dollar sales volume of recreational marine engines in the world. Mercury Marine manufactures and markets a full range of sterndrive engines, inboard engines, outboard engines and water jet propulsion systems under the Mercury, Mercury MerCruiser, Mariner, Mercury Racing, Mercury SportJet and Mercury Jet Drive brand names. In addition, Mercury Marine manufactures and markets engine parts and accessories under the Mercury Precision Parts and Mercury Propellers brand names, including marine electronics and control integration systems, steering systems, instruments, controls, propellers, trolling motors, service aids and marine lubricants. Mercury Marine’s sterndrive and inboard engines, outboard engines and water jet propulsion systems are sold either to independent boat builders or to the Boat Group. In addition, Mercury Marine’s outboard engines and parts and accessories are sold to end-users through a global network of approximately 7,000 marine dealers and distributors, specialty marine retailers and marine service centers. Mercury Marine, through CMD, supplies integrated diesel propulsion systems to the worldwide recreational and commercial marine markets, including the Boat Group. Mercury Marine’s operations also include MotoTron, a designer and supplier of sophisticated engine control and vehicle networking systems. Mercury Marine manufactures two-stroke OptiMax outboard engines ranging from 75 to 300 horsepower, all of which feature Mercury’s direct fuel injection (DFI) technology, and four-stroke outboard engine models ranging from 2.5 to 300 horsepower. All of these low-emission engines are in compliance with U.S. Environmental Protection Agency (EPA) requirements, which required a 75 percent reduction in outboard engine emissions over a nine-year period, ending with the 2006 model year. Mercury Marine’s four-stroke outboard engines include Verado, a series of supercharged outboards ranging from 135 to 300 horsepower, and Mercury’s naturally aspirated outboards, which are based on Verado technology, ranging from 75 to 115 horsepower. Mercury’s OptiMax and four-stroke outboards exceed the EPA’s mandated 2006 emissions standards. The State of California has adopted regulations requiring catalytic converters on Brunswick’s sterndrive and inboard engines by January 1, 2008. The Company expects to fully comply with these regulations. Mercury Marine’s sterndrive and outboard engines are produced primarily in Oklahoma and Wisconsin, respectively. Mercury Marine manufactures 40, 50 and 60 horsepower four-stroke outboard engines in a facility in Suzhou, China, and, in a joint venture with its partner, Tohatsu Corporation, produces smaller outboard engines in Komagane, Japan. Some engine components are sourced from Asian suppliers. Mercury Marine also manufactures engine component parts at plants in Florida and Mexico, and has a facility in Belgium that customizes engines for sale into Europe. Diesel marine propulsion systems are manufactured in South Carolina by CMD. Further, Mercury Marine operates a remanufacturing business for engines and service parts in Wisconsin. 2
- 15. In addition to its marine engine operations, Mercury Marine serves markets outside of the United States with a wide range of aluminum, fiberglass and inflatable boats produced either by, or for, Mercury in Australia, China, Poland, Portugal, Russia and Sweden. These boats, which are marketed under the brand names Arvor, Bermuda, Legend, Lodestar, Mercury, Örnvik, Quicksilver, Savage, Uttern and Valiant, are typically equipped with engines manufactured by Mercury Marine and often include other parts and accessories supplied by Mercury Marine. Mercury Marine has equity ownership interests in companies that manufacture boats under the brand names Aquador, Bella and Flipper in Finland; Askeladden in Norway; and Legend, Protector and Rayglass in New Zealand. Mercury Marine also manufactures propellers and underwater sterngear for inboard-powered vessels, under the Teignbridge brand, in the United Kingdom. Domestic retail demand for the Marine Engine segment’s products is seasonal, with sales generally highest in the second calendar quarter of the year. Fitness Segment Brunswick’s Fitness segment is comprised of its Life Fitness division, which designs, manufactures and markets a full line of reliable, high-quality cardiovascular fitness equipment (including treadmills, total body cross-trainers, stair climbers and stationary exercise bicycles) and strength-training equipment under the Life Fitness, Hammer Strength and ParaBody brands. The Company believes that its Fitness segment, which had net sales of $593.1 million during 2006, is the world’s largest manufacturer of commercial fitness equipment and a leading manufacturer of high-end consumer fitness equipment. Life Fitness’ commercial sales are primarily to private health clubs and fitness facilities operated by professional sports teams, the military, governmental agencies, corporations, hotels, schools and universities. Commercial sales are made to customers either directly, through domestic dealers or through international distributors. Consumer products are sold through specialty retailers and on Life Fitness’ website. The Fitness segment’s principal manufacturing facilities are located in Illinois, Kentucky, Minnesota and Hungary. In March 2006, Life Fitness opened a state-of-the-art research and development lab in its Franklin Park, Illinois, facility, which is being used to drive innovation and future product improvements. Life Fitness distributes its products worldwide from regional warehouses and production facilities. Domestic retail demand for Life Fitness’ products is seasonal, with sales generally highest in the first and fourth calendar quarters of the year. During 2006, Life Fitness introduced the Summit Trainer, a newly designed machine that combines cross-training and climbing into one workout, to its line of cardiovascular exercise products. In addition, Life Fitness introduced a number of new fitness products during the year, including commercial and consumer elliptical cross-trainers, treadmills, stationary bikes and home gym products, as well as additional commercial selectorized and core strength-training equipment. Also, during 2006, Life Fitness launched Vivo, its new wireless connectivity technology that integrates health clubs, fitness equipment and exercisers. Vivo provides a more personalized workout experience by allowing users to record workout data and track progress toward their goals, and also allows health clubs to obtain enhanced data on usage and programs to better market them to their customers. Bowling & Billiards Segment The Bowling & Billiards segment is comprised of the Brunswick Bowling & Billiards division (BB&B), which had net sales of $458.3 million during 2006. BB&B is the leading full-line designer, manufacturer and marketer of bowling products, including bowling balls and bowling pins, aftermarket products and parts, and capital equipment, which includes bowling lanes, automatic pinsetters, ball returns, furniture units, and scoring and center management systems. Through licensing arrangements, BB&B also offers an array of bowling consumer products, including bowling shoes, bags and accessories. BB&B also designs and produces a full line of high-quality consumer and commercial billiards tables, Air Hockey table games, foosball tables and related accessories. BB&B operates 107 bowling centers in the United States, Canada and Europe, and, with a joint venture partner, operates 14 additional centers in Japan. These bowling centers offer bowling and, depending on size and location, the following activities and facilities: billiards, video, redemption and other games of skill, laser tag, pro shops, meeting and party rooms, children’s playrooms, restaurants and cocktail lounges. Substantially all of the North American and European centers offer Cosmic Bowling, an enhanced form of bowling with integrated sound systems and glow-in-the-dark effects. To date, 46 of BB&B’s centers have been converted into Brunswick Zones, which are modernized bowling centers that offer an array of family-oriented entertainment activities. The entertainment offerings available at Brunswick Zones are designed to appeal to a broad audience, including families and other recreational bowlers, as well as traditional league bowlers. BB&B has further enhanced the Brunswick Zone concept with expanded Brunswick Zone family entertainment centers, branded Brunswick 3
- 16. Zone XL, which are approximately 50 percent larger than typical Brunswick Zones and feature multiple-venue entertainment offerings such as laser tag games, bumper cars and expanded game rooms. BB&B operates five Brunswick Zone XL centers, located in the Chicago, Denver, Minneapolis and Philadelphia markets, including the opening of an additional Chicago location in 2006. BB&B intends to continue to use this enhanced Brunswick Zone XL model for its new centers. BB&B’s billiards business was established in 1845 and is Brunswick’s oldest enterprise. BB&B designs and markets billiards tables, balls and cues, as well as billiards furniture and related accessories, under the Brunswick and Contender brands. These products are sold worldwide in both commercial and consumer billiards markets. BB&B also includes Valley- Dynamo, a leading manufacturer of commercial and consumer billiards and coin-operated pool tables, Air Hockey table games and foosball tables. The Company believes it has the largest dollar sales volume of billiards tables in the world. In 2003, BB&B opened Brunswick Home & Billiard, its first retail store, in a northern suburb of Chicago, and, in 2005, BB&B expanded this concept by opening three new stores in the Boston and Denver markets. These stores feature billiards tables and other products for the home. BB&B’s primary manufacturing and distribution locations are located in Michigan, Texas, Wisconsin, Hungary and Mexico. In June 2005, Brunswick announced its intention to move its bowling ball manufacturing operations from Muskegon, Michigan, to Reynosa, Mexico, where production commenced in 2006. In September 2006, Brunswick announced that it will also transition its Valley-Dynamo manufacturing operations from Richland Hills, Texas, to a facility in Reynosa, Mexico, alongside its bowling ball facility. Valley-Dynamo production at the Reynosa, Mexico, facility is expected to commence in early- to mid-2007. Brunswick’s bowling and billiards products are sold through a variety of channels, including distributors, dealers, mass merchandisers, bowling centers and retailers, and directly to consumers on the Internet and through other outlets. BB&B products are distributed worldwide from regional warehouses, sales offices and factory stocks of merchandise. Domestic retail demand for BB&B’s products is seasonal, with sales generally highest in the first and fourth calendar quarters of the year. Discontinued Operations The Company established Brunswick New Technologies (BNT) in 2002 to develop Brunswick’s product offerings in marine electronics, engine controls, navigation systems, dealer management systems and related equipment for use in both marine and non-marine applications. BNT is comprised of three businesses: (i) marine electronics sold under the Northstar, Navman and MX Marine brands; (ii) portable navigation devices (PND) for automotive markets, which are based on global positioning systems technology; and (iii) a wireless fleet tracking business. Retail demand for BNT’s products is seasonal, with sales generally highest in the fourth calendar quarter of the year. On April 27, 2006, the Company announced its intention to sell the majority of its BNT business unit. The BNT businesses have become increasingly concentrated in markets outside of Brunswick’s core business segments – marine, fitness, bowling and billiards – and continued growth requires significant investment to ensure successful new product introductions. The Company believes that BNT’s long-term prospects may be better under different ownership. As a result, Brunswick has reported these BNT businesses as discontinued operations in accordance with the criteria of Statement of Financial Accounting Standards (SFAS) No. 144, “Accounting for the Impairment or Disposal of Long-Lived Assets,” related to the classification of assets to be disposed of by sale. These criteria include reclassifying the operations of BNT to discontinued operations for all periods presented. These businesses were previously reported in the Marine Engine segment. Segment results have been restated for all periods presented to reflect the change in Brunswick’s reported segments. Additionally, the BNT businesses that are being retained are now reported as part of the Boat, Marine Engine and Fitness segments, consistent with the manner in which Brunswick’s management now views these businesses. Brunswick’s results as discussed in this Annual Report on Form 10-K reflect continuing operations only, unless otherwise noted. In December 2006, Brunswick announced that increasingly challenging market conditions and pricing pressures in the PND business were adversely affecting the operating performance of BNT and the Company’s ability to sell BNT at or above book value. Based on the performance of the PND and marine electronics operations and discussions with potential buyers, the Company concluded that proceeds from the sale of BNT will be less than its book value. These conditions resulted in a pre-tax non-cash asset impairment charge of $73.9 million, $85.6 million after-tax, in the fourth quarter of 2006. The after- tax impairment amount reflects the reversal of previously recorded tax-benefited operating losses that are no longer expected to be recoverable. In February 2007, Brunswick announced that it had signed definitive agreements to sell BNT’s marine electronics and PND businesses. The Company is continuing to pursue the sale of the wireless fleet tracking business. 4
- 17. Financial Services The Company’s subsidiary, Brunswick Financial Services Corporation (BFS), has a 49 percent ownership interest in a joint venture, Brunswick Acceptance Company, LLC (BAC) with CDF Ventures, LLC (an affiliate of General Electric Capital Corporation), which provides secured floor-plan financing to the Company’s boat and engine dealers. BAC also purchases and services a portion of Mercury Marine’s domestic accounts receivable relating to its boat builder and dealer customers. Additionally, Brunswick’s marine dealers can offer extended product warranties to retail customers through Brunswick Product Protection Corporation (previously Marine Innovations Warranty Corporation, which the Company acquired in 2004). In October 2006, the Company acquired Blue Water Dealer Services, Inc. and its affiliates, a provider of retail financial services to marine dealers, to allow Brunswick to offer a more complete line of financial services to its boat and marine engine dealers and their customers. Refer to Note 8 – Financial Services in the Notes to Consolidated Financial Statements for more information about the Company’s financial services. Distribution Brunswick depends on distributors, dealers and retailers (Dealers) for the majority of its boat sales and significant portions of marine engine, fitness and bowling and billiards products sales. Brunswick has approximately 7,000 Dealers serving its business segments worldwide. Brunswick’s marine Dealers typically carry boats, engines and related parts and accessories. Brunswick’s Dealers are independent companies or proprietors that range in size from small, family-owned businesses to large, publicly traded corporations with substantial revenues and multiple locations. Some Dealers sell Brunswick’s products exclusively, while others also carry competitors’ products. In 2005, the Company sold its minority interest in MarineMax, the Boat Group’s largest dealer, which has multiple locations and carries a number of the Boat Group’s product lines, as part of a registered public offering by MarineMax. Refer to Note 7 – Investments in the Notes to Consolidated Financial Statements for more information about the sale of this investment. Brunswick owns Land ‘N’ Sea, Benrock, Kellogg Marine and Diversified Marine, the primary parts and accessories distribution platforms for the Boat Group. The Boat Group, with 19 distribution centers throughout North America, is the largest wholesale distributor of marine parts and accessories in the world and provides the ability to supply parts quickly and accurately to dealers, repair shops and the do-it-yourself consumer. Demand for a significant portion of Brunswick’s products is seasonal, and a number of Brunswick’s Dealers are relatively small or highly leveraged. As a result, many Dealers require financial assistance to support their business and provide a stable channel for Brunswick’s products. In addition to the services offered by BAC, the Company provides its Dealers with assistance, including incentive programs, loans, loan guarantees and inventory repurchase commitments, under which the Company is obligated to repurchase inventory from a finance company in the event of a Dealer’s default. The Company believes that these arrangements are in its best interest; however, the financial support of its Dealers does expose it to credit and business risk. Brunswick’s business units maintain active credit operations to manage this financial exposure on an ongoing basis, and the Company continues to seek opportunities to improve and sustain its various distribution channels. Refer to Note 10 – Commitments and Contingencies in the Notes to Consolidated Financial Statements for further discussion of these arrangements. International Operations Brunswick’s sales from continuing operations to customers in markets other than the United States were $1,802.4 million (32 percent of net sales) and $1,760.3 million (31 percent of net sales) in 2006 and 2005, respectively. The Company transacts most of its sales in non-U.S. markets in local currencies, and the costs of its products are generally denominated in U.S. dollars. Future strengthening or weakening of the U.S. dollar can affect the financial results of Brunswick’s non-U.S. operations. 5
- 18. Non-U.S. sales from continuing operations are set forth in Note 5 – Segment Information in the Notes to Consolidated Financial Statements and are also included in the table below, which details Brunswick’s non-U.S. sales by region for 2006, 2005 and 2004: 2006 2005 2004 (in millions) Europe $ 926.4 $ 849.4 $ 925.1 Pacific Rim 315.6 277.9 303.2 Canada 311.7 273.3 328.6 Latin America 133.7 101.2 158.3 Africa & Middle East 72.9 53.8 87.2 $ 1,760.3 $ 1,555.6 $ 1,802.4 Boat segment sales comprised approximately 34 percent of Brunswick’s non-U.S. sales in 2006. The Boat Group’s products are manufactured or assembled in the United States, Canada, China, Mexico, Poland and the United Kingdom, and are sold worldwide through dealers. The Boat Group has sales offices in France and the Netherlands. Marine Engine segment sales represented approximately 46 percent of Brunswick’s non-U.S. sales in 2006. The segment’s primary operations include the following: • A marine engine product customization plant and distribution center in Belgium serving Europe, Africa and the Middle East; • A propeller and underwater sterngear manufacturing plant in the United Kingdom; • Sales offices and distribution centers in Australia, Brazil, Canada, China, Japan, Malaysia, Mexico, New Zealand, Singapore and the United Arab Emirates; • Sales offices in Belgium, Denmark, Finland, France, Germany, Italy, the Netherlands, Norway, Sweden, Switzerland and the United Kingdom; • Boat manufacturing plants in Australia, China, Portugal and Sweden; • An outboard engine assembly plant in Suzhou, China; and • A marina and boat club in Suzhou, China, on Lake Tai. Fitness segment sales comprised approximately 14 percent of Brunswick’s non-U.S. sales in 2006. Life Fitness sells its products worldwide and has sales and distribution centers in Brazil, Germany, Hong Kong, Japan, the Netherlands, Spain and the United Kingdom, as well as sales offices in Austria, Hong Kong and Italy. The Fitness segment also manufactures strength-training equipment and select lines of cardiovascular equipment in Hungary for the European market. Bowling & Billiards segment sales comprised approximately 6 percent of Brunswick’s non-U.S. sales in 2006. BB&B sells its products worldwide; has sales offices in Germany, Hong Kong, Tokyo and the United Kingdom; and operates a plant that manufactures automatic pinsetters in Hungary. BB&B commenced bowling ball manufacturing in Reynosa, Mexico, in 2006 and will complete the transition from Muskegon, Michigan, in 2007. BB&B expects its Valley-Dynamo manufacturing facility in Reynosa, Mexico, to commence operations in early- to mid-2007. BB&B operates bowling centers in Austria, Canada and Germany, and holds a 50 percent interest in an entity that sells bowling equipment and operates bowling centers in Japan. Raw Materials Brunswick purchases raw materials from various sources. The Company is not currently experiencing any critical raw material shortages, nor does it anticipate any. General Motors Corporation is the sole supplier of engine blocks used in the manufacture of Brunswick’s gasoline sterndrive and inboard engines. Brunswick has experienced increases in the cost of oil, aluminum, steel and resins used in its manufacturing processes during 2006. The Company continues to expand its global procurement operations to leverage its purchasing power across its divisions and improve supply chain and cost efficiencies. Intellectual Property Brunswick has, and continues to obtain, patent rights covering certain features of its products and processes. By law, Brunswick’s patent rights, which consist of patents and patent licenses, have limited lives and expire periodically. The Company believes that its patent rights are important to its competitive position in all of its business segments. 6
- 19. In the Boat segment, patent rights principally relate to processes for manufacturing fiberglass hulls, decks and components for boat products, as well as patent rights related to boat seats, interiors and other boat features and components. In the Marine Engine segment, patent rights principally relate to features of outboard engines and inboard-outboard drives, including die-cast powerheads; cooling and exhaust systems; drivetrain, clutch and gearshift mechanisms; boat/engine mountings; shock-absorbing tilt mechanisms; ignition systems; propellers; marine vessel control systems; fuel and oil injection systems; supercharged engines; outboard mid-section structures; segmented cowls; hydraulic trim, tilt and steering; screw compressor charge air cooling systems; and airflow silencers. In the Fitness segment, patent rights principally relate to fitness equipment designs and components, including patents covering internal processes, programming functions, displays, design features and styling. In the Bowling & Billiards segment, patent rights principally relate to computerized bowling scorers and bowling center management systems, bowling center furniture, bowling lanes, lane conditioning machines and related equipment, bowling balls, and billiards table designs and components. The following are Brunswick’s primary trademarks for its continuing operations: Boat Segment: Albemarle, Attwood, Baja, Bayliner, Boston Whaler, Cabo, Crestliner, Diversified Marine, Harris, Hatteras, IDS, Kayot, Kellogg Marine, Laguna, Land ‘N’ Sea, Lowe, Lund, Master Dealer, Maxum, Meridian, Palmetto, Princecraft, Sea Boss, Sea Pro, Sea Ray, Seachoice, Sealine, Swivl-Eze, Triton and Trophy. Marine Engine Segment: Mariner, MercNet, MerCruiser, Mercury, MercuryCare, Mercury Marine, Mercury Parts Express, Mercury Precision Parts, Mercury Propellers, Mercury Racing, MotorGuide, MotoTron, OptiMax, Pinpoint, Quicksilver, SeaPro, SmartCraft, SportJet, Teignbridge Propellers, Valiant and Verado. Fitness Segment: Flex Deck, Hammer Strength, Lifecycle, Life Fitness and ParaBody. Bowling & Billiards Segment: Air Hockey, Anvilane, Brunswick, Brunswick Billiards, Brunswick Home and Billiard, Brunswick Pavilion, Brunswick Zone, Brunswick Zone XL, Centennial, Contender, Cosmic Bowling, DBA Products, Dynamo, Gold Crown, Inferno, Lane Shield, Lightworx, Pro Lane, Throbot, Tornado, U.S. Play by Brunswick, Valley, Vector, Virtual Bowling by Brunswick, Viz-A-Ball and Zone. Brunswick’s trademark rights have indefinite lives, and many are well known to the public and considered valuable assets. Competitive Conditions and Position The Company believes that it has a reputation for quality in its highly competitive lines of business. Brunswick competes in its various markets by utilizing efficient production techniques; innovative technological advancements; effective marketing, advertising and sales efforts; providing high-quality products at competitive prices; and offering extensive after- market services. Strong competition exists in each of Brunswick’s product groups, but no single manufacturer competes with Brunswick in all product groups. In each product area, competitors range in size from large, highly diversified companies to small, single- product businesses. Brunswick also competes with businesses that seek to attract customers’ leisure time but do not compete in Brunswick’s product groups. The following summarizes Brunswick’s competitive position in each segment: Boat Segment: The Company believes it has the largest dollar sales and unit volume of pleasure boats in the world with the broadest array of product offerings. There are several major manufacturers of pleasure and offshore fishing boats, along with hundreds of smaller manufacturers. Consequently, this business is both highly competitive and highly fragmented. The Company believes it has the broadest range of boat product offerings in the world, with boats ranging from 10 to 100 feet, along with a parts and accessories business. In all of its boat operations, Brunswick competes on the basis of product features, technology, quality, dealer service, performance, value, durability and styling, along with effective promotion, distribution and pricing. 7
- 20. Marine Engine Segment: The Company believes it has the largest dollar sales volume of recreational marine engines in the world. The marine engine market is highly competitive among several major international companies that comprise the majority of the market, and several smaller companies. Competitive advantage in this segment is a function of product features, technological leadership, quality, service, performance and durability, along with effective promotion, distribution and pricing. Fitness Segment: The Company believes it is the world’s largest manufacturer of commercial fitness equipment and a leading manufacturer of high-quality consumer fitness equipment. There are a few large manufacturers of fitness equipment and hundreds of small manufacturers, which create a highly fragmented competitive landscape. Many of Brunswick’s fitness equipment products feature industry-leading product innovations, and the Company places significant emphasis on new product introductions. Competitive focus is also placed on product quality, marketing activities, pricing and service. Bowling & Billiards Segment: The Company believes it is the world’s leading designer, manufacturer and marketer of bowling products and billiards tables. There are several large manufacturers of bowling products, whereas the bowling retail market is highly fragmented. Competitive emphasis is placed on product innovation, quality, service, marketing activities and pricing. Brunswick also operates 121 retail bowling centers worldwide, including those operated by its joint venture in Japan, where focus is placed on enhancing the bowling and entertainment experience, maintaining quality facilities and providing excellent customer service. Research and Development The Company strives to improve its competitive position in all of its segments by continuously investing in research and development to drive innovation in its products and manufacturing technologies. Brunswick’s research and development investments support the introduction of new products and enhancements to existing products. Research and development expenses for continuing operations are shown below: 2006 2005 2004 (in millions) Boat $ 36.1 $ 28.3 $ 38.0 Marine Engine 67.3 66.6 70.3 Fitness 14.2 16.0 18.4 Bowling & Billiards 5.9 5.9 5.5 Total $ 123.5 $ 116.8 $ 132.2 Number of Employees The approximate number of employees worldwide in continuing operations as of December 31, 2006, is shown below by segment: Boat 13,850 Marine Engine 6,400 Fitness 2,050 Bowling & Billiards 5,400 Corporate 300 Total 28,000 As of December 31, 2006, in the United States, there were 60 employees in the Boat segment, 1,829 employees in the Marine Engine segment, 137 employees in the Fitness segment, and 113 employees in the Bowling & Billiards segment represented by labor unions. The Company believes that it has good relations with these labor unions. The Boat segment negotiated a new labor union contract with employees at its Lowell, Michigan, facility in November 2006. Environmental Requirements See Item 3 of this report for a description of certain environmental proceedings. 8
- 21. Available Information Brunswick maintains an Internet web site at http://www.brunswick.com that includes links to Brunswick’s Annual Report on Form 10-K, Quarterly Reports on Form 10-Q, Current Reports on Form 8-K and any amendments to those reports (SEC Reports). The SEC Reports are available without charge as soon as reasonably practicable following the time that they are filed with or furnished to the SEC. Shareholders and other interested parties may request email notification of the posting of these documents through the Investors section of Brunswick’s Web site. Item 1A. Risk Factors General economic conditions, particularly in the United States and Europe, affect Brunswick’s results. Brunswick’s revenues are affected by economic conditions and consumer confidence worldwide, but especially in the United States and Europe. In times of economic uncertainty, consumers defer expenditures for discretionary items, which affects demand for Brunswick’s products, especially in its marine and billiards businesses. Brunswick’s marine businesses are cyclical in nature, and their success is dependent upon favorable economic conditions, the overall level of consumer confidence and discretionary income levels. Any substantial deterioration in general economic conditions that diminishes consumer confidence or discretionary income can reduce Brunswick’s sales and adversely affect its financial results. Corporate restructurings, layoffs, declines in the value of investments and residential real estate, higher fuel prices and increases in federal and state taxation all can negatively affect Brunswick’s results. Brunswick’s profitability may suffer as a result of competitive pricing pressures. The introduction of lower-priced alternative products by other companies can hurt Brunswick’s competitive position in all of its businesses. The Company is constantly subject to competitive pressures, particularly in the outboard engine market, in which Asian manufacturers often have pursued a strategy of aggressive pricing. Such pricing pressure can limit the Company’s ability to increase prices for its products in response to raw material and other cost increases. Brunswick’s growth depends on the successful introduction of new product offerings. Brunswick’s ability to grow may be adversely affected by difficulties or delays in product development, such as an inability to develop viable new products, gain market acceptance of new products or obtain adequate intellectual property protection for new products. To meet ever-changing consumer demands, the timing of market entry and pricing of new products are critical. Managing the transition to lower-margin products, particularly in Brunswick’s Marine Engine segment, is critical to its operating and financial results. Brunswick has historically derived a significant portion of its earnings from sales of higher-margin products, especially in its outboard engine business. The Marine Engine segment has now completed a transition to manufacturing primarily low- emission four-stroke outboard engines, which have lower margins than the two-stroke products they are replacing. The Company has addressed this margin pressure by relocating some outboard engine manufacturing to lower-cost areas such as China. The Company is also in the process of relocating its bowling ball and Valley-Dynamo billiards table manufacturing to Mexico, where it already manufactures boats. Brunswick’s inability to achieve lower-cost manufacturing, as well as increased competition in the product lines affected, could adversely affect its future operating and financial results. Brunswick’s financial results may be adversely affected if the Company is unable to maintain effective distribution. Because Brunswick sells the majority of its products through third parties such as dealers and distributors, the financial health of its distribution network is critical to Brunswick’s success. Brunswick’s results can be negatively affected if dealers and distributors experience higher operating costs, which can result from rising interest rates, higher rents, labor costs and taxes, and compliance with regulations. In addition, a substantial portion of Brunswick’s marine engine sales are made to boat manufacturers not affiliated with Brunswick. Accordingly, the results of the Marine Engine segment can be influenced by the financial health of these independent boat builders, which depends on their access to capital, ability to develop new products and ability to compete effectively in the marketplace. Brunswick’s independent boat builder customers also can react negatively to the Boat Group’s acquisition of competing independent boat builders, which can lead them to seek marine engine supplies from competing marine engine manufacturers. 9
- 22. Inventory adjustments by major dealers, retailers and independent boat builders adversely affect Brunswick’s operating margins. If Brunswick’s dealers and retailers, as well as independent boat builders who purchase Brunswick’s marine engine products, adjust their inventories downward in response to weakness in retail demand, wholesale demand for Brunswick’s products diminishes. In turn, the Company must reduce production, which results in lower rates of absorption of fixed costs in its manufacturing facilities and thus lower margins. Inventory reduction by dealers and customers can hurt Brunswick’s short-term sales and results of operations and limit its ability to meet increased demand when economic conditions improve. Adverse weather conditions can have a negative effect on marine and retail bowling center revenues. Weather conditions can have a significant effect on Brunswick’s operating and financial results, especially in the marine and bowling retail businesses. Sales of Brunswick’s marine products are generally stronger just before and during spring and summer, and favorable weather during these months generally has a positive effect on consumer demand. Conversely, unseasonably cool weather, excessive rainfall or drought conditions during these periods can reduce demand. Hurricanes and other storms can result in the disruption of the Company’s distribution channel, as occurred in 2004 and 2005 on the U.S. Atlantic and Gulf coasts. Since many of Brunswick’s boat products are used on reservoirs, the viability of reservoirs for boating is important to the Boat segment. In addition, severely inclement weather on weekends and holidays, particularly during the winter months, can adversely affect patronage of Brunswick’s bowling centers and, therefore, revenues in the bowling retail business. The Company’s ability to integrate acquisitions successfully may affect its financial results. Since 2001, Brunswick has acquired a number of new businesses and entered into joint ventures, and it intends to continue to pursue other strategic investments to complement its existing product portfolio. The Company’s success in achieving the requisite investment return and effectively integrating the financial, operational and distribution practices and systems of these businesses can affect Brunswick’s financial performance. There can be no assurance that any future acquisitions or joint ventures will be beneficial to Brunswick. The Company’s ability to complete the announced divestiture of its BNT business unit may affect its financial results and position. The possible risks related to the divestiture of BNT’s businesses include delays in completing transactions, lower-than- expected proceeds and post-closing claims for indemnification. Licensing requirements and limited access to water can inhibit Brunswick’s ability to grow its marine businesses. Environmental restrictions, permitting and zoning requirements and the increasing cost of and competition for waterfront property can limit access to water for boating, as well as marina and storage space. Brunswick’s Boat and Marine Engine segments can be adversely affected in areas that do not have sufficient marina and storage capacity to satisfy demand. Certain jurisdictions both in and outside the United States require a license to operate a recreational boat, which can deter potential customers. Brunswick’s marine engines may be subject to more stringent environmental regulations. The State of California has adopted regulations requiring catalytic converters on Brunswick’s sterndrive and inboard engines by January 1, 2008. The Company expects to comply fully with these regulations, but compliance will increase the cost of these products. Other environmental regulatory bodies in the United States or other countries also may impose higher emissions standards in the future for Brunswick’s engines. These standards could require catalytic converters, increasing the cost of Brunswick's engines, which could in turn reduce consumer demand for Brunswick’s products. As a result, any increase in the cost of Brunswick’s engines or unforeseen delays in compliance with environmental regulations affecting these products could have an adverse effect on Brunswick’s results of operations. Higher energy costs can adversely affect Brunswick’s results, especially in the marine and bowling center businesses. Higher energy costs result in increases in operating expenses at the Company’s manufacturing facilities and in the cost of shipping products to customers. In addition, increases in energy costs can adversely affect the pricing and availability of petroleum-based raw materials such as resins and foam that are used in many of Brunswick’s marine products. Finally, because heating, air conditioning and electricity comprise a significant part of the cost of operating a bowling center, any increase in the price of energy could adversely affect the operating margins of Brunswick bowling centers. 10
- 23. Higher interest rates can reduce demand, especially for marine products. Customers often finance purchases of Brunswick’s marine products, particularly boats. Rising interest rates can have an adverse effect on dealers’ and consumers’ ability to finance boat purchases, which can adversely affect both the Company’s ability to sell boats and the profitability of its finance activities, including Brunswick Acceptance Company. Changes in currency exchange rates can adversely affect Brunswick’s growth rate. Because the Company derives approximately 32 percent of its revenues from sales outside the United States, its ability to realize projected growth rates can be adversely affected when the U.S. dollar strengthens against other currencies. Brunswick manufactures its products primarily in the United States, and the costs of its products are generally denominated in U.S. dollars, although manufacturing products and sourcing materials outside the United States are increasing. A strong U.S. dollar can make Brunswick’s products less price-competitive relative to local products outside the United States. Brunswick’s business is vulnerable to adverse international conditions. As Brunswick continues to focus on international growth, including in developing countries, and on lower-cost manufacturing outside the United States, it may become increasingly vulnerable to the effects of political instability, adverse economic conditions and the possibility of terrorism, insurrection and military conflict around the world. Brunswick competes with a variety of other activities for consumers’ scarce leisure time. All of Brunswick’s products are used for recreational purposes, and demand for its products can be adversely affected by competition from other activities that occupy consumers’ leisure time, including other forms of recreation as well as religious, cultural and community activities. A decrease in leisure time can reduce consumers’ willingness to purchase and enjoy Brunswick’s products. Item 1B. Unresolved Staff Comments None. Item 2. Properties Brunswick’s headquarters are located in Lake Forest, Illinois. The Company also maintains administrative offices in Chicago and Vernon Hills, Illinois. Brunswick has numerous manufacturing plants, distribution warehouses, retail stores, sales offices and product test sites around the world. Research and development facilities are decentralized within Brunswick’s operating segments, and most are located at manufacturing sites. The Company believes its facilities are suitable and adequate for its current needs and are well maintained and in good operating condition. Most plants and warehouses are of modern, single-story construction, providing efficient manufacturing and distribution operations. The Company believes its manufacturing facilities have the capacity to meet current and anticipated demand. Brunswick owns its Lake Forest, Illinois, headquarters and most of its principal plants. The primary facilities used in Brunswick’s continuing operations are in the following locations: Boat Segment: Adelanto, Los Angeles and Sacramento, California; Old Lyme, Connecticut; Edgewater, Merritt Island, Palm Coast, Pompano Beach and St. Petersburg, Florida; Fort Wayne, Indiana; Cumberland and Salisbury, Maryland; Lowell, Michigan; Little Falls, New York Mills and Pipestone, Minnesota; Aberdeen, Mississippi; Lebanon, Missouri; Edenton, New Bern, Raleigh and Swansboro, North Carolina; Bucyrus, Ohio; Roseburg, Oregon; Newberry, South Carolina; Ashland City, Knoxville and Vonore, Tennessee; Lancaster, Texas; Arlington and Spokane, Washington; Pickering, Ontario, Canada; Princeville, Quebec, Canada; Steinbach, Manitoba, Canada; Toronto, Ontario, Canada; Zhuhai, People’s Republic of China; Reynosa, Mexico; and Kidderminster, United Kingdom. Brunswick owns all of these facilities with the exception of the Pompano Beach, Florida; Lowell, Michigan; Aberdeen, Mississippi; Raleigh, North Carolina; Lancaster, Texas; and Pickering, Ontario, Canada, facilities, which are leased. Marine Engine Segment: Miramar, Panama City and St. Cloud, Florida; Stillwater and Tulsa, Oklahoma; Brookfield, Fond du Lac and Oshkosh, Wisconsin; Melbourne and Sydney, Australia; Petit Rechain, Belgium; Suzhou, People’s Republic of China; St. Cast, France; Juarez, Mexico; Auckland and Christchurch, New Zealand; Vila Nova de Cerveira, Portugal; Singapore; and Newton Abbot, United Kingdom. The Sydney, Australia; St. Cast, France; and Auckland and Christchurch, New Zealand, facilities are leased. The remaining facilities are owned by Brunswick. 11
- 24. Fitness Segment: Franklin Park and Schiller Park, Illinois; Falmouth, Kentucky; Ramsey, Minnesota; and Kiskoros and Szekesfehervar, Hungary. The Schiller Park office and a portion of the Franklin Park facility are leased. The remaining facilities are owned by Brunswick or, in the case of the Kiskoros, Hungary, facility, by a company in which Brunswick is the majority owner. Bowling & Billiards Segment: Lake Forest, Illinois; Muskegon, Michigan; Richland Hills, Texas; Antigo and Bristol, Wisconsin; Szekesfehervar, Hungary; and Reynosa, Mexico; 107 bowling recreation centers in the United States, Canada and Europe, and retail billiards stores in the suburbs of Chicago, Denver and Boston. Approximately 50 percent of BB&B’s bowling centers, as well as the Richland Hills and Reynosa manufacturing facilities and the retail billiards stores and warehouses, are leased. The remaining facilities are owned by Brunswick. Item 3. Legal Proceedings The Company accrues for litigation exposure based upon its assessment, made in consultation with counsel, of the likely range of exposure stemming from the claim. In light of existing reserves, the Company’s litigation claims, when finally resolved, will not, in the opinion of management, have a material adverse effect on the Company’s consolidated financial statements. If current estimates for the cost of resolving any claims are later determined to be inadequate, results of operations could be adversely affected in the period in which additional provisions are required. Tax Case In February 2003, the United States Tax Court issued a ruling upholding the disallowance by the Internal Revenue Service (IRS) of capital losses and other expenses for 1990 and 1991 related to two partnership investments entered into by the Company. In April 2003, the Company elected to pay the IRS $62 million (approximately $50 million after-tax), and in April 2004, the Company elected to pay the IRS an additional $10 million (approximately $8 million after-tax), in connection with this matter pending settlement negotiations. The payments were comprised of $33 million in taxes due and $39 million of pre-tax interest (approximately $25 million after-tax). The Company elected to make these payments to avoid future interest costs. On March 9, 2005, the Company and the IRS reached a preliminary settlement of the issues involved in and related to this case, in which the Company agreed to withdraw its appeal of the tax ruling. All amounts due as a result of the settlement were covered by the payments previously made to the IRS. In addition, all tax computations related to taxable years 1986 through 2001 were calculated and agreed to with the IRS at the examination level. The statute of limitations related to these taxable years expired on March 9, 2006. As a result of these issues and other assessments, the Company reversed $42.6 million of tax reserves in 2006, primarily related to the reassessment of underlying exposures. During the second quarter of 2006, Brunswick received a refund of $12.9 million from the IRS related to the final settlement for these tax years. In the third quarter of 2006, the Company recorded an additional tax receivable of $4.1 million for interest related to these tax years. Additionally, these tax years will be subject to tax audits by various state jurisdictions to determine the state tax effect of the IRS's audit adjustments. Environmental Matters Brunswick is involved in certain legal and administrative proceedings under the Comprehensive Environmental Response, Compensation and Liability Act of 1980 and other federal and state legislation governing the generation and disposal of certain hazardous wastes. These proceedings, which involve both on- and off-site waste disposal or other contamination, in many instances seek compensation or remedial action from Brunswick as a waste generator under Superfund legislation, which authorizes action regardless of fault, legality of original disposition or ownership of a disposal site. Brunswick has established reserves based on a range of cost estimates for all known claims. The environmental remediation and clean-up projects in which Brunswick is involved have an aggregate estimated range of exposure of approximately $38 million to $58 million as of December 31, 2006. At December 31, 2006 and 2005, Brunswick had reserves for environmental liabilities of $49.4 million and $51.5 million, respectively. There were environmental provisions of $0.0 million, $1.5 million and $0.0 million for the years ended December 31, 2006, 2005 and 2004, respectively. 12
- 25. Brunswick accrues for environmental remediation related activities for which commitments or clean-up plans have been developed and for which costs can be reasonably estimated. All accrued amounts are generally determined in coordination with third-party experts on an undiscounted basis and do not consider recoveries from third parties until such recoveries are realized. In light of existing reserves, the Company’s environmental claims, when finally resolved, will not, in the opinion of management, have a material adverse effect on the Company’s consolidated financial position or results of operations. Asbestos Claims Brunswick’s subsidiary, Old Orchard Industrial Corp., has been named as a defendant in more than 10,000 lawsuits involving claims of asbestos exposure from products manufactured by Vapor Corporation (Vapor), a former subsidiary that the Company divested in 1990. Virtually all of the asbestos suits involve numerous other defendants. The claims generally allege that the Company sold products that contained components, such as gaskets, which included asbestos, and seek monetary damages. Neither Brunswick nor Vapor is alleged to have manufactured asbestos. The Company’s insurers have settled seven of these asbestos claims in the past eight years for nominal amounts. Several thousand claims have been dismissed with no payment. No claim has gone to jury verdict. In a few cases, claims have been filed against other Brunswick entities, with a majority of these suits being either dismissed or settled for nominal amounts. The Company does not believe that the resolution of these lawsuits will have a material adverse effect on the Company’s consolidated financial position or results of operations. Australia Trade Practices Investigation In January 2005, Brunswick received a notice to furnish information and documents to the Australian Competition and Consumer Commission (ACCC). A subsequent notice was received in October of 2005. Following the completion of its investigation in December 2006, the ACCC commenced proceedings against a Brunswick subsidiary, Navman Australia Pty Limited, with respect to its compliance with the Trade Practices Act of 1974 as it pertains to Navman Australia’s sales practices from 2001 to 2005. The ACCC has alleged that Navman Australia engaged in resale price maintenance in breach of the Act. Both Brunswick and Navman Australia have cooperated with the ACCC in its investigation and are seeking to resolve the matter by agreeing upon relevant facts and appropriate penalties. Any such agreement must be submitted to the Australian courts for final approval. The Company does not believe that the resolution of this matter will have a material adverse effect on the Company's consolidated financial position or results of operations. Navman Australia is part of the Company’s BNT business and included in discontinued operations. Chinese Supplier Dispute Brunswick is involved in an arbitration proceeding in Hong Kong arising out of a commercial dispute with a former contract manufacturer in China, Shanghai Zhonglu Industrial Company Limited (Zhonglu). The Company filed the arbitration seeking damages based on Zhonglu's breach of a supply and distribution agreement pursuant to which Zhonglu agreed to manufacture bowling equipment. Zhonglu has asserted counterclaims seeking damages for alleged breach of contract among other claims. The arbitration tribunal heard final arguments in August 2005 and the Company is awaiting a decision in the matter. The Company does not believe that this dispute will have a material adverse effect on the Company's consolidated financial condition or results of operations. Refer to Note 10 – Commitments and Contingencies in the Notes to Consolidated Financial Statements for disclosure of the potential cash requirements of environmental proceedings and other legal proceedings. 13