Download to read offline
![“[Marketers] have access to powerful tools that
produce endless streams of information about
contacts, including visitors, leads and customers.
However, data without analysis is simply
noise.”
— My Boss, The Marketing Performance Blueprint
#HUGCLE](https://image.slidesharecdn.com/hug2018q1presentationiv1-slideshare-180403122744/85/Bringing-Structure-and-Meaning-to-Numbers-7-320.jpg)
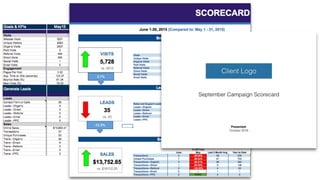


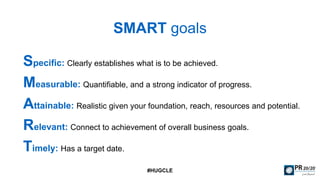
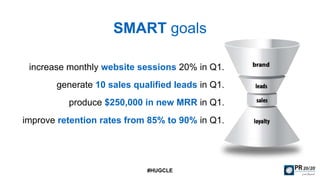

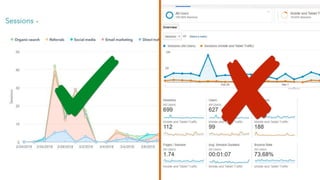


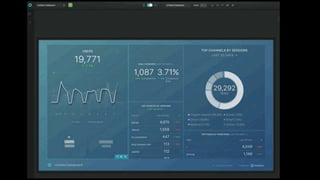


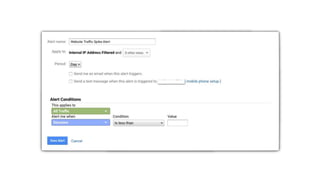
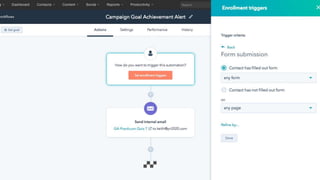
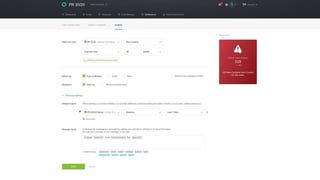
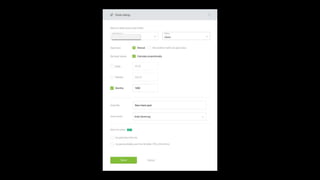

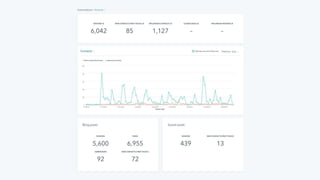


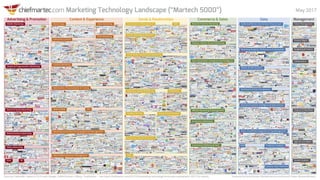
The document presents a series of strategic marketing recommendations, highlighting the importance of setting specific SMART goals and establishing a reliable data source while reflecting on data analysis. It emphasizes the need for data cleaning, segmentation, and the utilization of dashboards and alerts to track performance effectively. Additionally, it discusses various traffic sources and their impact on website performance, providing insights into engagement metrics and growth opportunities.


![[Webinar] Advanced Keyword Research](https://cdn.slidesharecdn.com/ss_thumbnails/webinaradvancedkeywordresearchbypaxtongray-170315203410-thumbnail.jpg?width=640&height=640&fit=bounds)


![[Webinar] SEO Metrics That Matter (and Those That Do Not)](https://cdn.slidesharecdn.com/ss_thumbnails/webinarseometricsbypjhowland-170411205238-thumbnail.jpg?width=640&height=640&fit=bounds)


![[EN].CleverGroup Vietnam Profile 20251202](https://cdn.slidesharecdn.com/ss_thumbnails/en-260120091417-fe6f88ec-thumbnail.jpg?width=640&height=640&fit=bounds)


