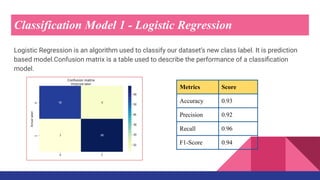
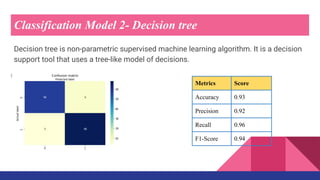
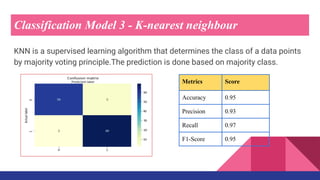
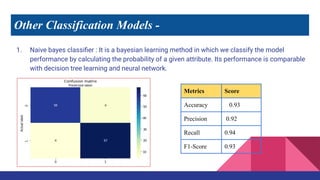
Machine Learning Project
Breast Cancer
Classification
By Anjali Rana, Sapna Rani, Srishty Sonal
Breast cancer is cancer that forms in the cells of the breasts. Breast cancer happens when cells in breast grow and divide
in an uncontrolled way, creating a mass of tissue called a tumor.
Causes
● Age- Being 55 or older increases the risk for breast cancer.
● Sex- Women are much more likely to develop breast cancer than men.
● Family history and genetics- If you have parents, siblings, children or other close relatives who’ve been diagnosed with
breast cancer, you’re more likely to develop the disease at some point in your life.
● Smoking- Tobacco use has been linked to many different types of cancer, including breast cancer.
● Alcohol use- Research indicates that drinking alcohol can increase the risk for certain types of breast cancer.
● Obesity- Having obesity can increase the risk of breast cancer and breast cancer recurrence.
● Radiation exposure- If anyone had prior radiation therapy — especially to head, neck or chest — they are more likely to
develop breast cancer.
● Hormone replacement therapy- People who use hormone replacement therapy (HRT) have a higher risk of being
diagnosed with breast cancer.
Breast Cancer
● A breast lump or thickening that feels different from the surrounding tissue
● Change in the size, shape or appearance of a breast
● Changes to the skin over the breast, such as dimpling
● A newly inverted nipple
● A marble-like hardened area under skin
● Redness or pitting of the skin over your breast, like the skin of an orange
● A blood-stained or clear fluid discharge from nipple.
Diagnosis
● Mammogram- These special X-ray images can detect changes or abnormal growths in
breast. It is commonly used in breast cancer prevention.
● Ultrasonography- This test uses sound waves to take pictures of the tissues inside the
breast. It is used to help diagnose breast lumps or abnormalities.
● Positron emission tomography (PET) scanning- A PET scan uses special dyes to highlight
suspicious areas. Doctor injects a special dye into veins and takes images with the
scanner.
● Magnetic resonance imaging (MRI)- This test uses magnets and radio waves to produce
clear, detailed images of the structures inside breast.
● Surgical biopsy- During a surgical biopsy, a surgeon makes an incision in skin to
access the suspicious area of cells.
Symptoms
Malignant Tumor
● Cancerous
● Non-capsulated
● Fast drawing
● Metastasize
● Cells have large,dark, nuclei may
have abnormal shape
Benign Tumor
● Non-cancerous
● Capsulated
● Non-invasive
● Slow growing
● Do not metastasize
● Cells are normal
Types of Tumor
Case Statement
We are building a model that
suits best in predicting on
encountering a new specific set
of attributes (features) of a
person dealing with breast
cancer to be classified as either
benign or malignant in nature .
Dataset
The database has a total of 11 fields, the first column represents the sample code number i.e. patient’s ID,
column 2 to 9 are the different cytological attributes. Last column is for showing the true class of tumor
(2- for benign, 4-for malignant) .
Attributes
● id
● Clump_thickness
● Size_uniformity
● Shape_uniformity
● Marginal_adhesion
● Epithelial_size
● Bare_nucleoli
● Bland_chromatin
● Normal_nucleoli
● mitoses
Dataset is
Chosen
Data
preprocessing
Data cleaning
Split Data
Apply Machine
Learning
Model
Workflow
Data Cleaning
● Missing or null values :
16 missing values
● Duplicates values :
234 duplicate data
● Replace Benign(2) with Benign(0) and Malignant(4) with Malignant(1)
● Correlation for dependent variable
● Boxplot for Outliers
OUTLIERS : Those data points whose data characteristics are different from the most of the data
points available in our datasets.
BOX PLOT FOR OUTLIERS : It is used to tell how well our data is distributed as well as to
determine outliers.
Outliers for our dataset is : mitosis, epithelial_size
Correlation : The degree in which the two variables move in coordination to one another.
Maximum correlation between two different features : 0.88
Least correlation between two different features : 0.26
Data Visualization
Correlation of Variables
Box plot for Outliers
Splitting of data is done to train our model based on the available dataset.
Here, using Hold-out method, dataset is divided into training(70%) and test set (30%).
Therefore, Data split ratio can be given as 70:30.
Training set : It is used to train the model.
Test set : It is used to check the accuracy of the model.
DATA SPLIT :
● Logistic Regression
● Naive Bayes
● Decision Tree Algorithm
● K-nearest neighbour
For Classification
Machine Learning Algorithms
Classification Model 1 - Logistic Regression
Logistic Regression is an algorithm used to classify our dataset’s new class label. It is prediction
based model.Confusion matrix is a table used to describe the performance of a classification
model.
Metrics Score
Accuracy 0.93
Precision 0.92
Recall 0.96
F1-Score 0.94
Classification Model 2- Decision tree
Decision tree is non-parametric supervised machine learning algorithm. It is a decision
support tool that uses a tree-like model of decisions.
Metrics Score
Accuracy 0.93
Precision 0.92
Recall 0.96
F1-Score 0.94
Classification Model 3 - K-nearest neighbour
KNN is a supervised learning algorithm that determines the class of a data points
by majority voting principle.The prediction is done based on majority class.
Metrics Score
Accuracy 0.95
Precision 0.93
Recall 0.97
F1-Score 0.95
Metrics Score
Accuracy 0.93
Precision 0.92
Recall 0.94
F1-Score 0.93
Other Classification Models -
1. Naive bayes classifier : It is a bayesian learning method in which we classify the model
performance by calculating the probability of a given attribute. Its performance is comparable
with decision tree learning and neural network.
Using Recall ,
Recall of K-nearest neighbour: 0.97
Recall of Decision tree learning: 0.96
Recall of Logistic Regression : 0.96
The best model preferred based on their performance is : k-nearest neighbour
Performance Comparison
Conclusion
We conclude that the model which does the evaluation best
is K-nearest neighbour.
It has better recall score as compared to Logistic regression
and decision trees.
Recall is used in our case because it suits best for
evaluating our model as we want to reduce less number of
False negatives in our case.
● https://www.kaggle.com/datasets/roustekbio/breast-cancer-csv
References
Thank You

Breast Cancer Classification.pdf

  • 1.
    Machine Learning Project BreastCancer Classification By Anjali Rana, Sapna Rani, Srishty Sonal
  • 2.
    Breast cancer iscancer that forms in the cells of the breasts. Breast cancer happens when cells in breast grow and divide in an uncontrolled way, creating a mass of tissue called a tumor. Causes ● Age- Being 55 or older increases the risk for breast cancer. ● Sex- Women are much more likely to develop breast cancer than men. ● Family history and genetics- If you have parents, siblings, children or other close relatives who’ve been diagnosed with breast cancer, you’re more likely to develop the disease at some point in your life. ● Smoking- Tobacco use has been linked to many different types of cancer, including breast cancer. ● Alcohol use- Research indicates that drinking alcohol can increase the risk for certain types of breast cancer. ● Obesity- Having obesity can increase the risk of breast cancer and breast cancer recurrence. ● Radiation exposure- If anyone had prior radiation therapy — especially to head, neck or chest — they are more likely to develop breast cancer. ● Hormone replacement therapy- People who use hormone replacement therapy (HRT) have a higher risk of being diagnosed with breast cancer. Breast Cancer
  • 3.
    ● A breastlump or thickening that feels different from the surrounding tissue ● Change in the size, shape or appearance of a breast ● Changes to the skin over the breast, such as dimpling ● A newly inverted nipple ● A marble-like hardened area under skin ● Redness or pitting of the skin over your breast, like the skin of an orange ● A blood-stained or clear fluid discharge from nipple. Diagnosis ● Mammogram- These special X-ray images can detect changes or abnormal growths in breast. It is commonly used in breast cancer prevention. ● Ultrasonography- This test uses sound waves to take pictures of the tissues inside the breast. It is used to help diagnose breast lumps or abnormalities. ● Positron emission tomography (PET) scanning- A PET scan uses special dyes to highlight suspicious areas. Doctor injects a special dye into veins and takes images with the scanner. ● Magnetic resonance imaging (MRI)- This test uses magnets and radio waves to produce clear, detailed images of the structures inside breast. ● Surgical biopsy- During a surgical biopsy, a surgeon makes an incision in skin to access the suspicious area of cells. Symptoms
  • 4.
    Malignant Tumor ● Cancerous ●Non-capsulated ● Fast drawing ● Metastasize ● Cells have large,dark, nuclei may have abnormal shape Benign Tumor ● Non-cancerous ● Capsulated ● Non-invasive ● Slow growing ● Do not metastasize ● Cells are normal Types of Tumor
  • 5.
    Case Statement We arebuilding a model that suits best in predicting on encountering a new specific set of attributes (features) of a person dealing with breast cancer to be classified as either benign or malignant in nature .
  • 6.
    Dataset The database hasa total of 11 fields, the first column represents the sample code number i.e. patient’s ID, column 2 to 9 are the different cytological attributes. Last column is for showing the true class of tumor (2- for benign, 4-for malignant) . Attributes ● id ● Clump_thickness ● Size_uniformity ● Shape_uniformity ● Marginal_adhesion ● Epithelial_size ● Bare_nucleoli ● Bland_chromatin ● Normal_nucleoli ● mitoses
  • 7.
    Dataset is Chosen Data preprocessing Data cleaning SplitData Apply Machine Learning Model Workflow
  • 8.
    Data Cleaning ● Missingor null values : 16 missing values ● Duplicates values : 234 duplicate data ● Replace Benign(2) with Benign(0) and Malignant(4) with Malignant(1) ● Correlation for dependent variable ● Boxplot for Outliers
  • 9.
    OUTLIERS : Thosedata points whose data characteristics are different from the most of the data points available in our datasets. BOX PLOT FOR OUTLIERS : It is used to tell how well our data is distributed as well as to determine outliers. Outliers for our dataset is : mitosis, epithelial_size Correlation : The degree in which the two variables move in coordination to one another. Maximum correlation between two different features : 0.88 Least correlation between two different features : 0.26 Data Visualization
  • 10.
  • 11.
    Box plot forOutliers
  • 12.
    Splitting of datais done to train our model based on the available dataset. Here, using Hold-out method, dataset is divided into training(70%) and test set (30%). Therefore, Data split ratio can be given as 70:30. Training set : It is used to train the model. Test set : It is used to check the accuracy of the model. DATA SPLIT :
  • 13.
    ● Logistic Regression ●Naive Bayes ● Decision Tree Algorithm ● K-nearest neighbour For Classification Machine Learning Algorithms
  • 14.
    Classification Model 1- Logistic Regression Logistic Regression is an algorithm used to classify our dataset’s new class label. It is prediction based model.Confusion matrix is a table used to describe the performance of a classification model. Metrics Score Accuracy 0.93 Precision 0.92 Recall 0.96 F1-Score 0.94
  • 15.
    Classification Model 2-Decision tree Decision tree is non-parametric supervised machine learning algorithm. It is a decision support tool that uses a tree-like model of decisions. Metrics Score Accuracy 0.93 Precision 0.92 Recall 0.96 F1-Score 0.94
  • 17.
    Classification Model 3- K-nearest neighbour KNN is a supervised learning algorithm that determines the class of a data points by majority voting principle.The prediction is done based on majority class. Metrics Score Accuracy 0.95 Precision 0.93 Recall 0.97 F1-Score 0.95
  • 18.
    Metrics Score Accuracy 0.93 Precision0.92 Recall 0.94 F1-Score 0.93 Other Classification Models - 1. Naive bayes classifier : It is a bayesian learning method in which we classify the model performance by calculating the probability of a given attribute. Its performance is comparable with decision tree learning and neural network.
  • 19.
    Using Recall , Recallof K-nearest neighbour: 0.97 Recall of Decision tree learning: 0.96 Recall of Logistic Regression : 0.96 The best model preferred based on their performance is : k-nearest neighbour Performance Comparison
  • 20.
    Conclusion We conclude thatthe model which does the evaluation best is K-nearest neighbour. It has better recall score as compared to Logistic regression and decision trees. Recall is used in our case because it suits best for evaluating our model as we want to reduce less number of False negatives in our case.
  • 21.
  • 22.