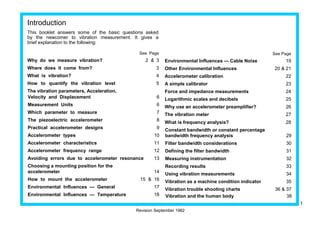
This document provides an introduction to vibration measurement, including:
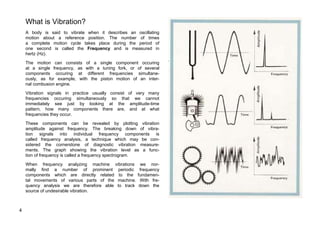
- Why vibration is measured, where it comes from, and what vibration is
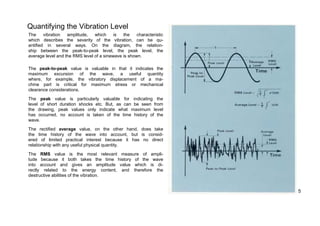
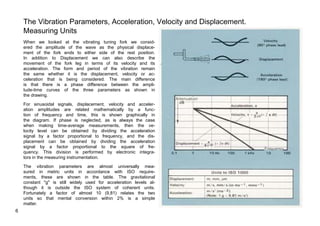
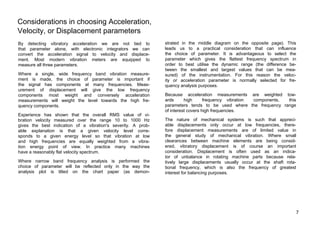
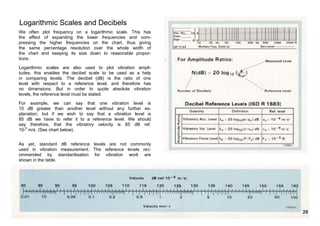
- How to quantify vibration levels using parameters like acceleration, velocity, and displacement
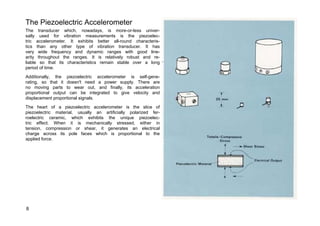
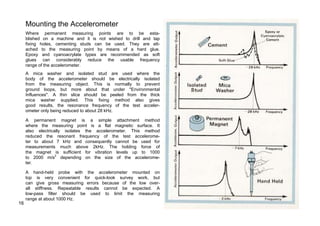
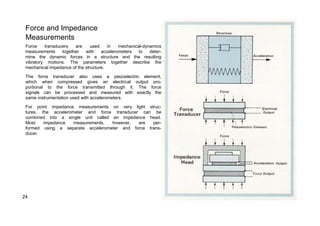
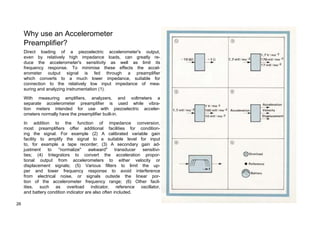
- Details on piezoelectric accelerometers, which are commonly used to measure vibration
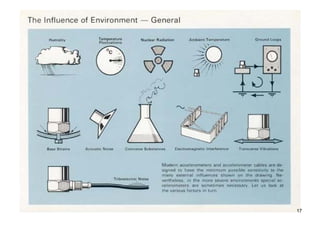
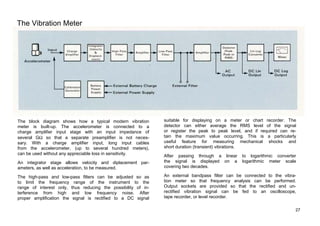
- Factors to consider when taking vibration measurements, like sensor mounting, environmental influences, and instrumentation


![Shaft Alignment Trainer [SAT] presentation](https://cdn.slidesharecdn.com/ss_thumbnails/satpresentation-130805143252-phpapp01-thumbnail.jpg?width=640&height=640&fit=bounds)


![Vibration_and_Its_Causes[1] Vibrations.pdf](https://cdn.slidesharecdn.com/ss_thumbnails/vibrationanditscauses1-241125115821-611dbbe3-thumbnail.jpg?width=640&height=640&fit=bounds)


