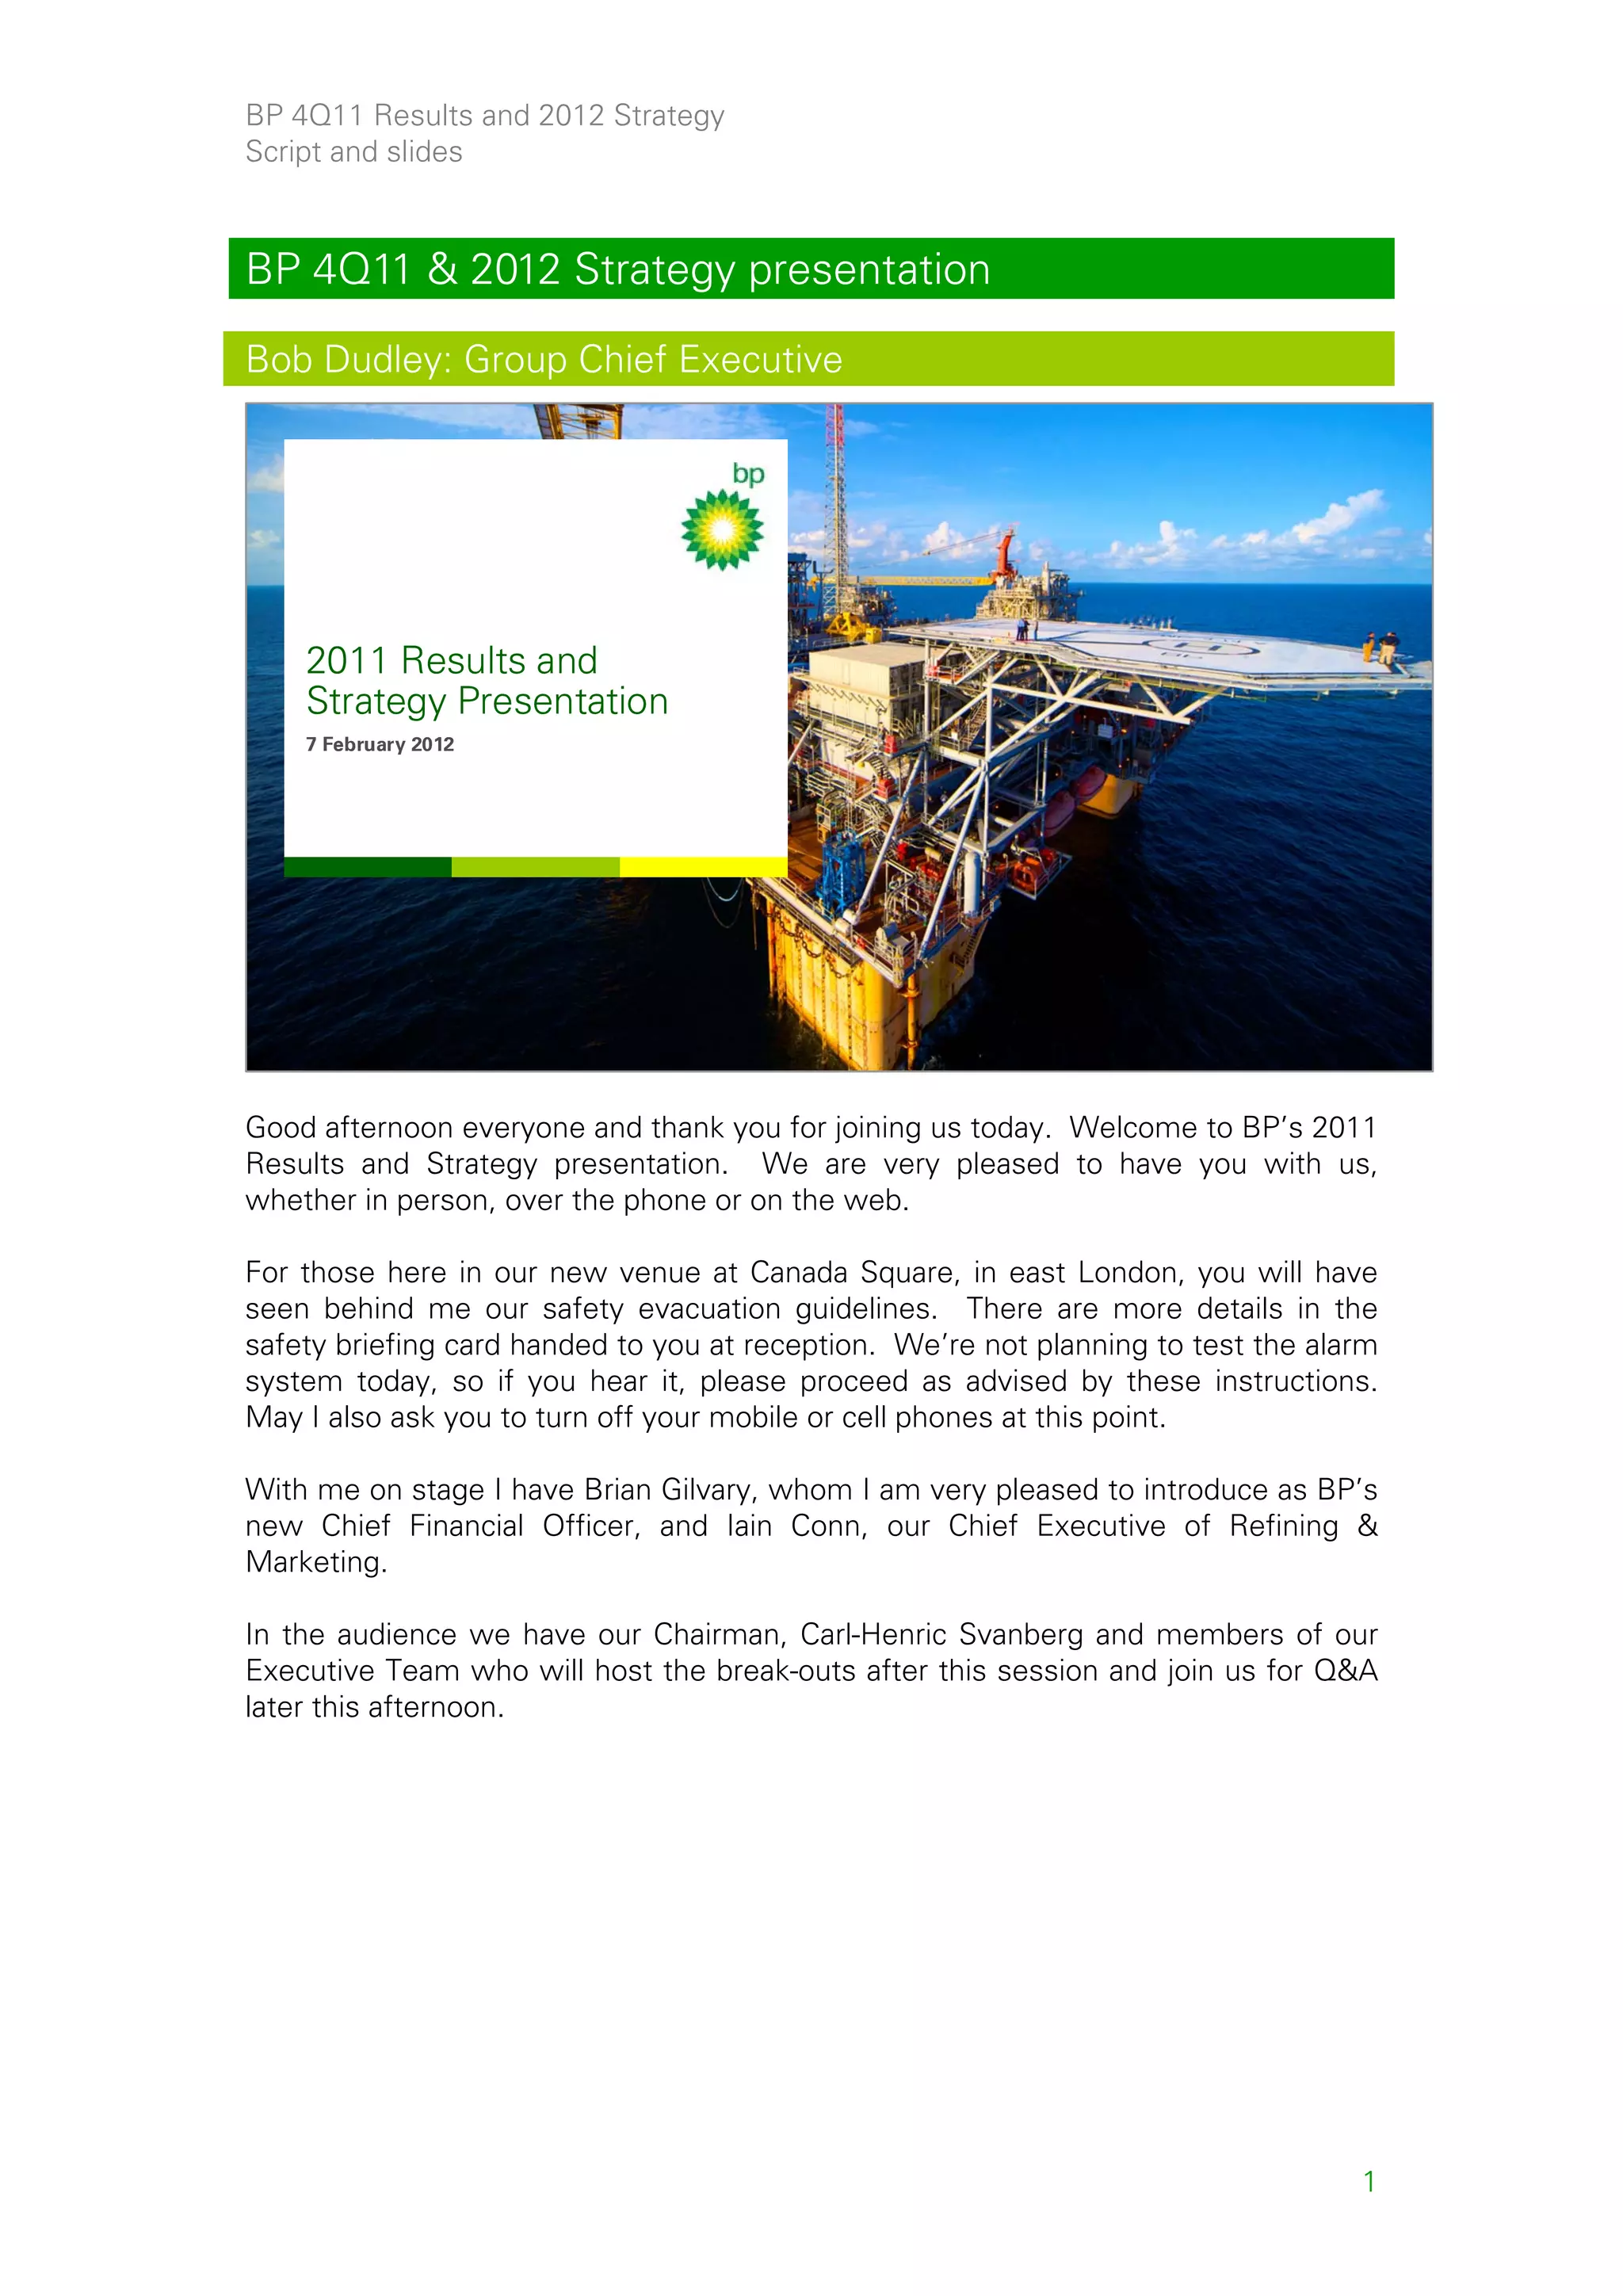
BP held its 2011 Results and Strategy presentation on February 7, 2012. Bob Dudley, BP's Group Chief Executive, welcomed attendees and introduced Brian Gilvary as BP's new Chief Financial Officer and Iain Conn as Chief Executive of Refining & Marketing. Dudley noted safety guidelines for the venue and asked attendees to turn off phones. He then presented BP's cautionary statement regarding forward-looking projections in the presentation. Actual results could differ materially from expectations due to risks including future market conditions.
![BP 4Q11 Results and 2012 Strategy
Script and slides
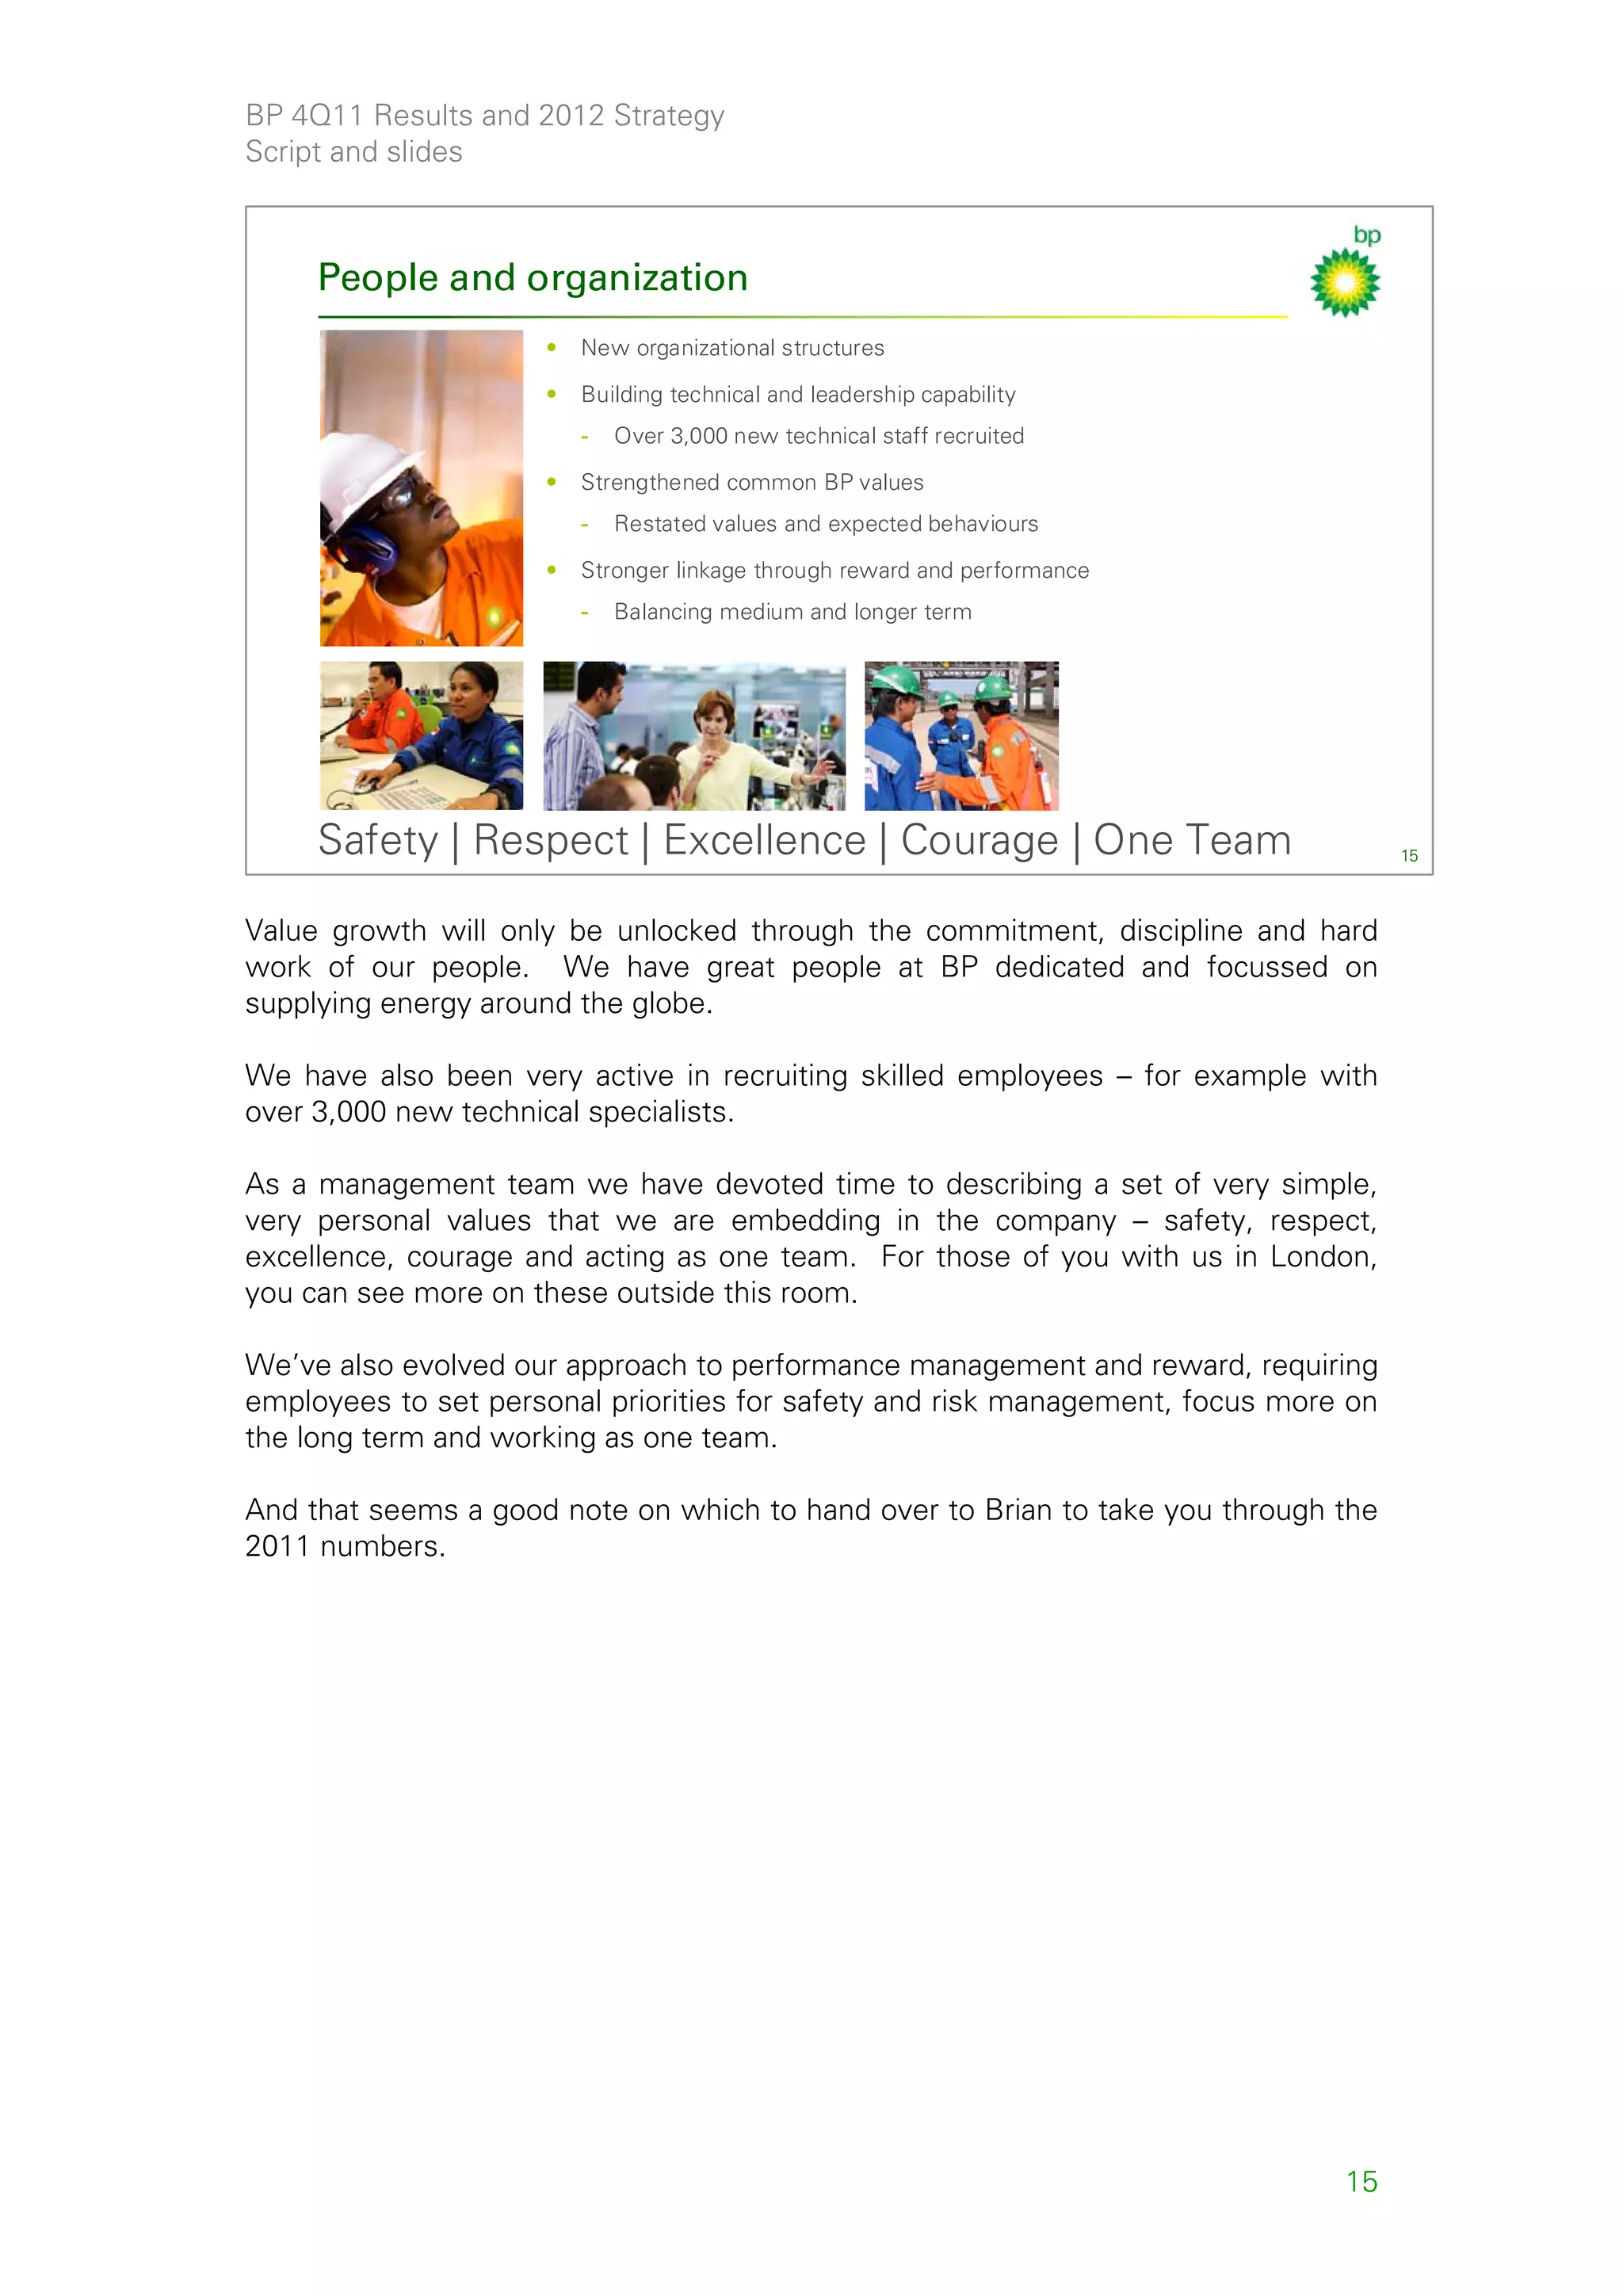
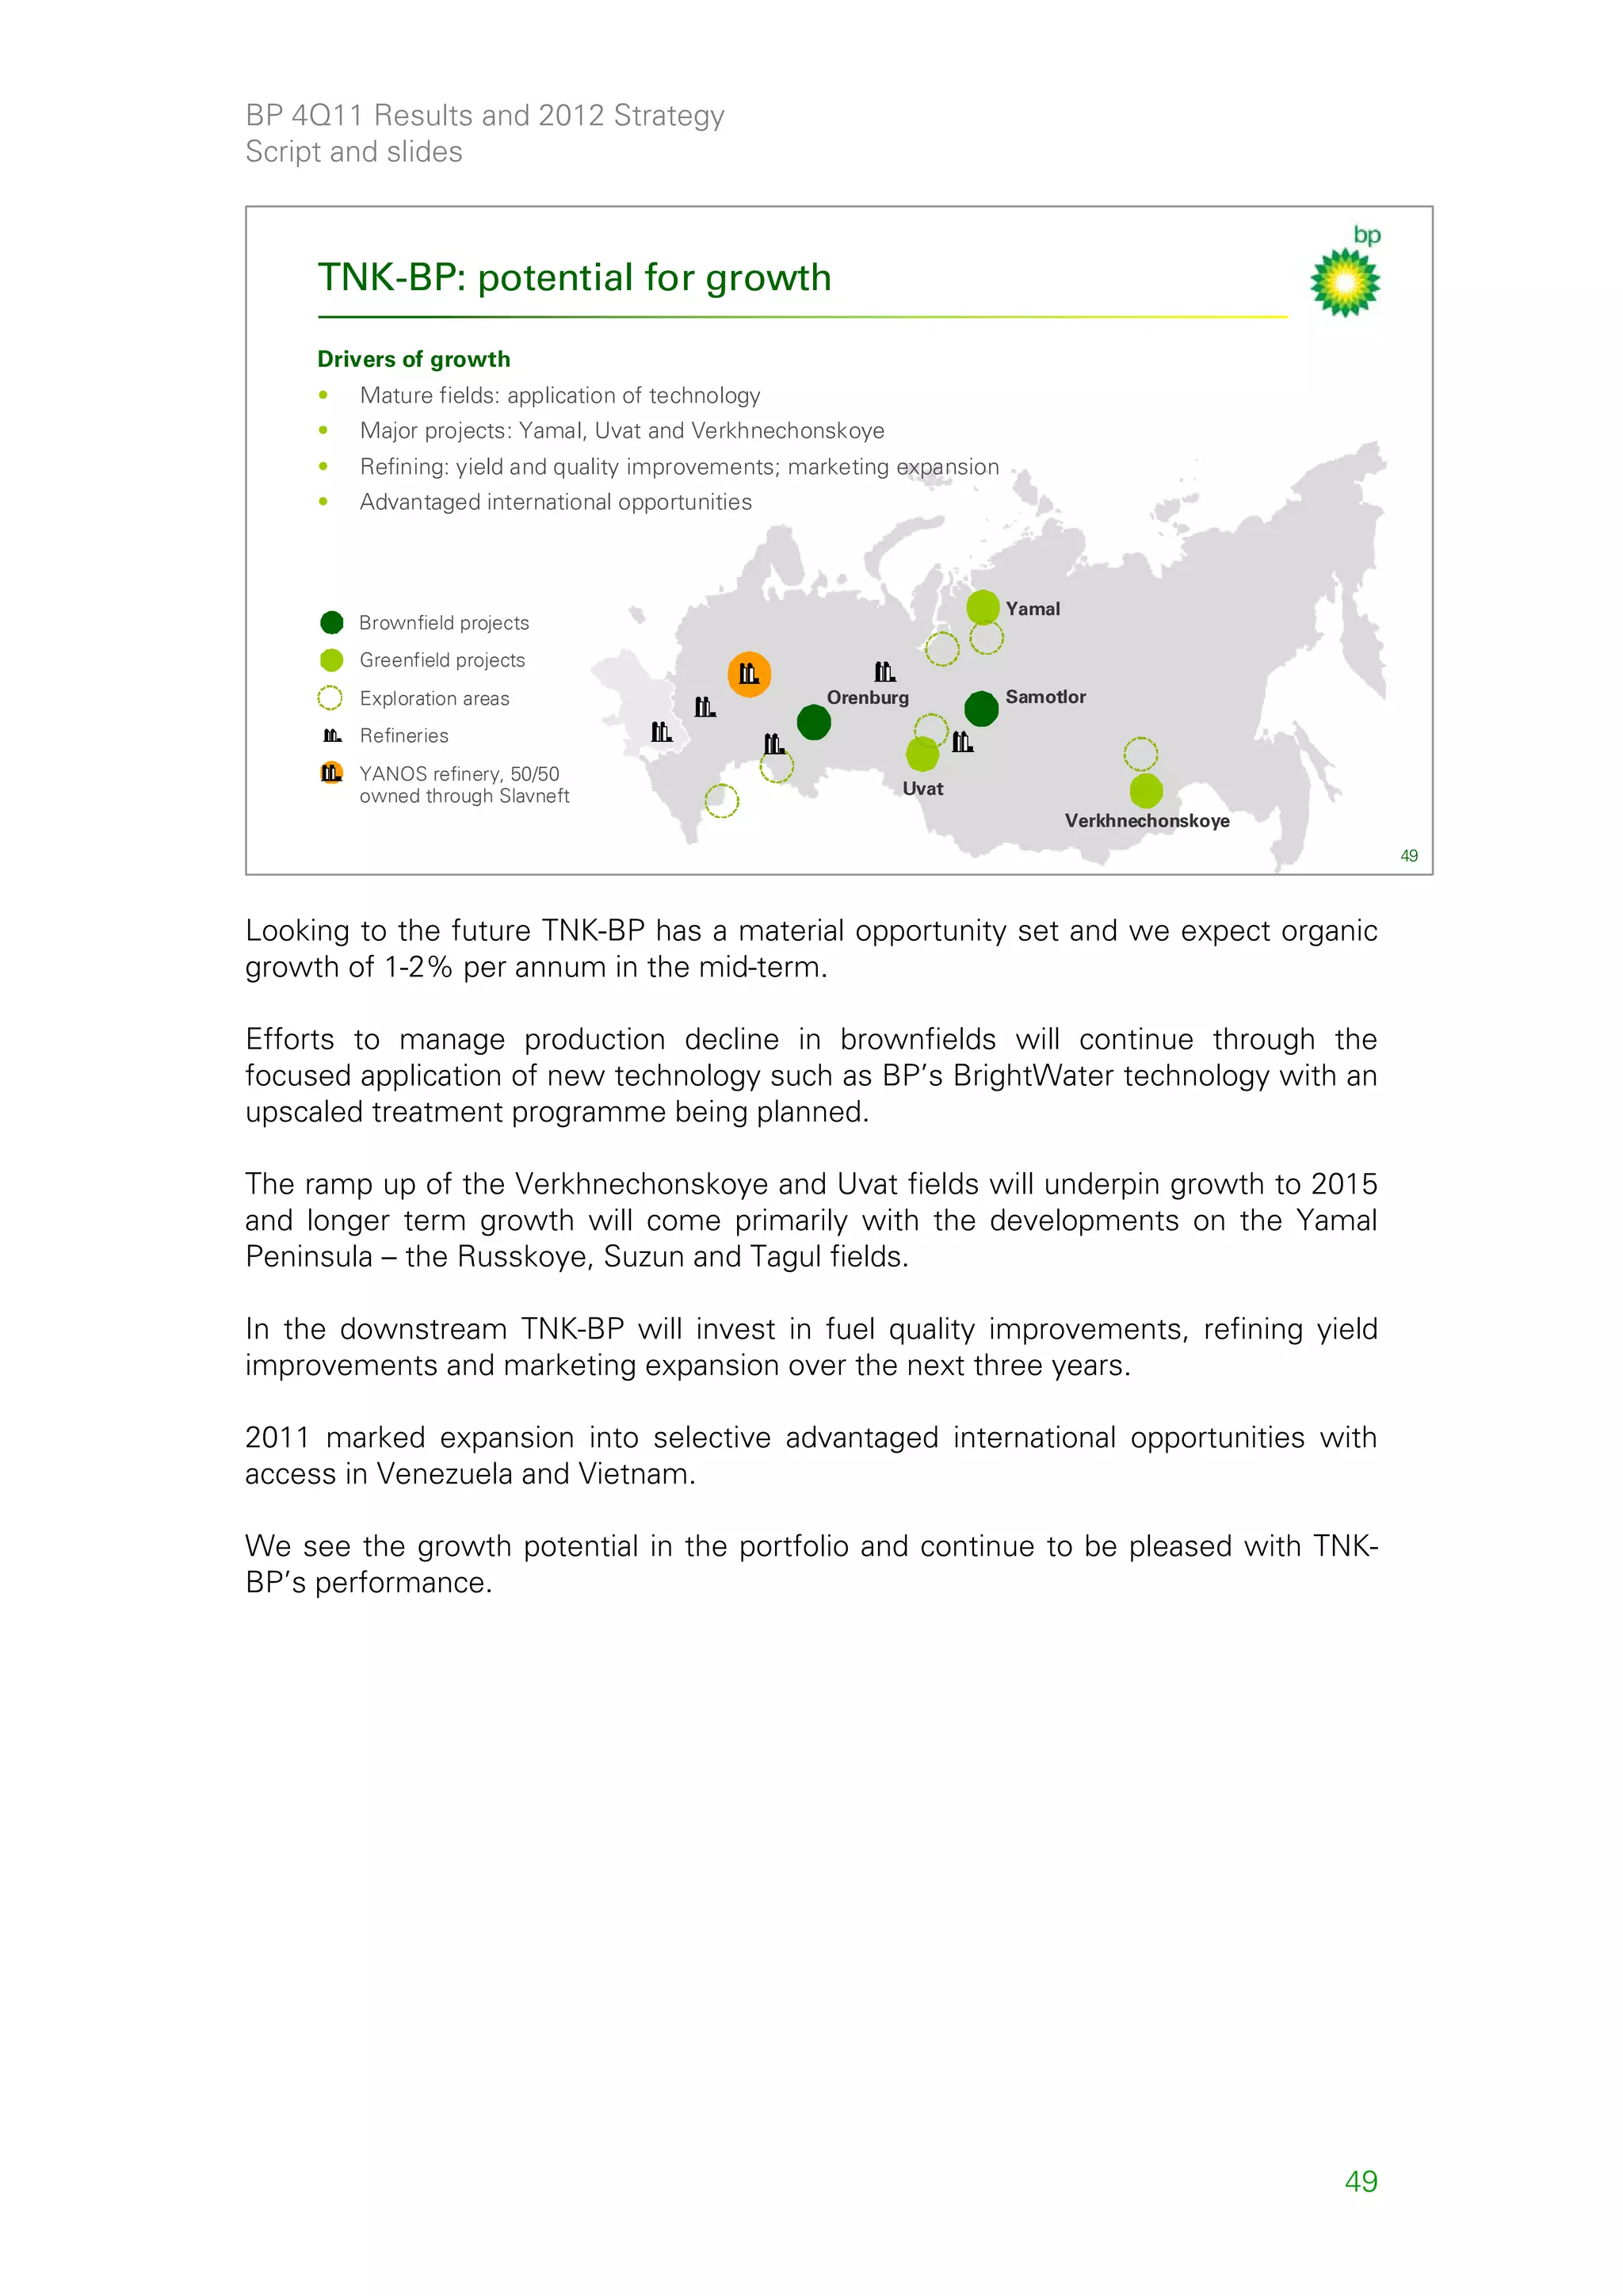
Robust pipeline for the longer term
Exploration Pre-FID Post-FID
• Australia • GoM(1): Kaskida, Thunder • Angola: Block 18 West, • Angola: Kizomba • Angola: LNG, Block 31
• Asia Horse Water Injection, Tiber, Block 31 South-East, Satellites Phase 2 PSVM, Clochas-Mavacola,
Moccasin, Freedom, Mad Pazflor Phase 2, Tulipa • GoM: Mad Dog CLOV
Deepwater • GoM(1)
Dog North • Brazil: Itaipu, Wahoo Phase 2 • GoM: Galapagos,
• North Africa
Na Kika Phase 3, Mars B
• South Atlantic
• Australia • Azerbaijan: Shah Deniz FFD(2) • Australia: Browse, • Australia: Western • Australia: North Rankin 2
• Egypt • Indonesia: Tangguh Western Flank B, Flank A • North Africa: In Salah
Gas Value expansion Persephone • Egypt: West Nile Southern Fields,
• India
Chains • India: D6 Satellites, NEC 25 • Trinidad: Field expansion, Delta In Amenas Compression
• Indonesia
Juniper
• Trinidad
• Egypt: East Nile Delta
Giant Fields • Azerbaijan • Azerbaijan: ACG expansion • North Sea: Greater Clair • North Sea: Clair • Azerbaijan: Chirag Oil
Conventional • North Sea • Iraq: Rumaila expansion • North Sea: Norway Ridge, Quad 204 • North Sea: Skarv, Devenick,
• Canada: Arctic Kinnoull
Unconventional • Alaska: heavy oil • Canada: Sunrise Phase 2, • Canada: Sunrise Phase 1
oil Pike, Terre de Grace
Unconventional • Jordan • Oman: Khazzan • Algeria: Bourarhat
gas (1) GoM: Gulf of Mexico
• US: Eagle Ford • Indonesia: Sanga Sanga
(2) FFD: Full Field Development
• Argentina: Neuquen coal bed methane
Start ups by end 2014 in bold
Excludes TNK-BP 43
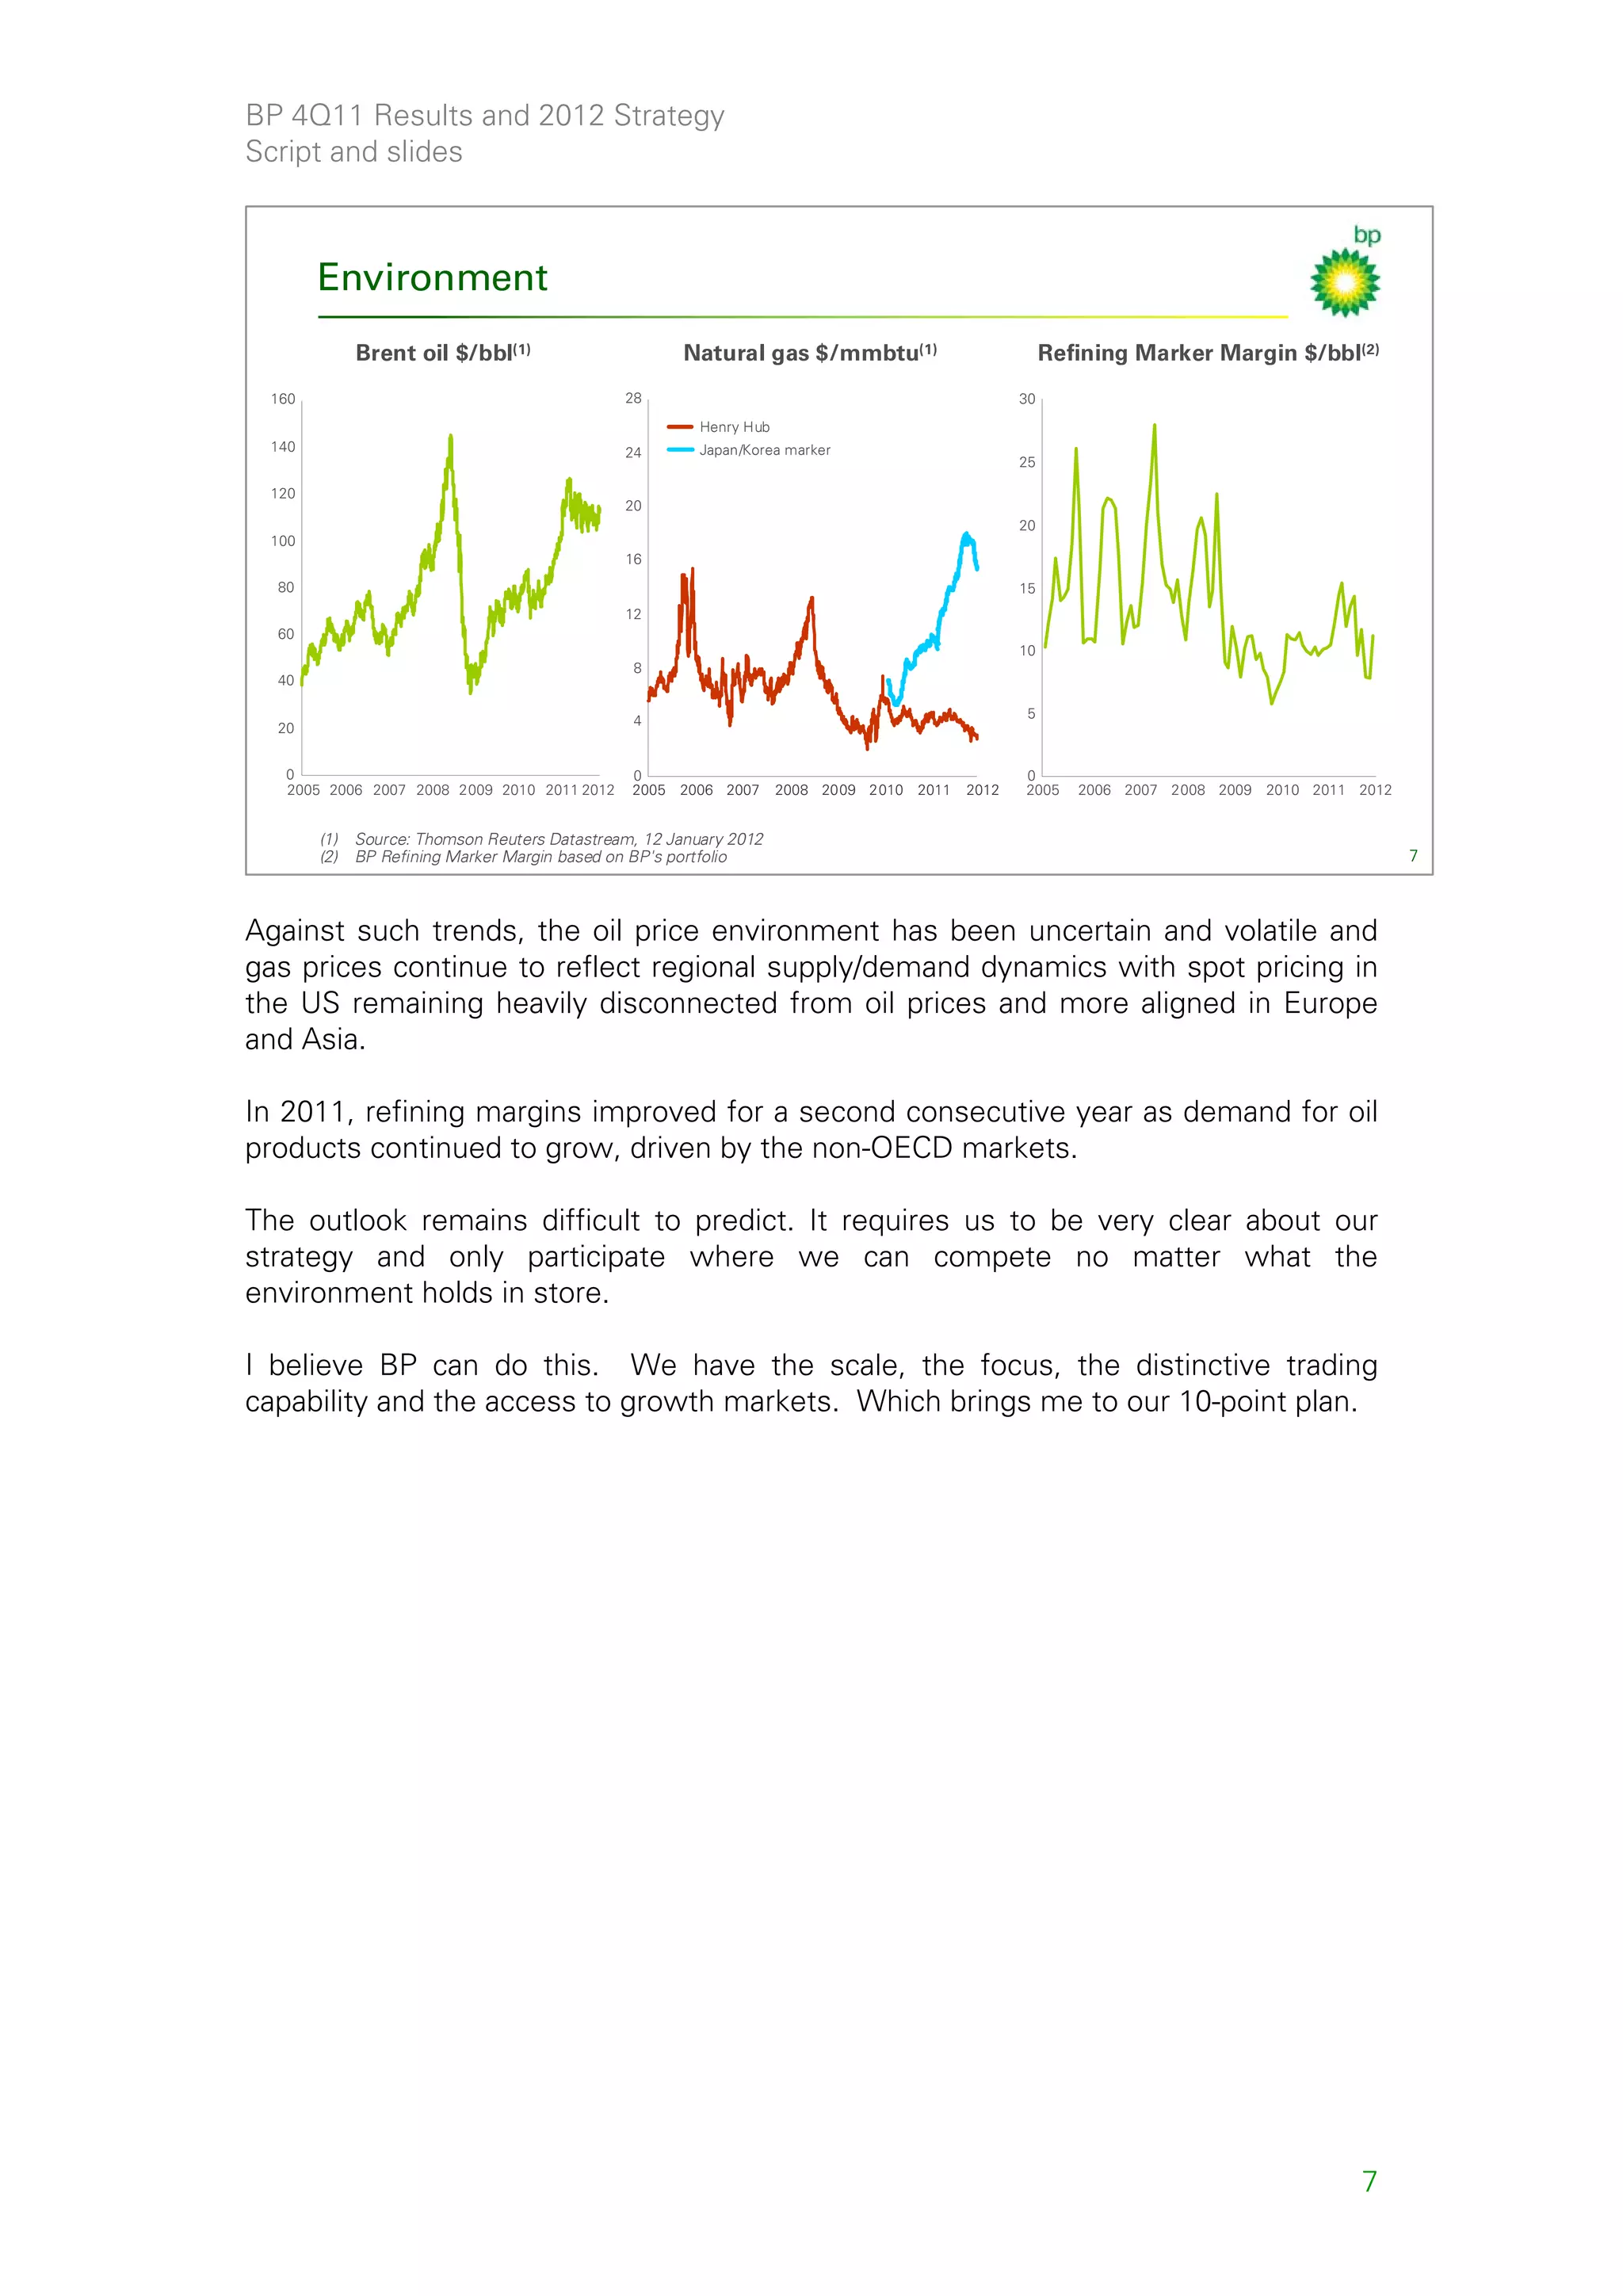
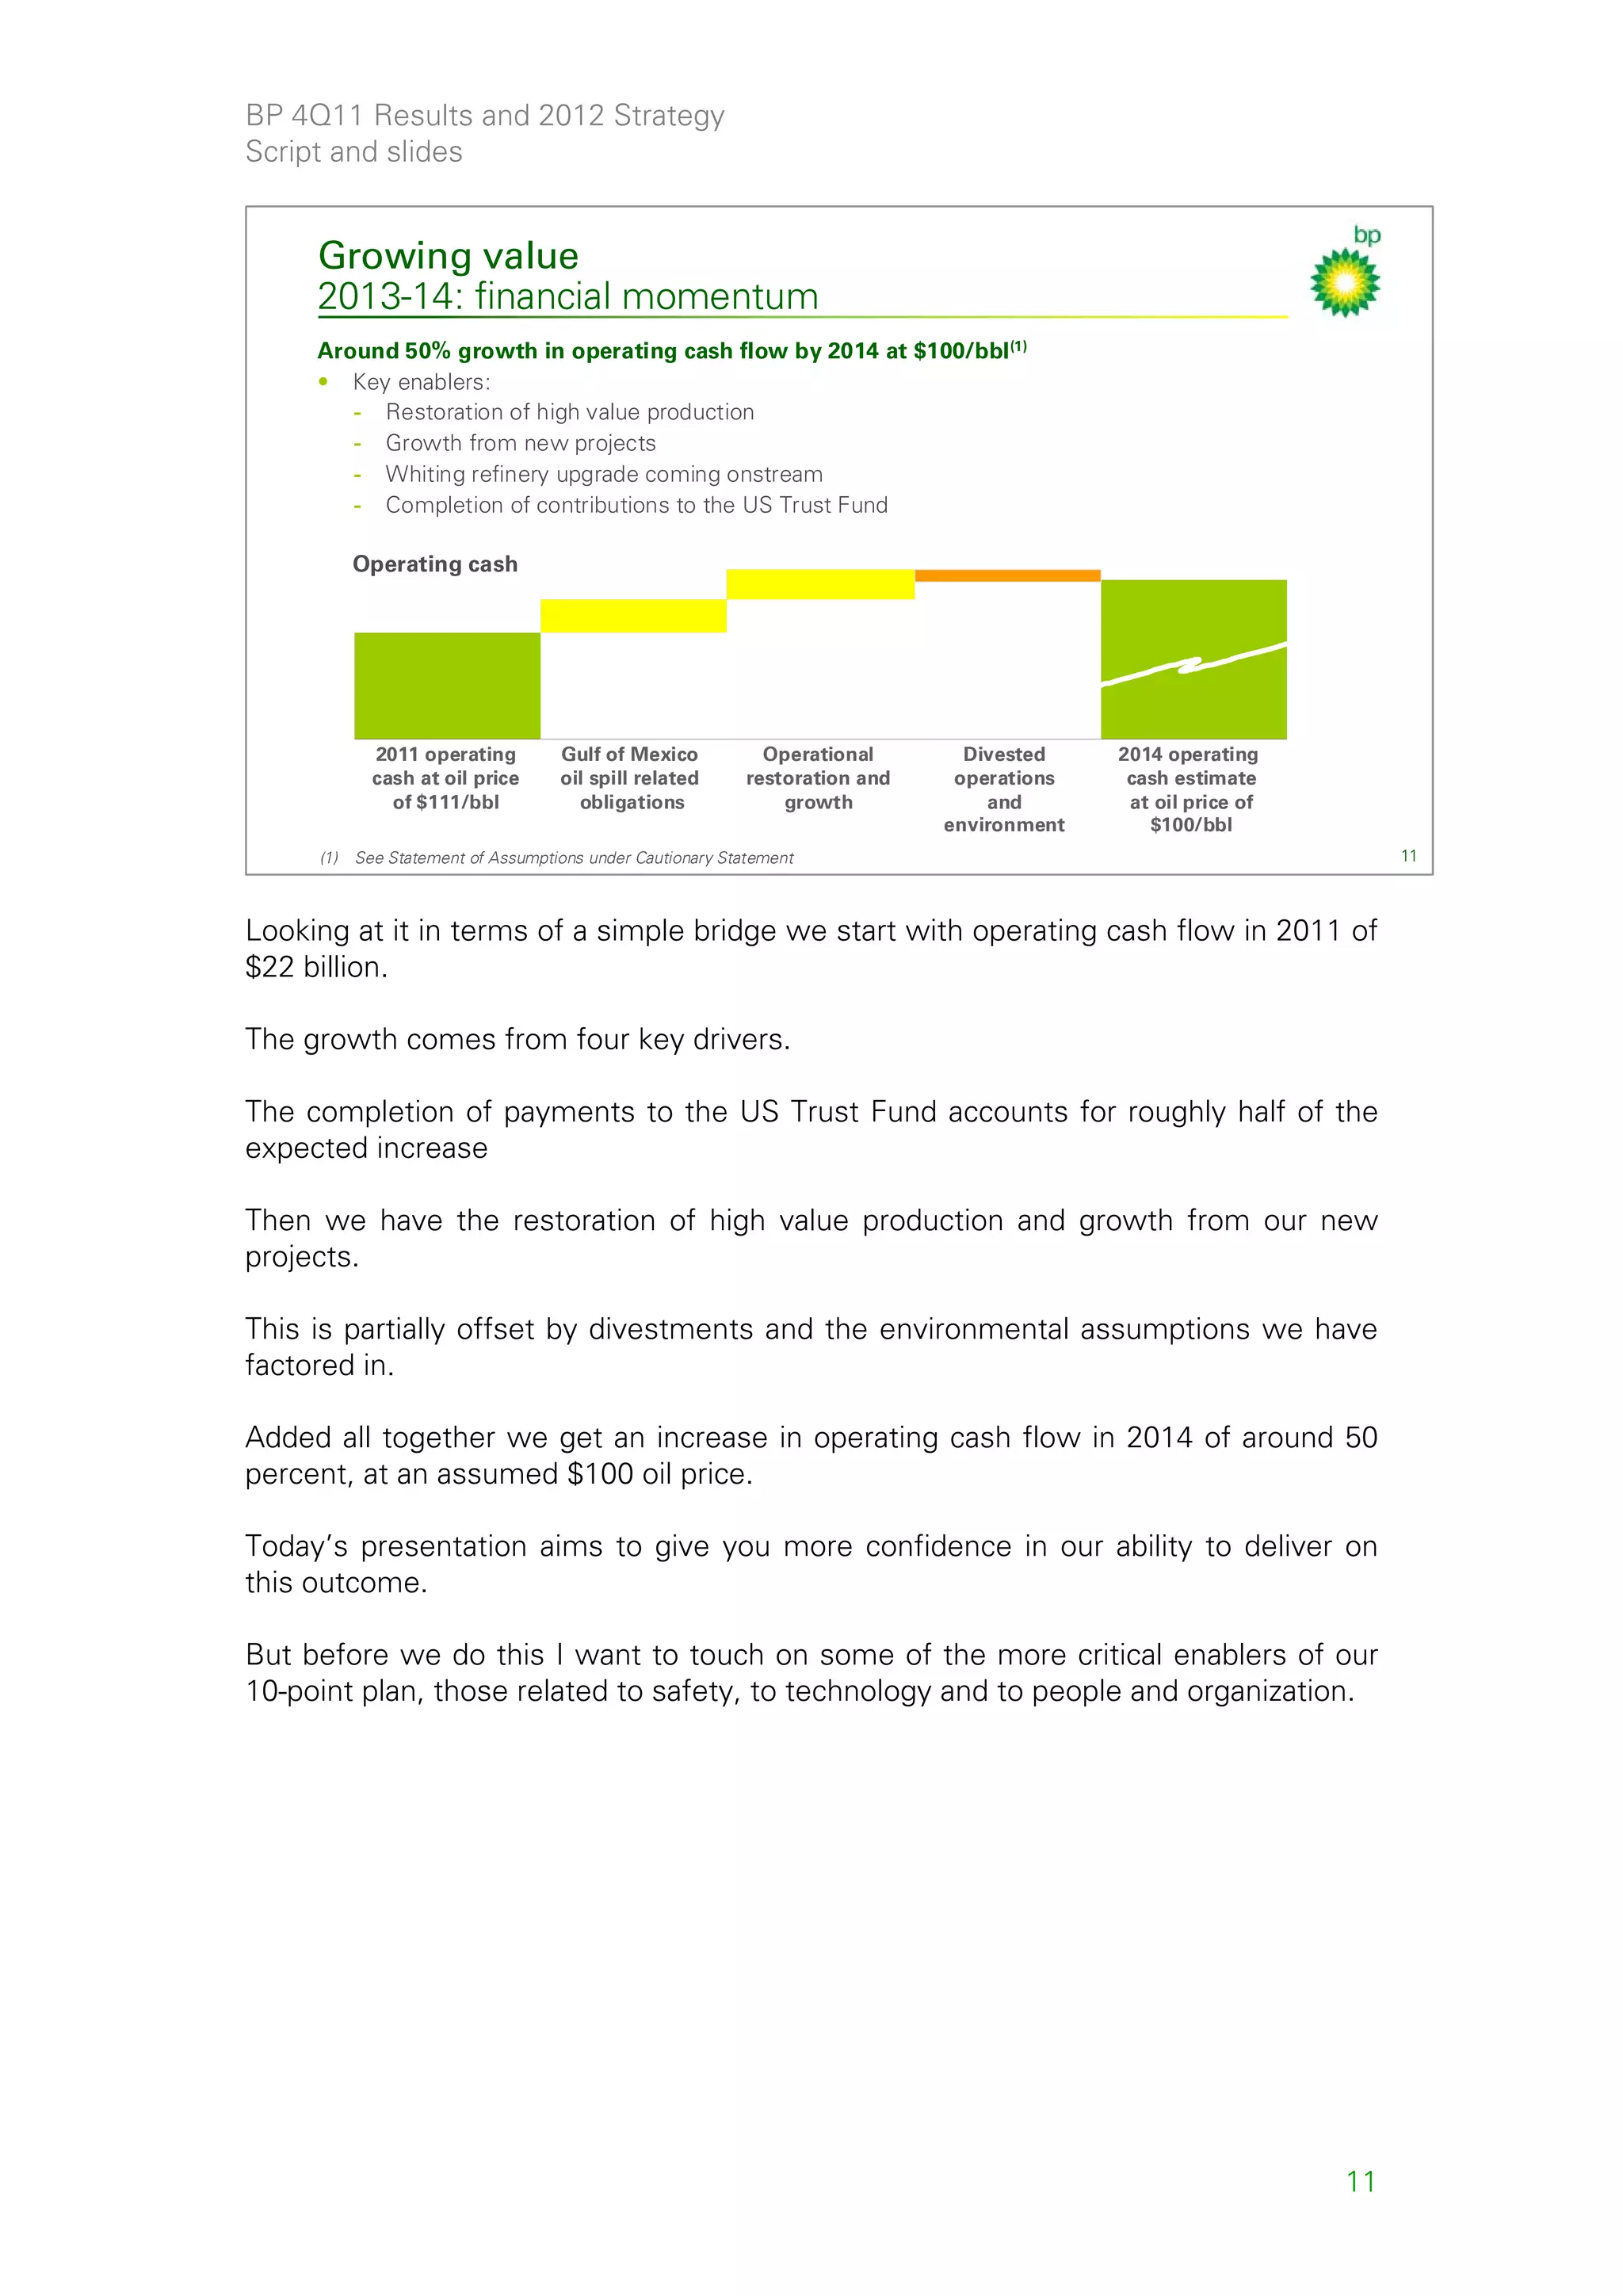
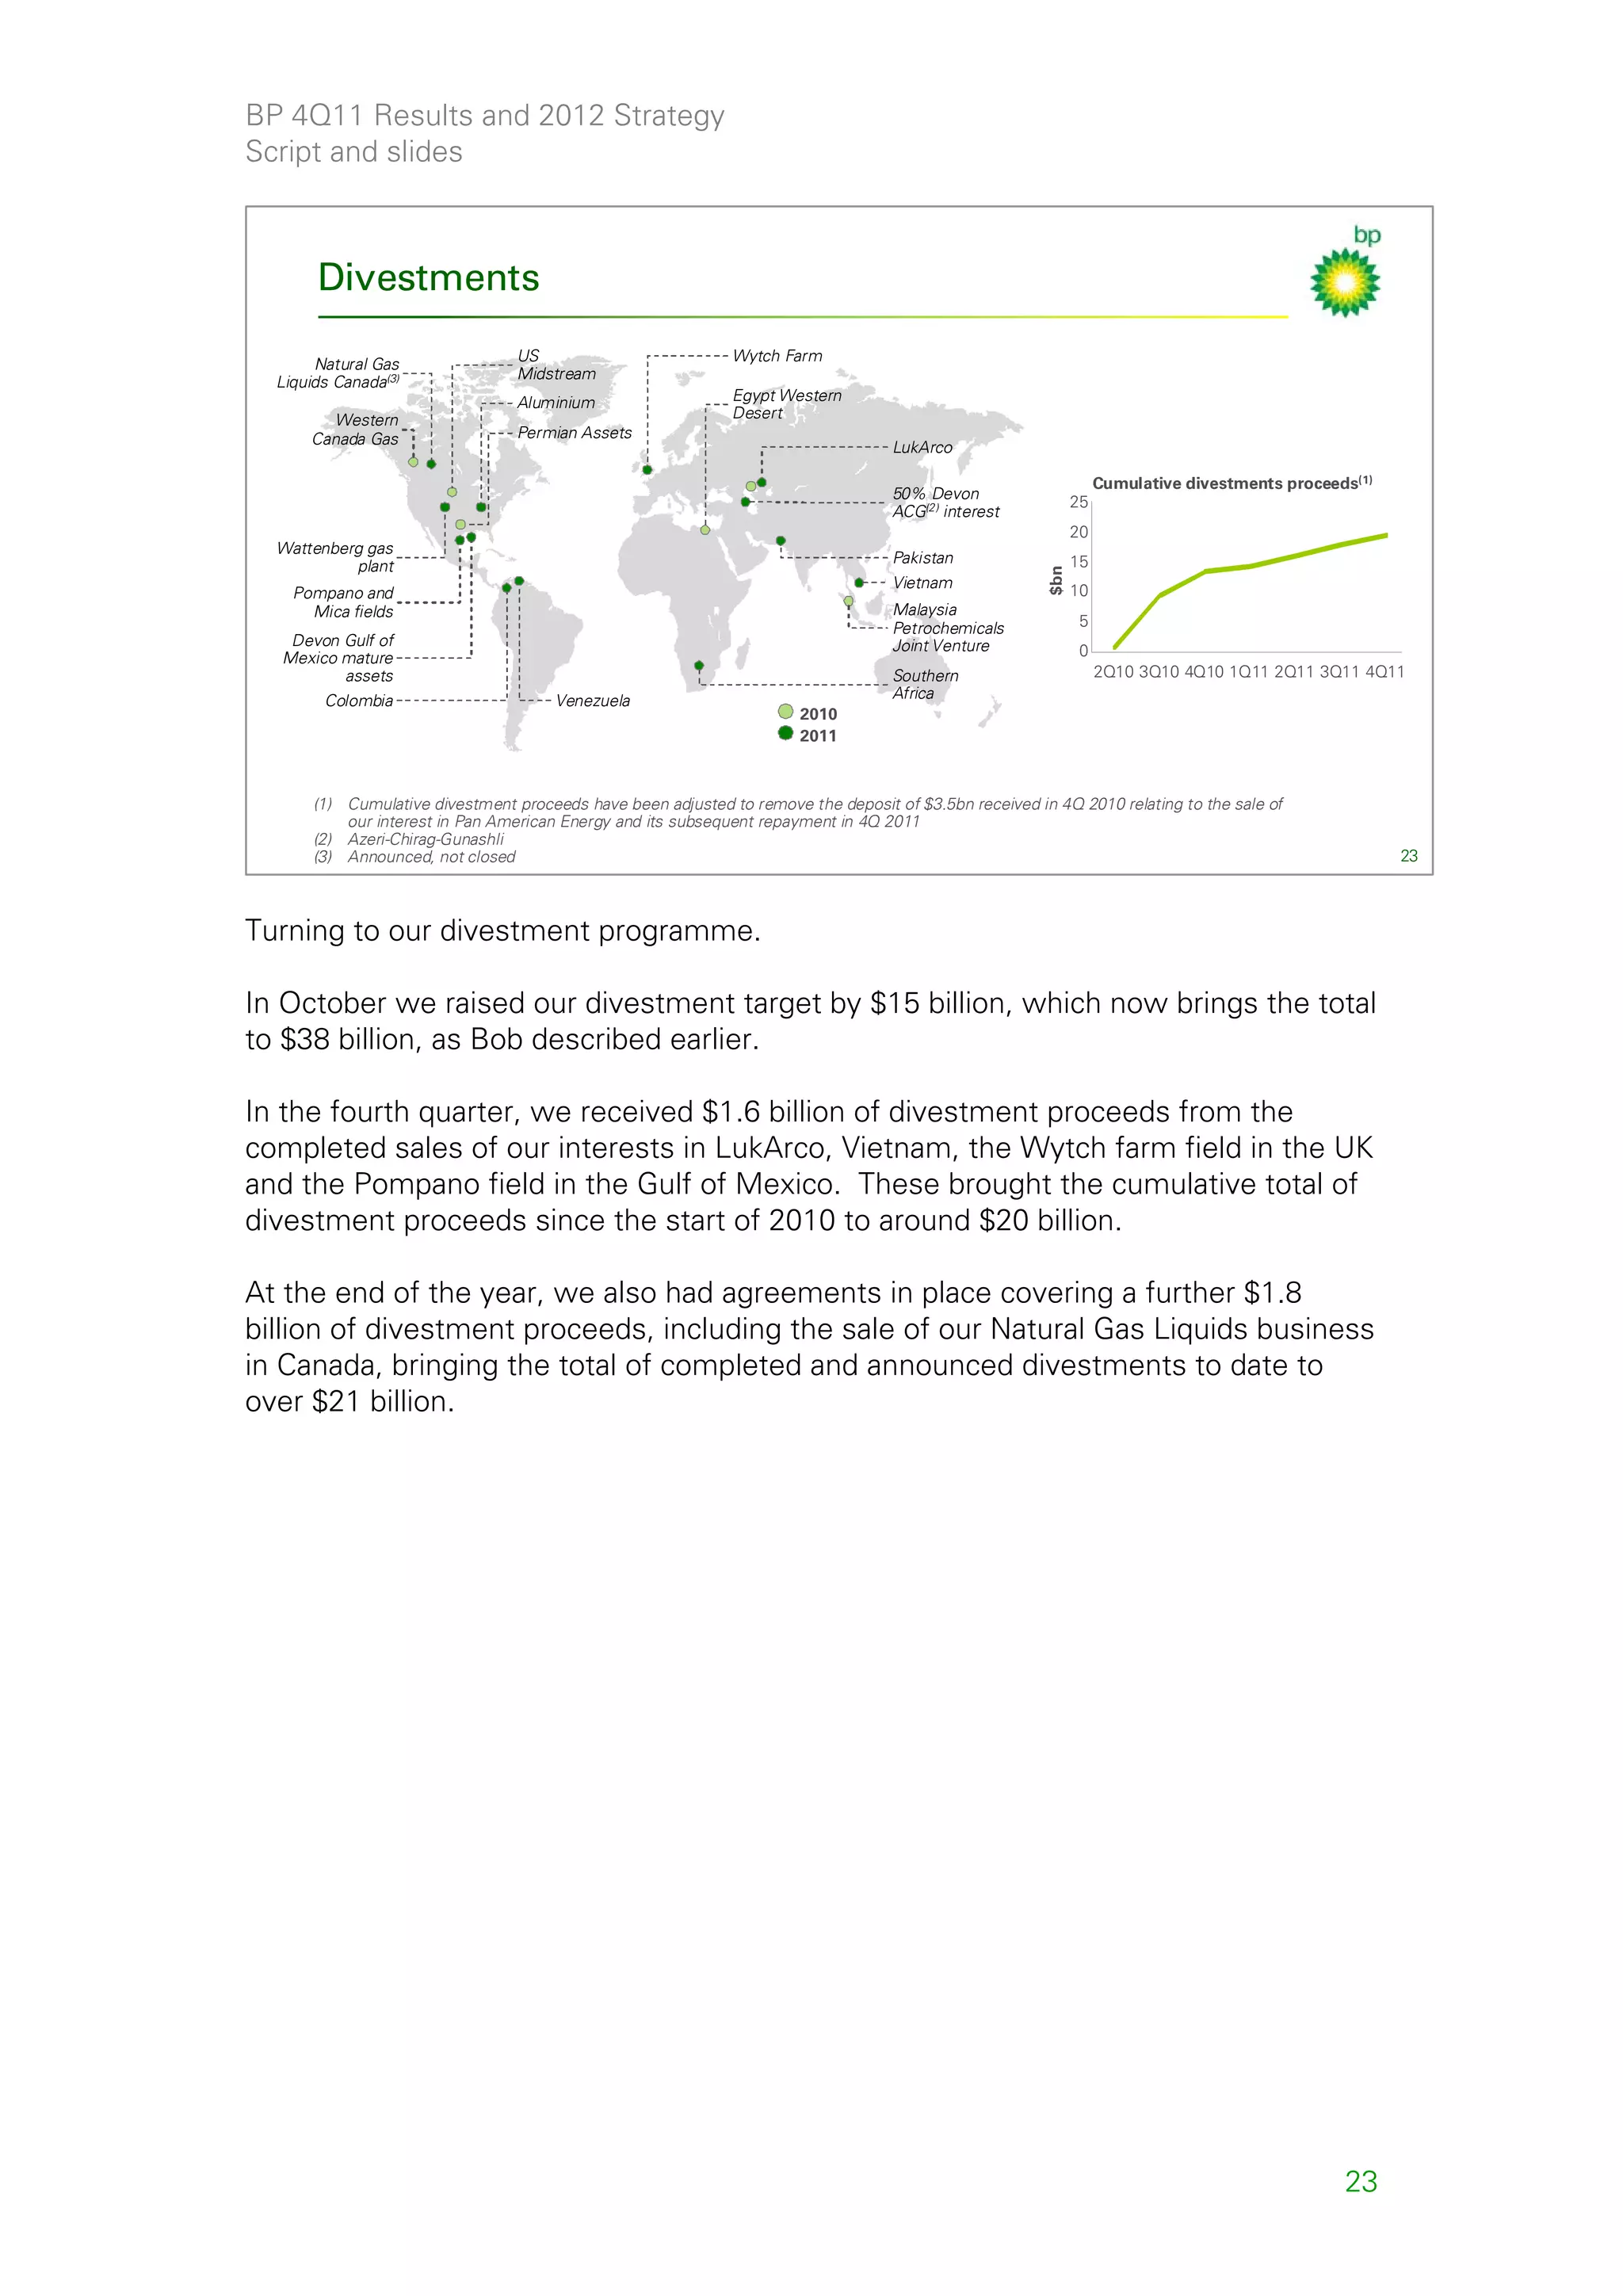
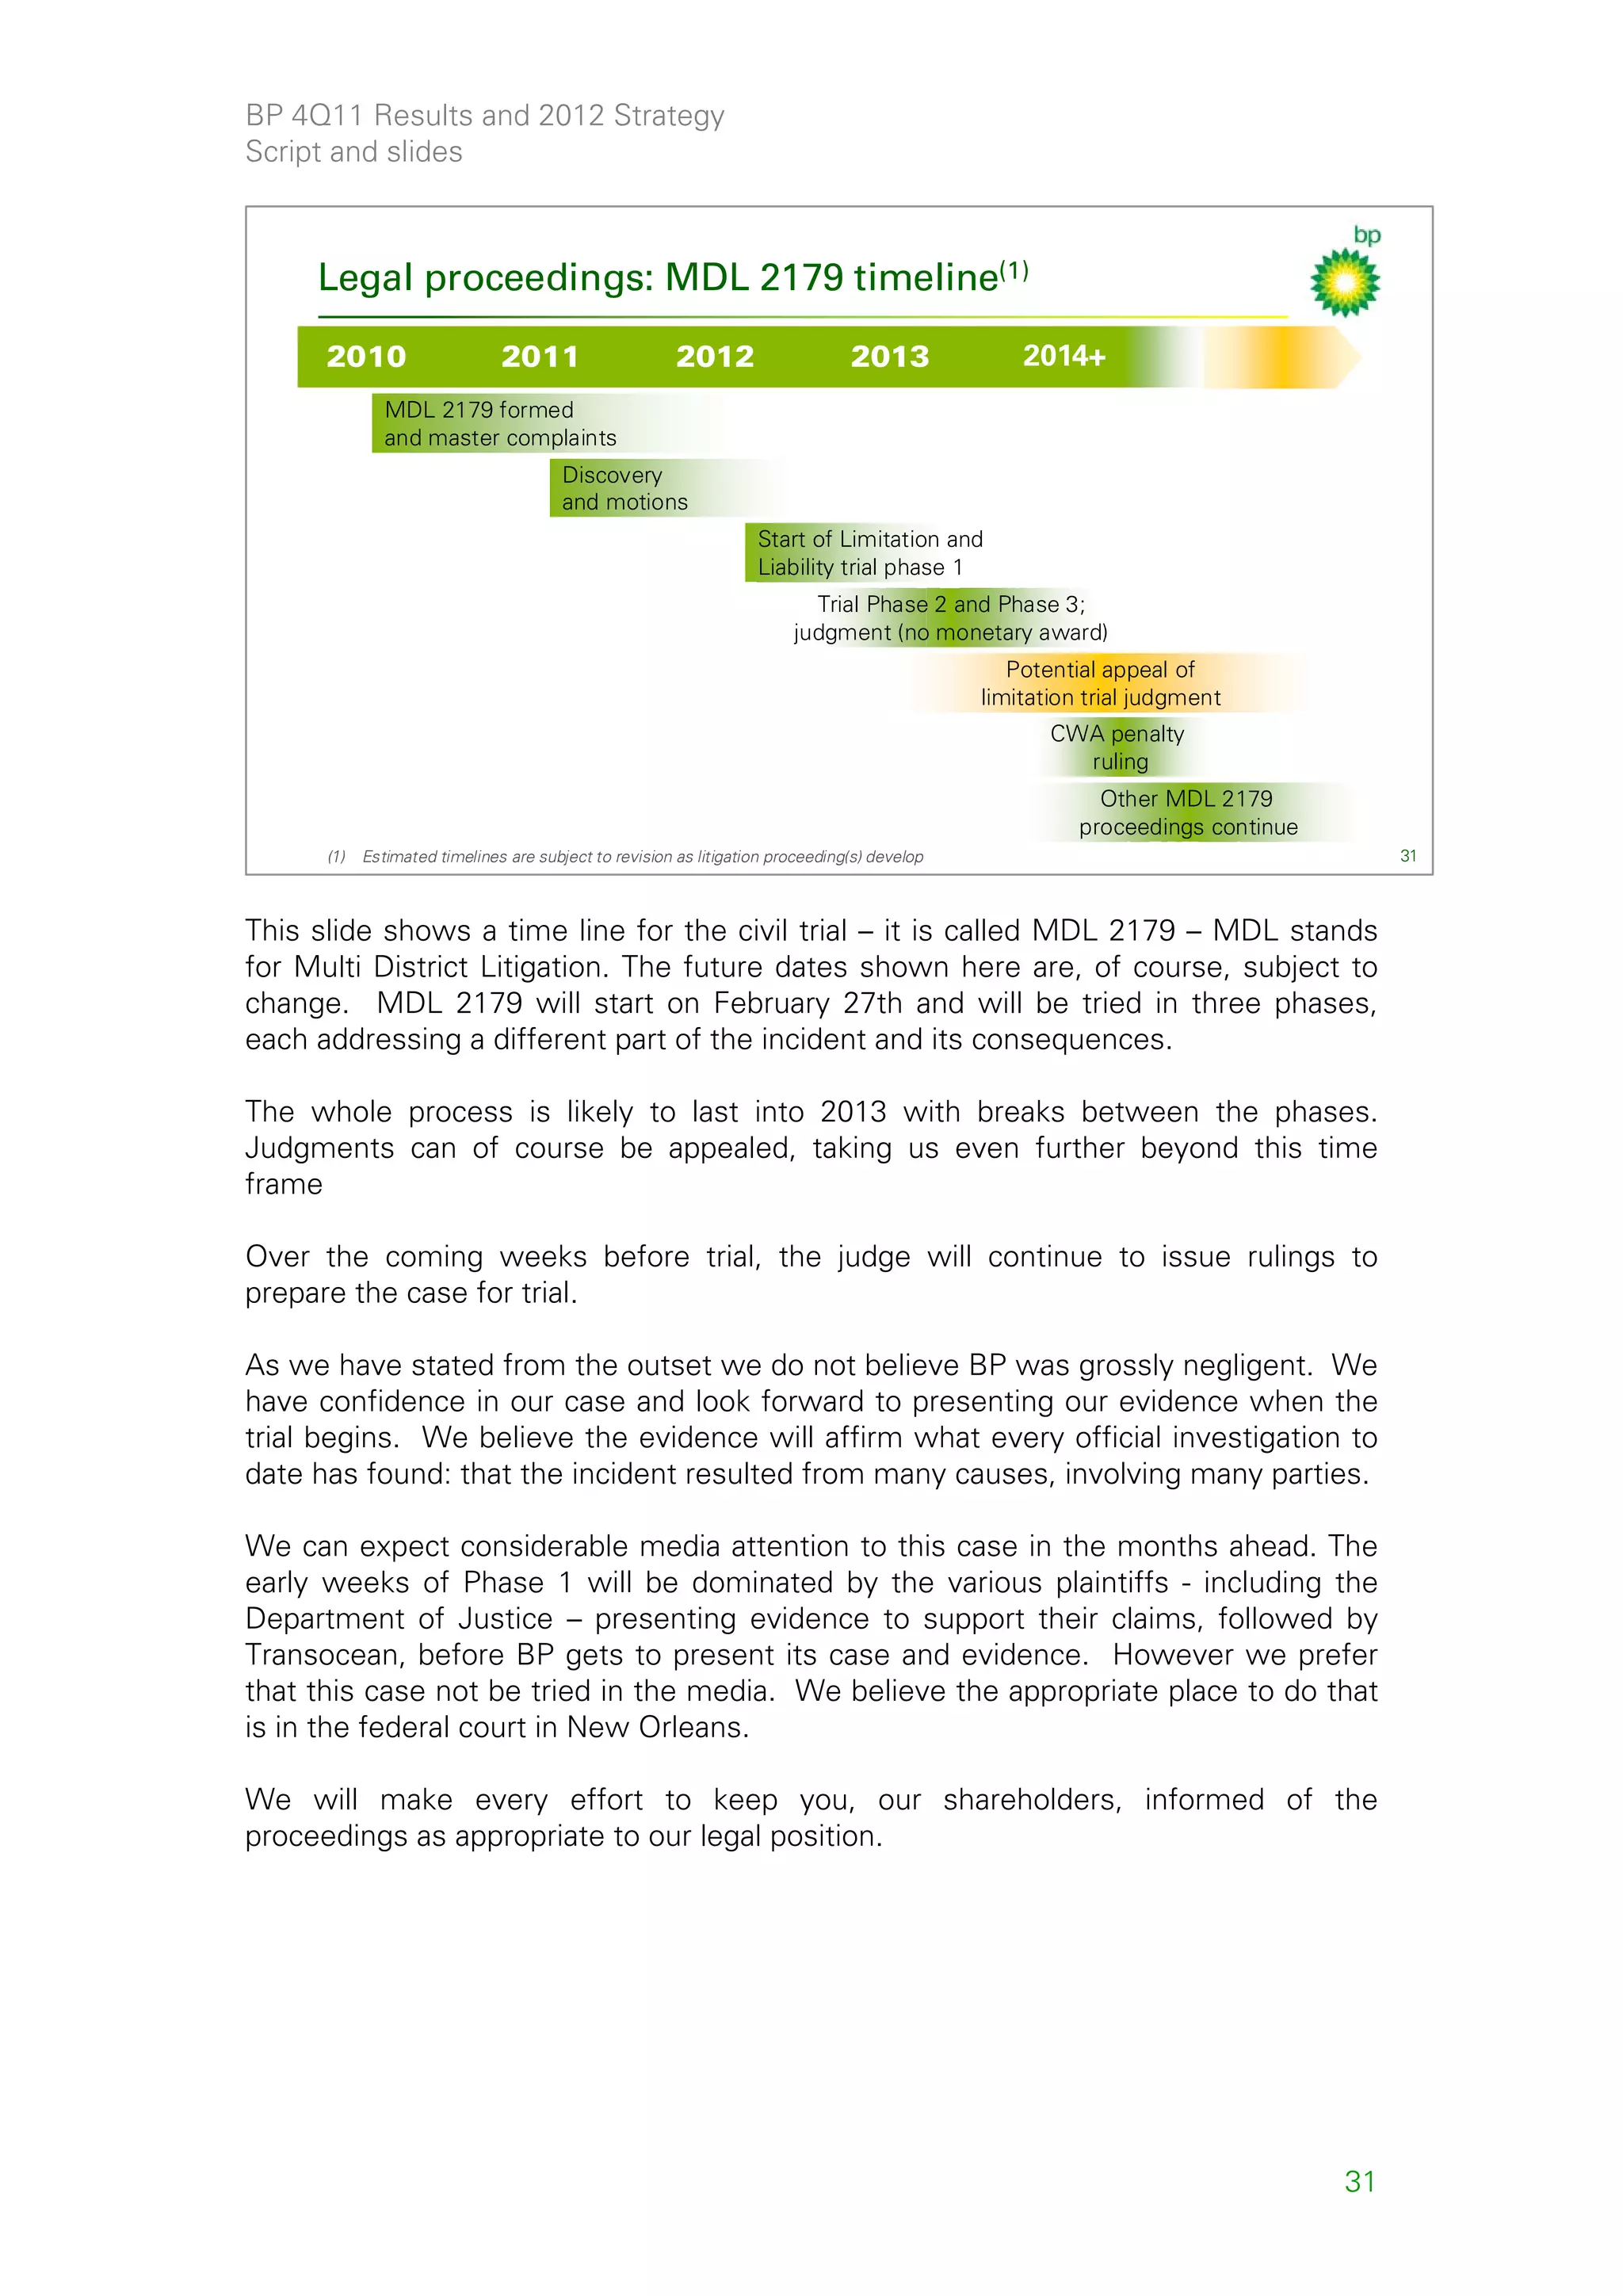
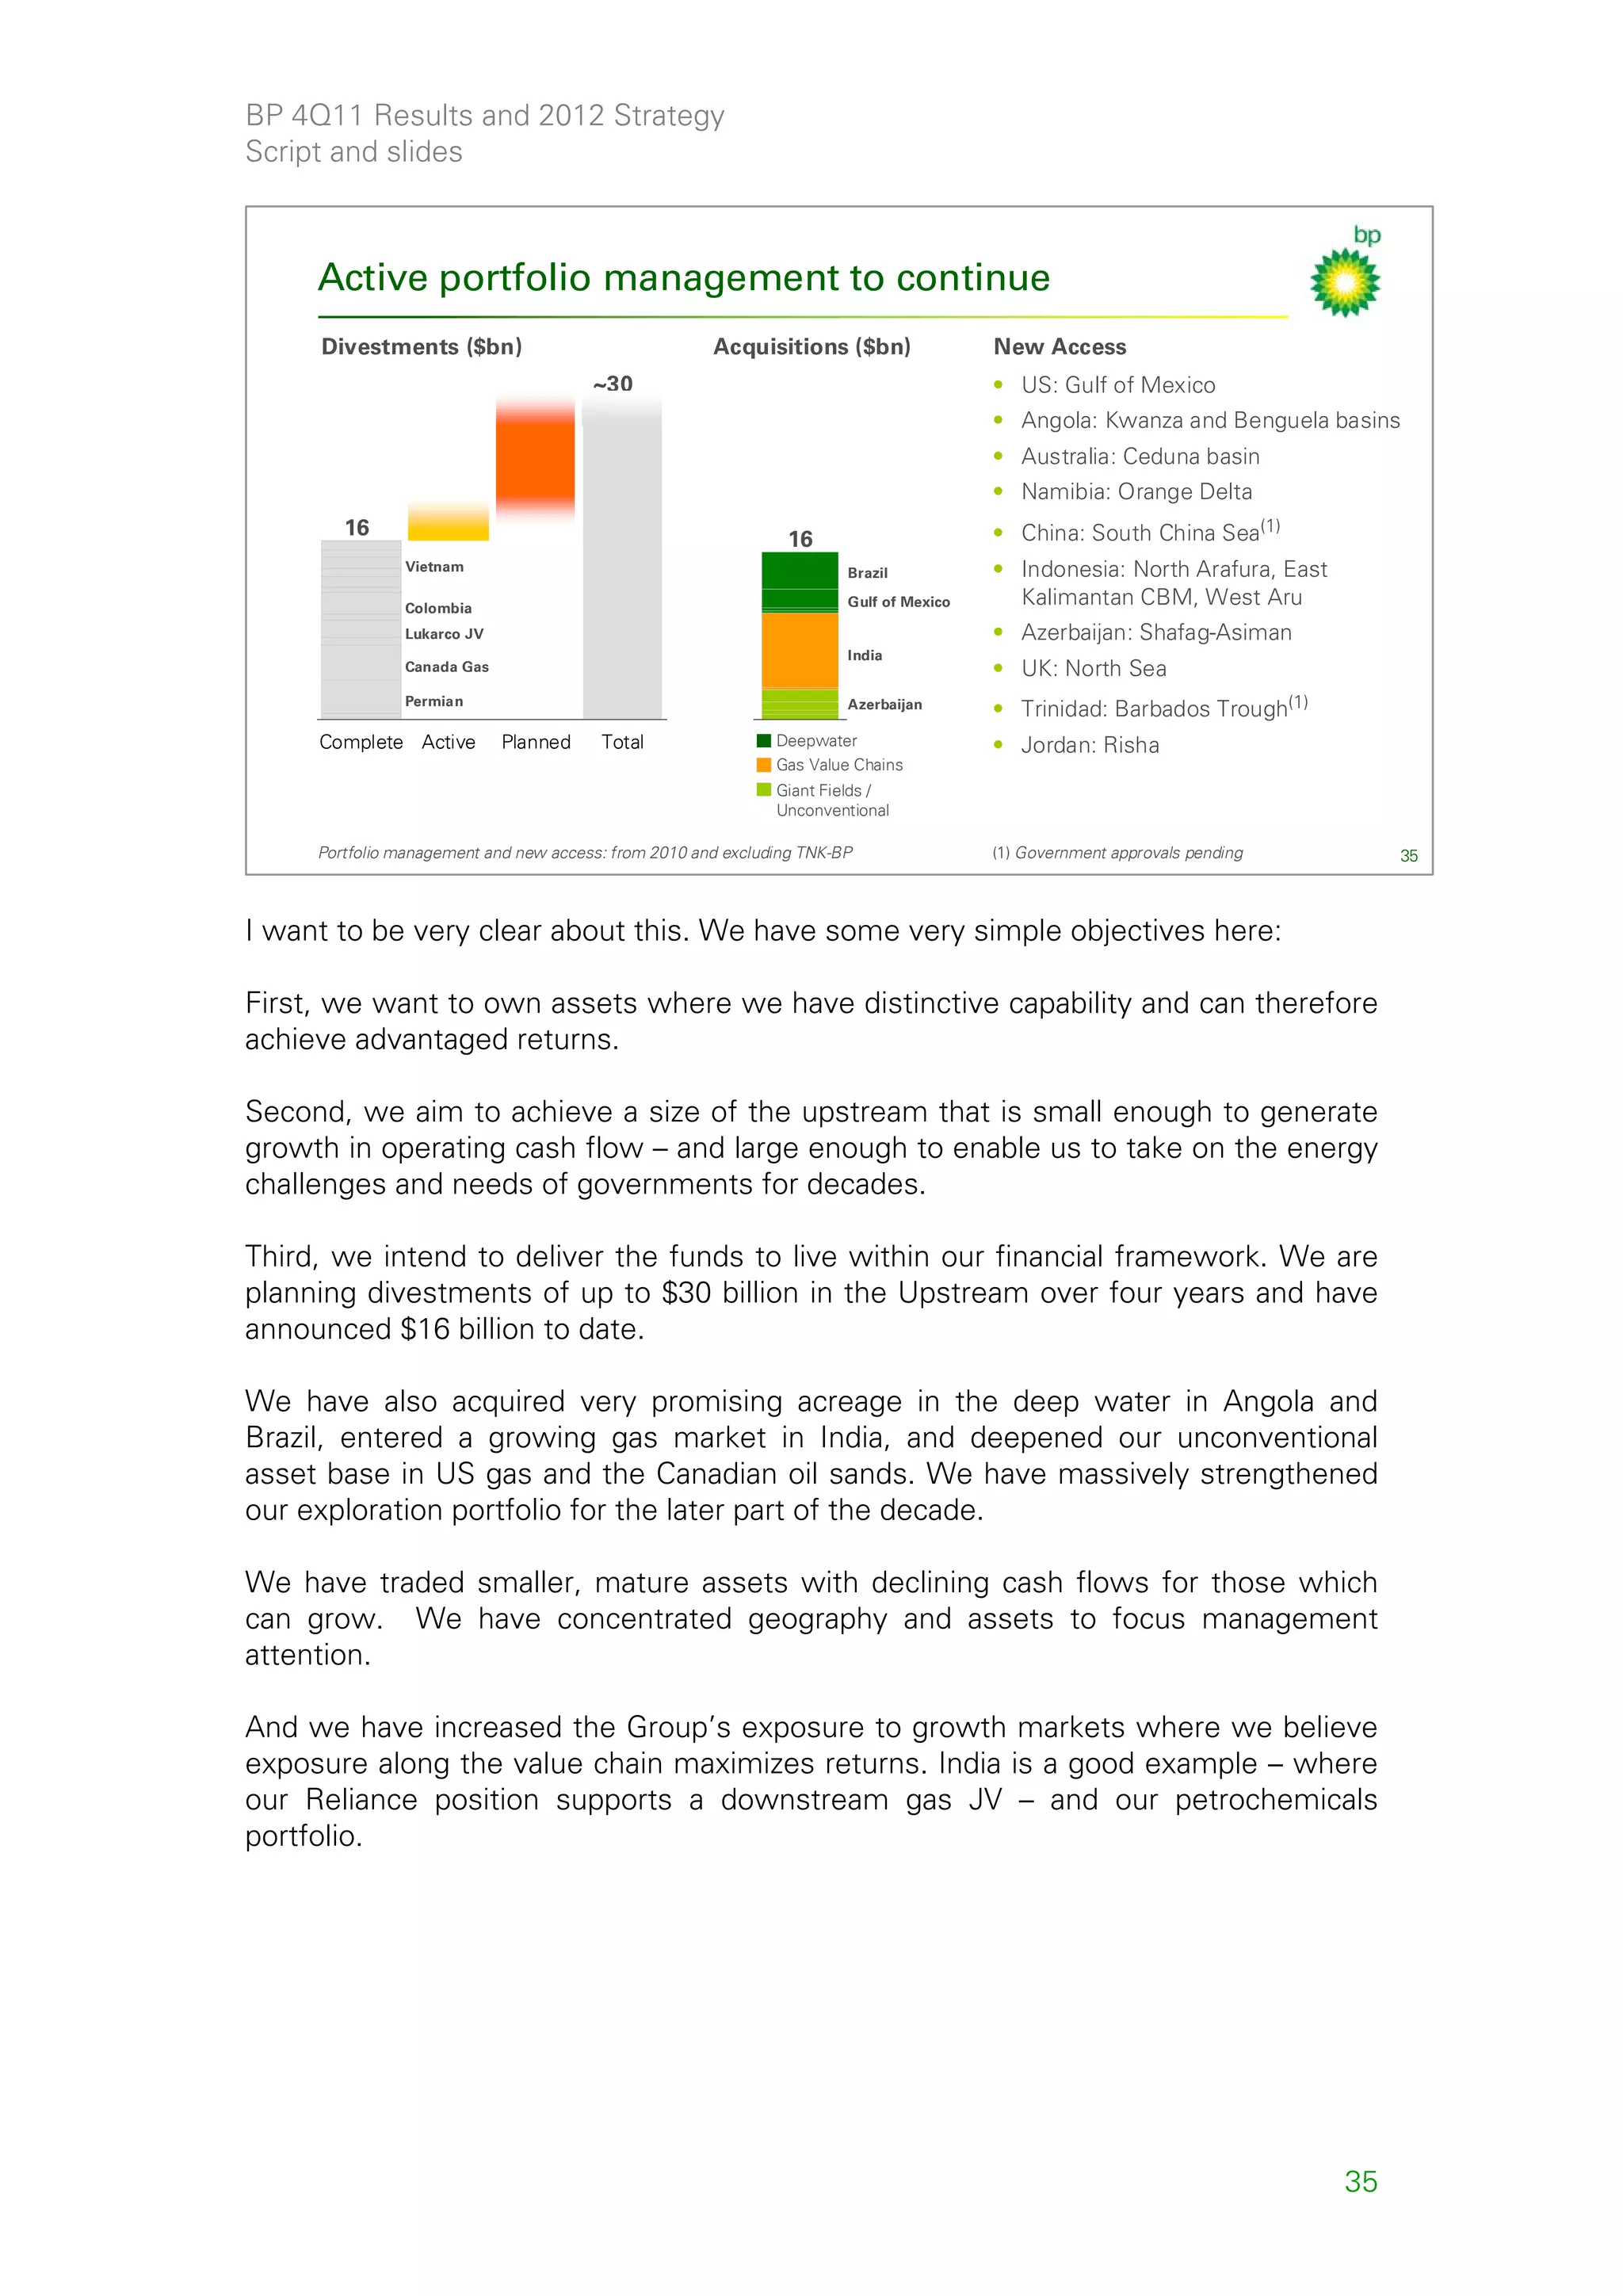
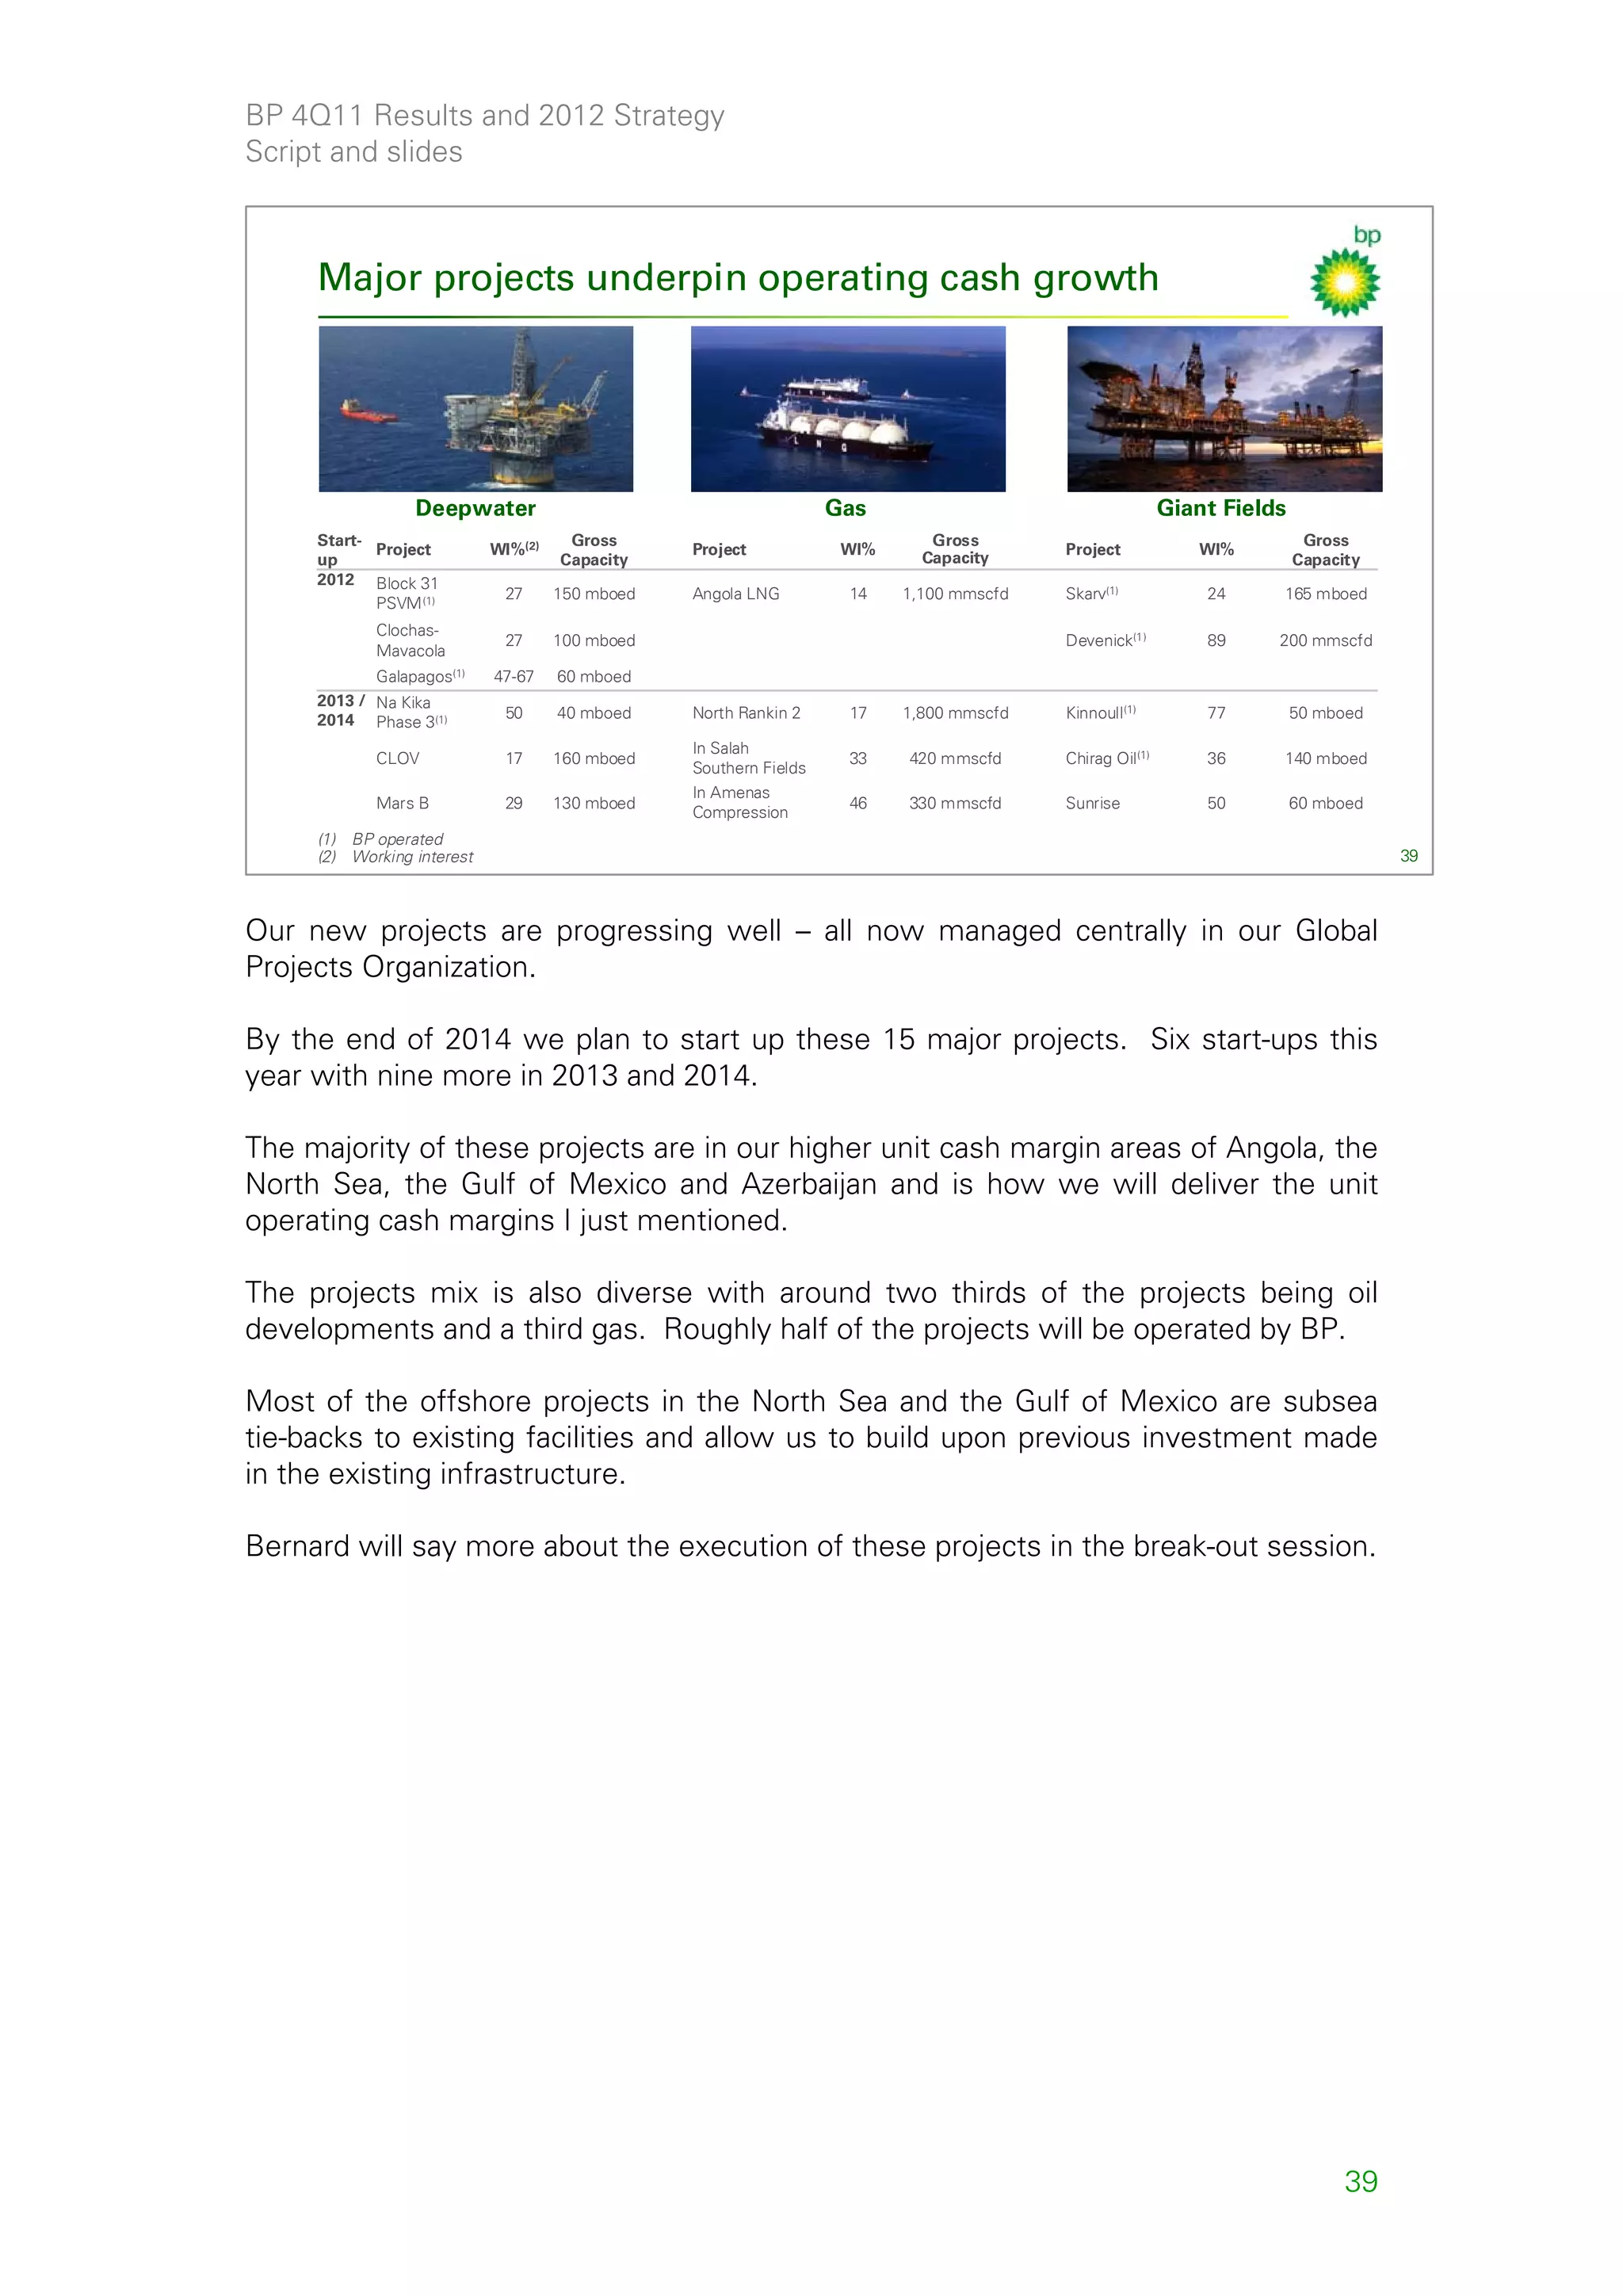
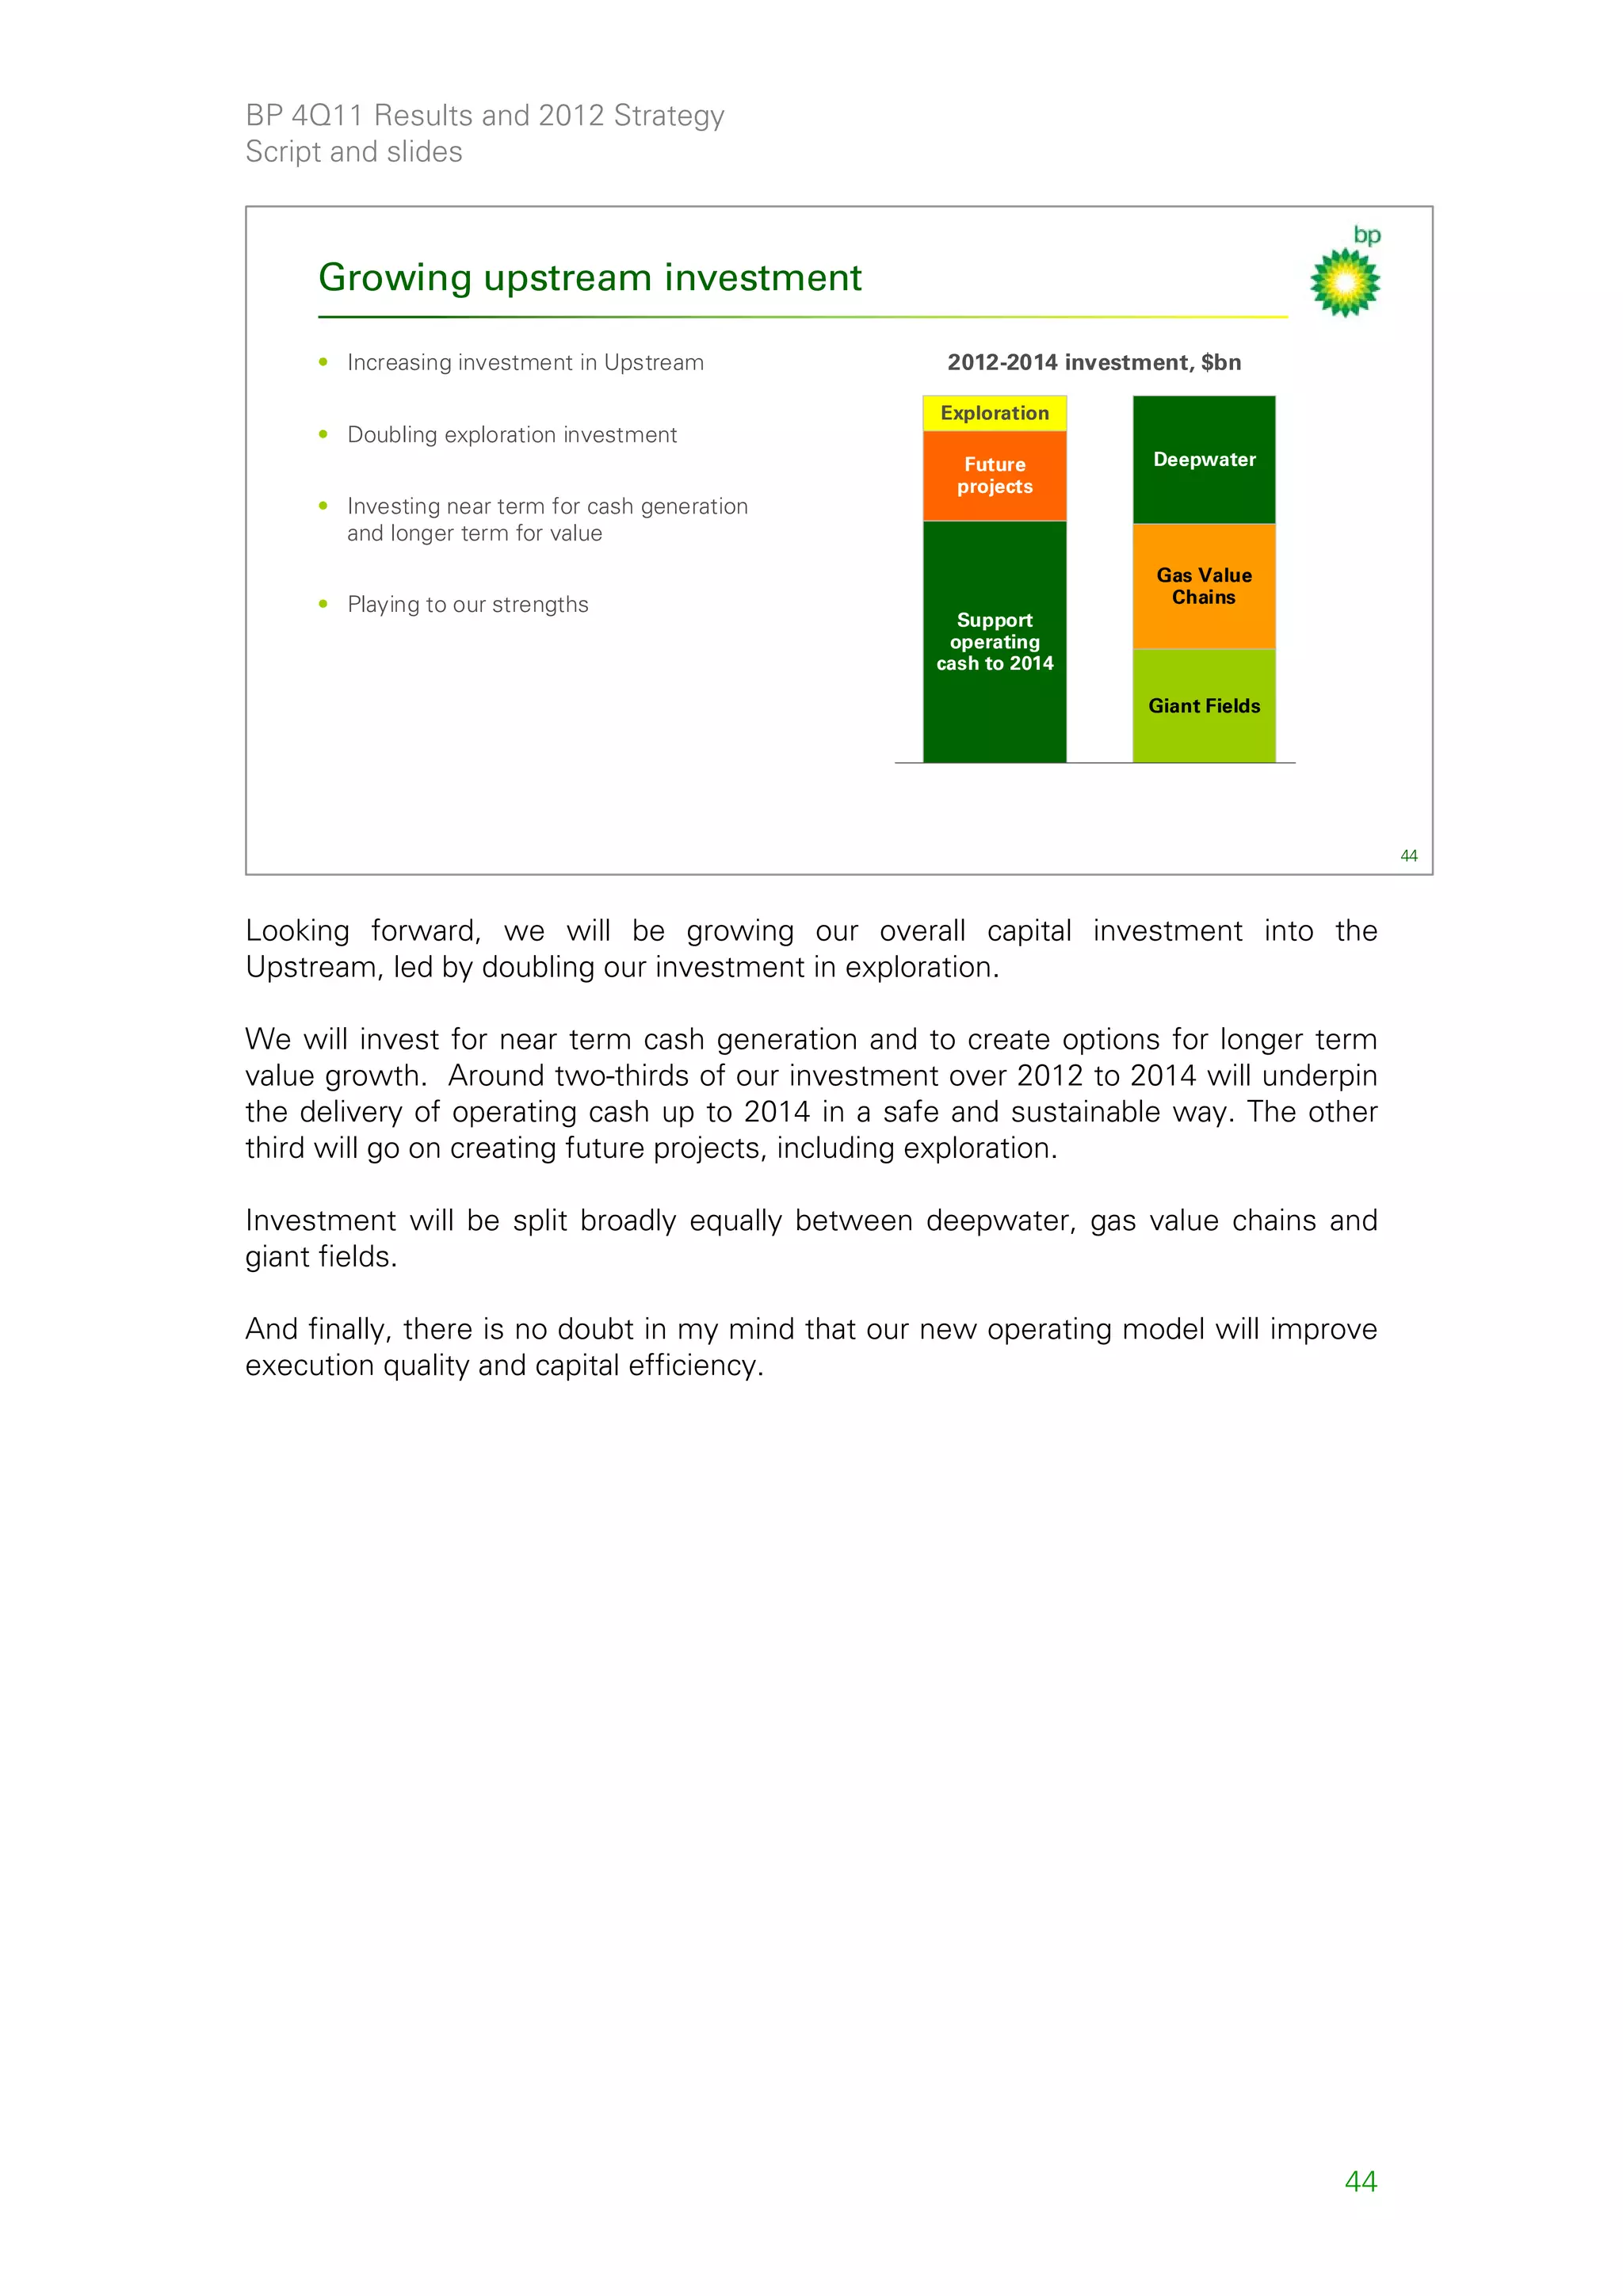
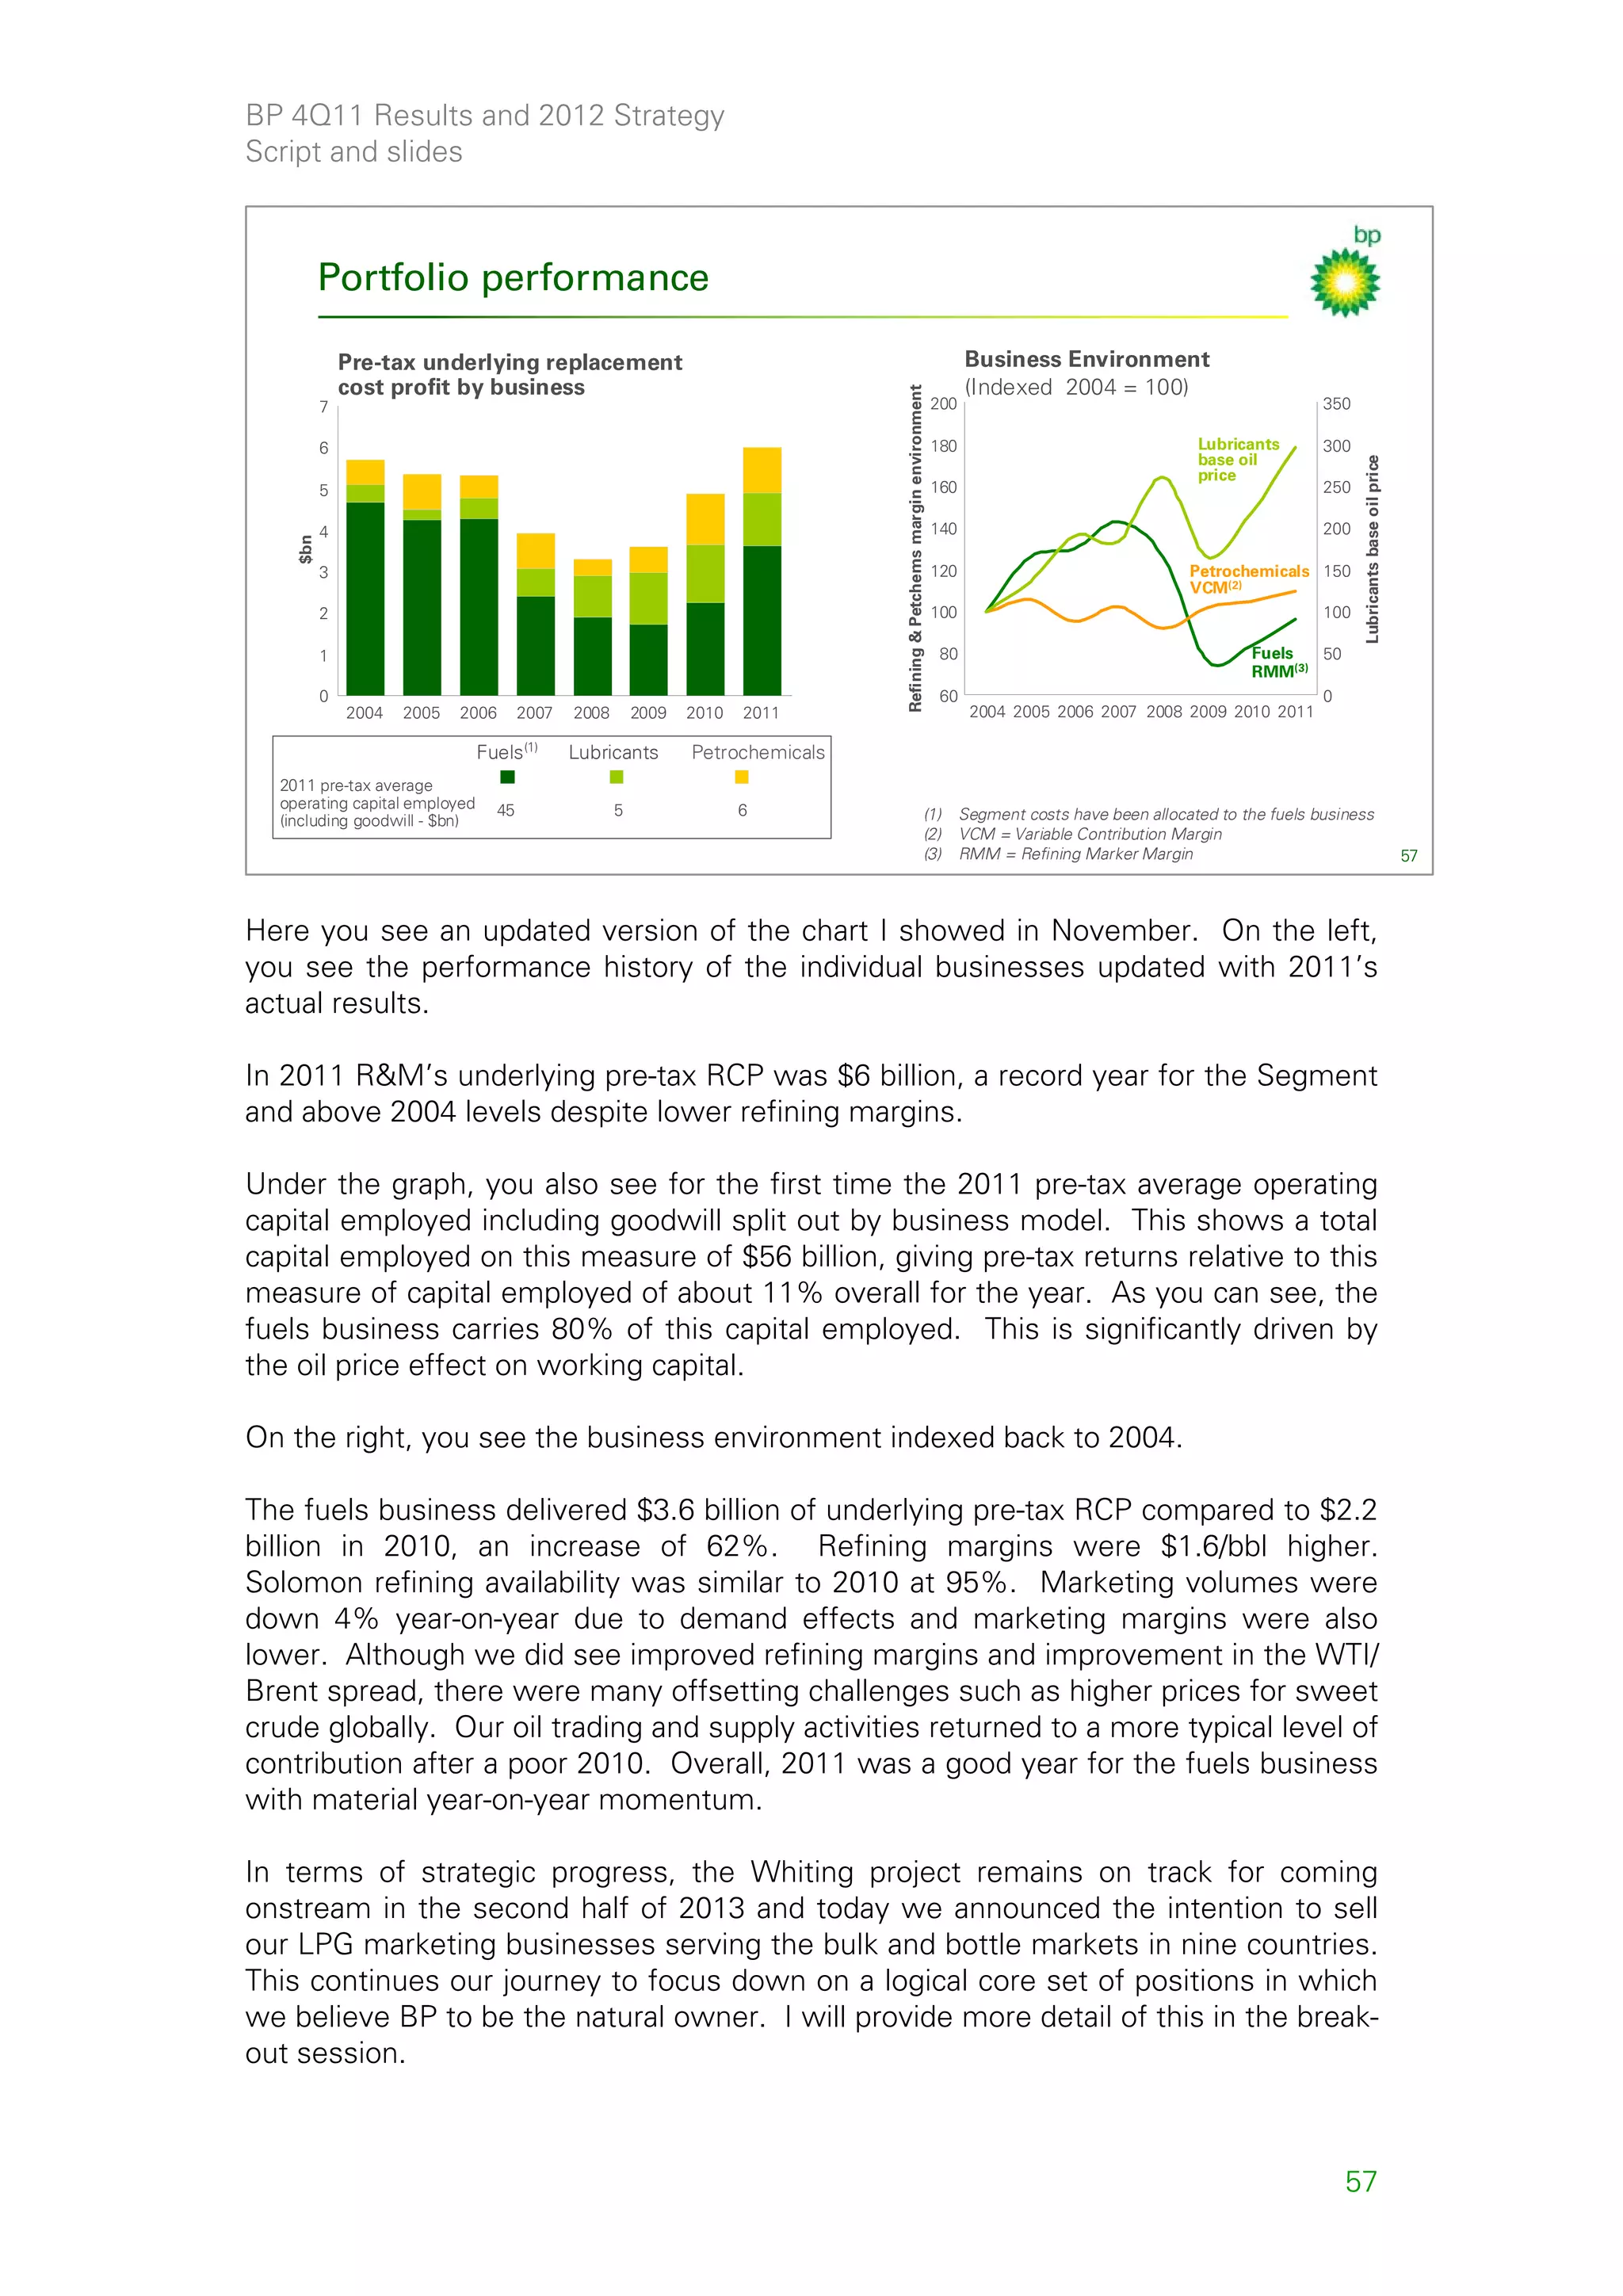
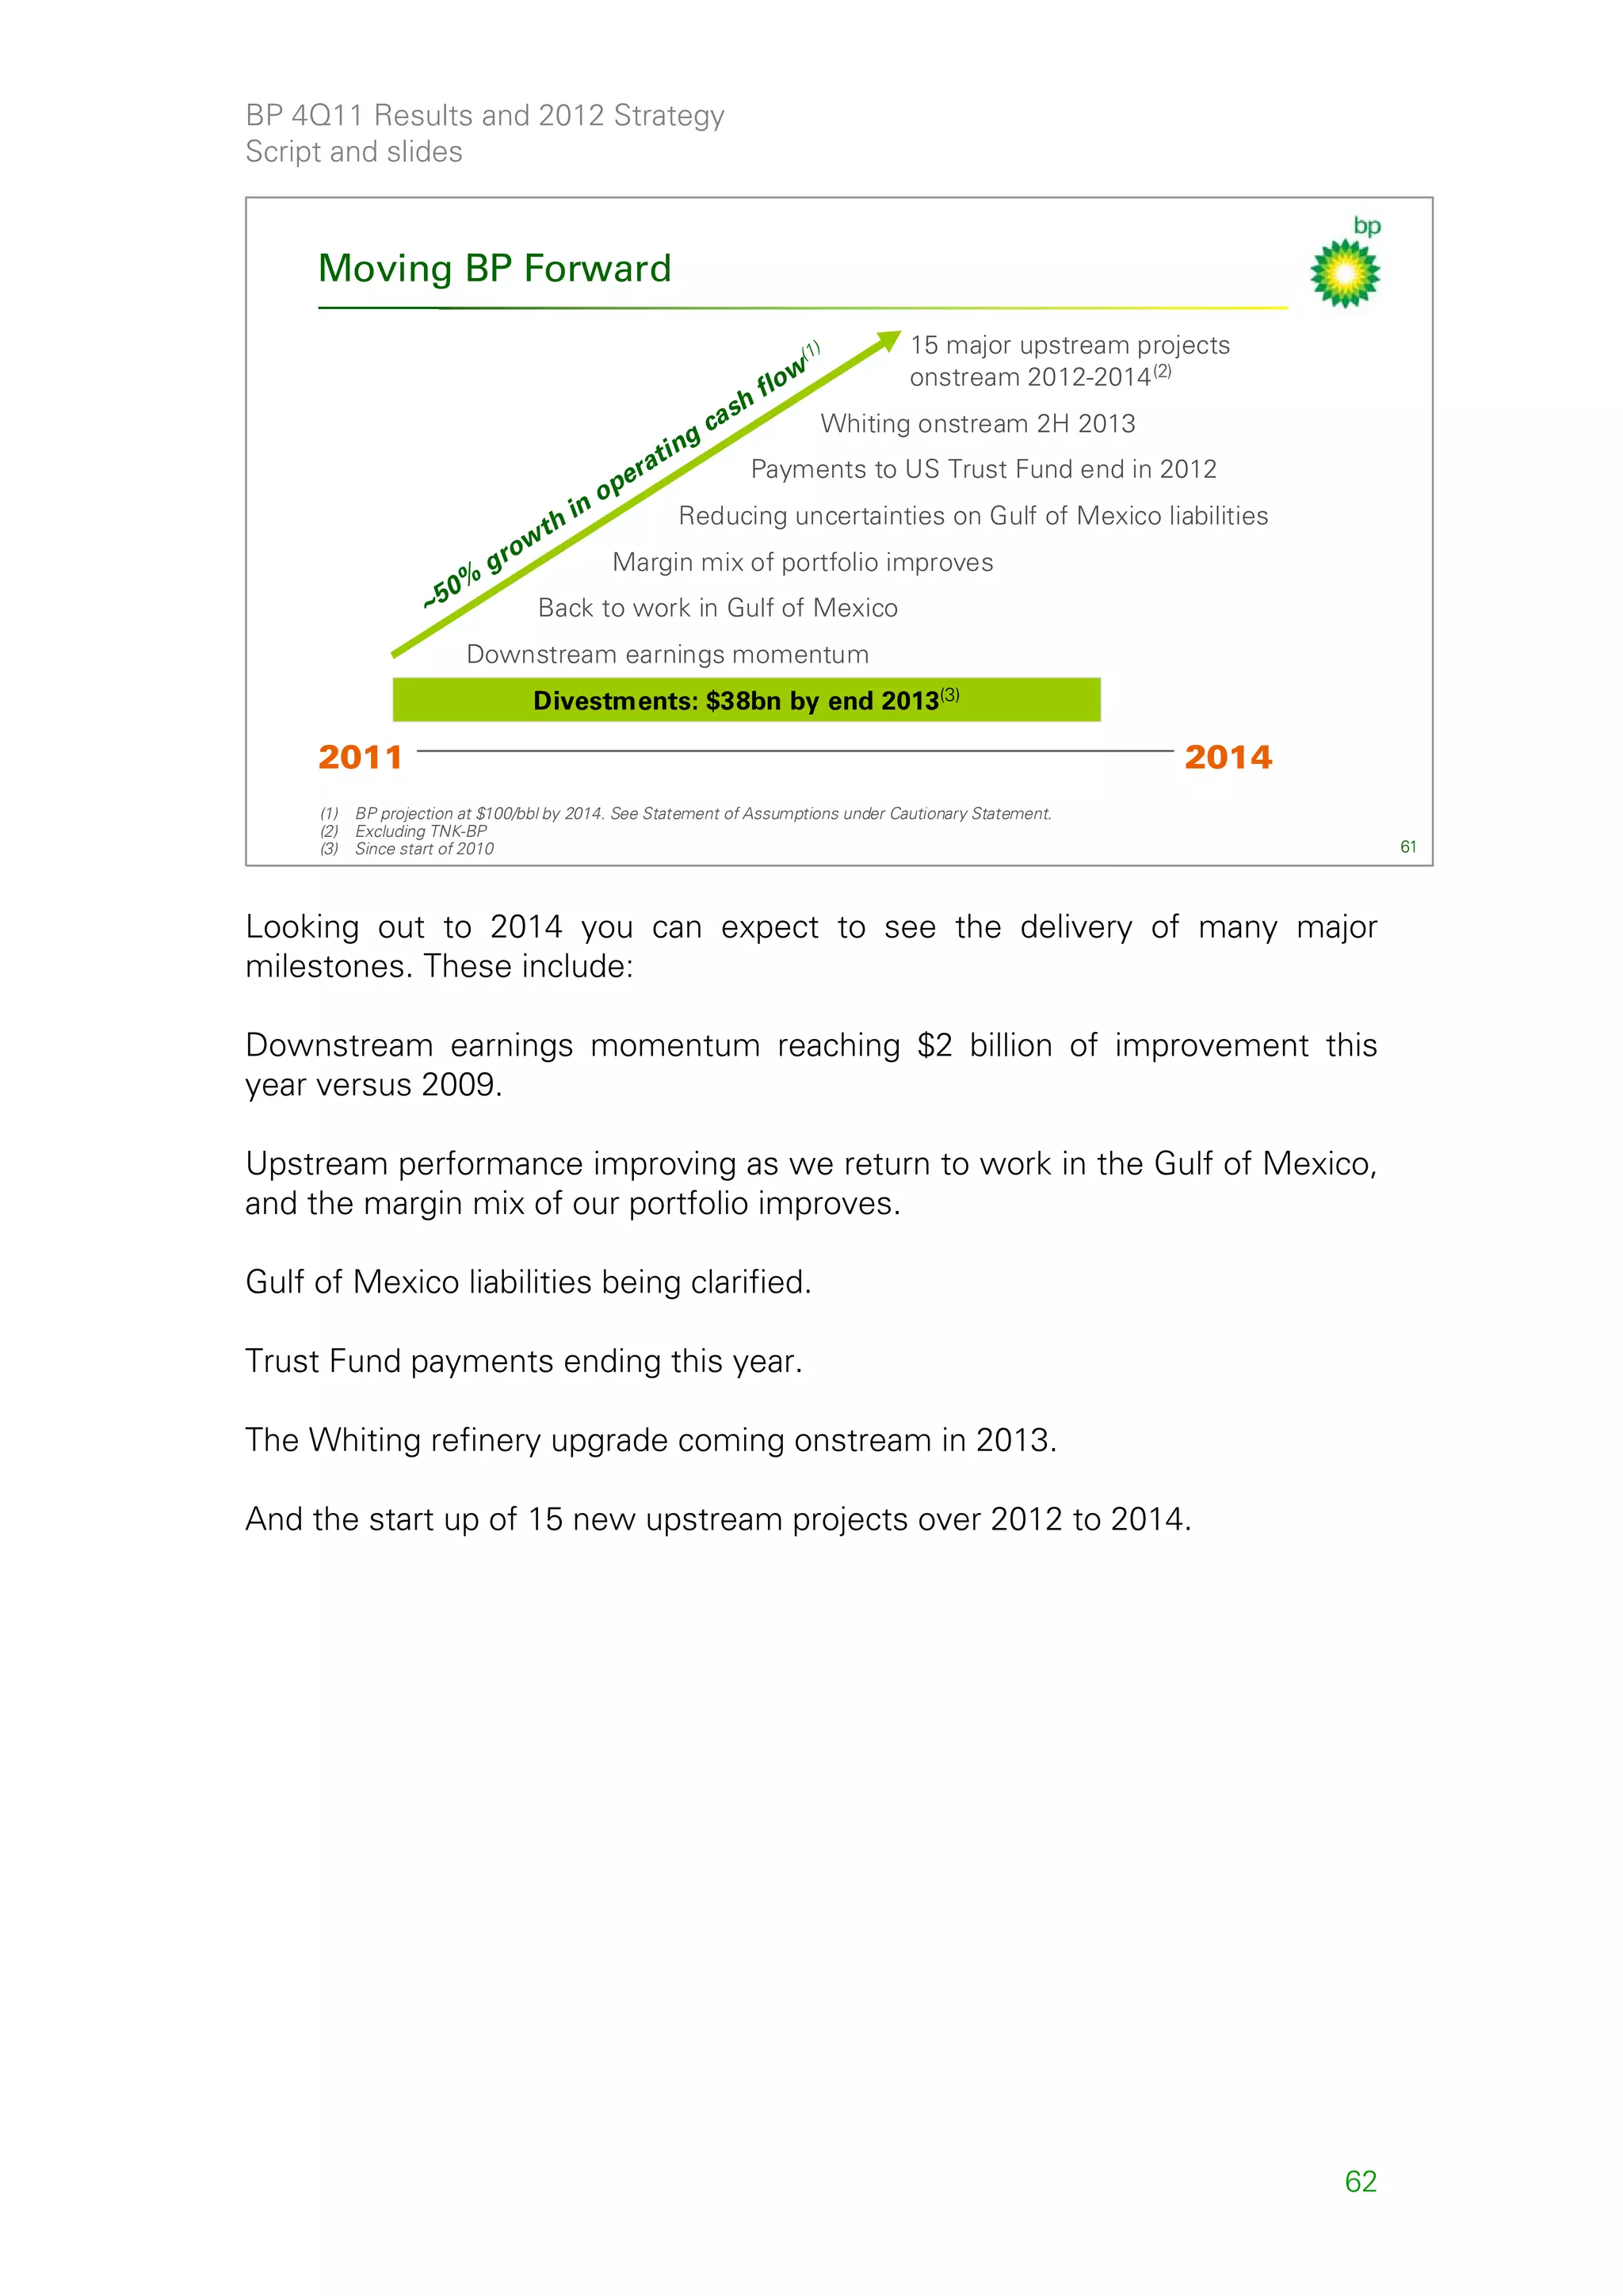
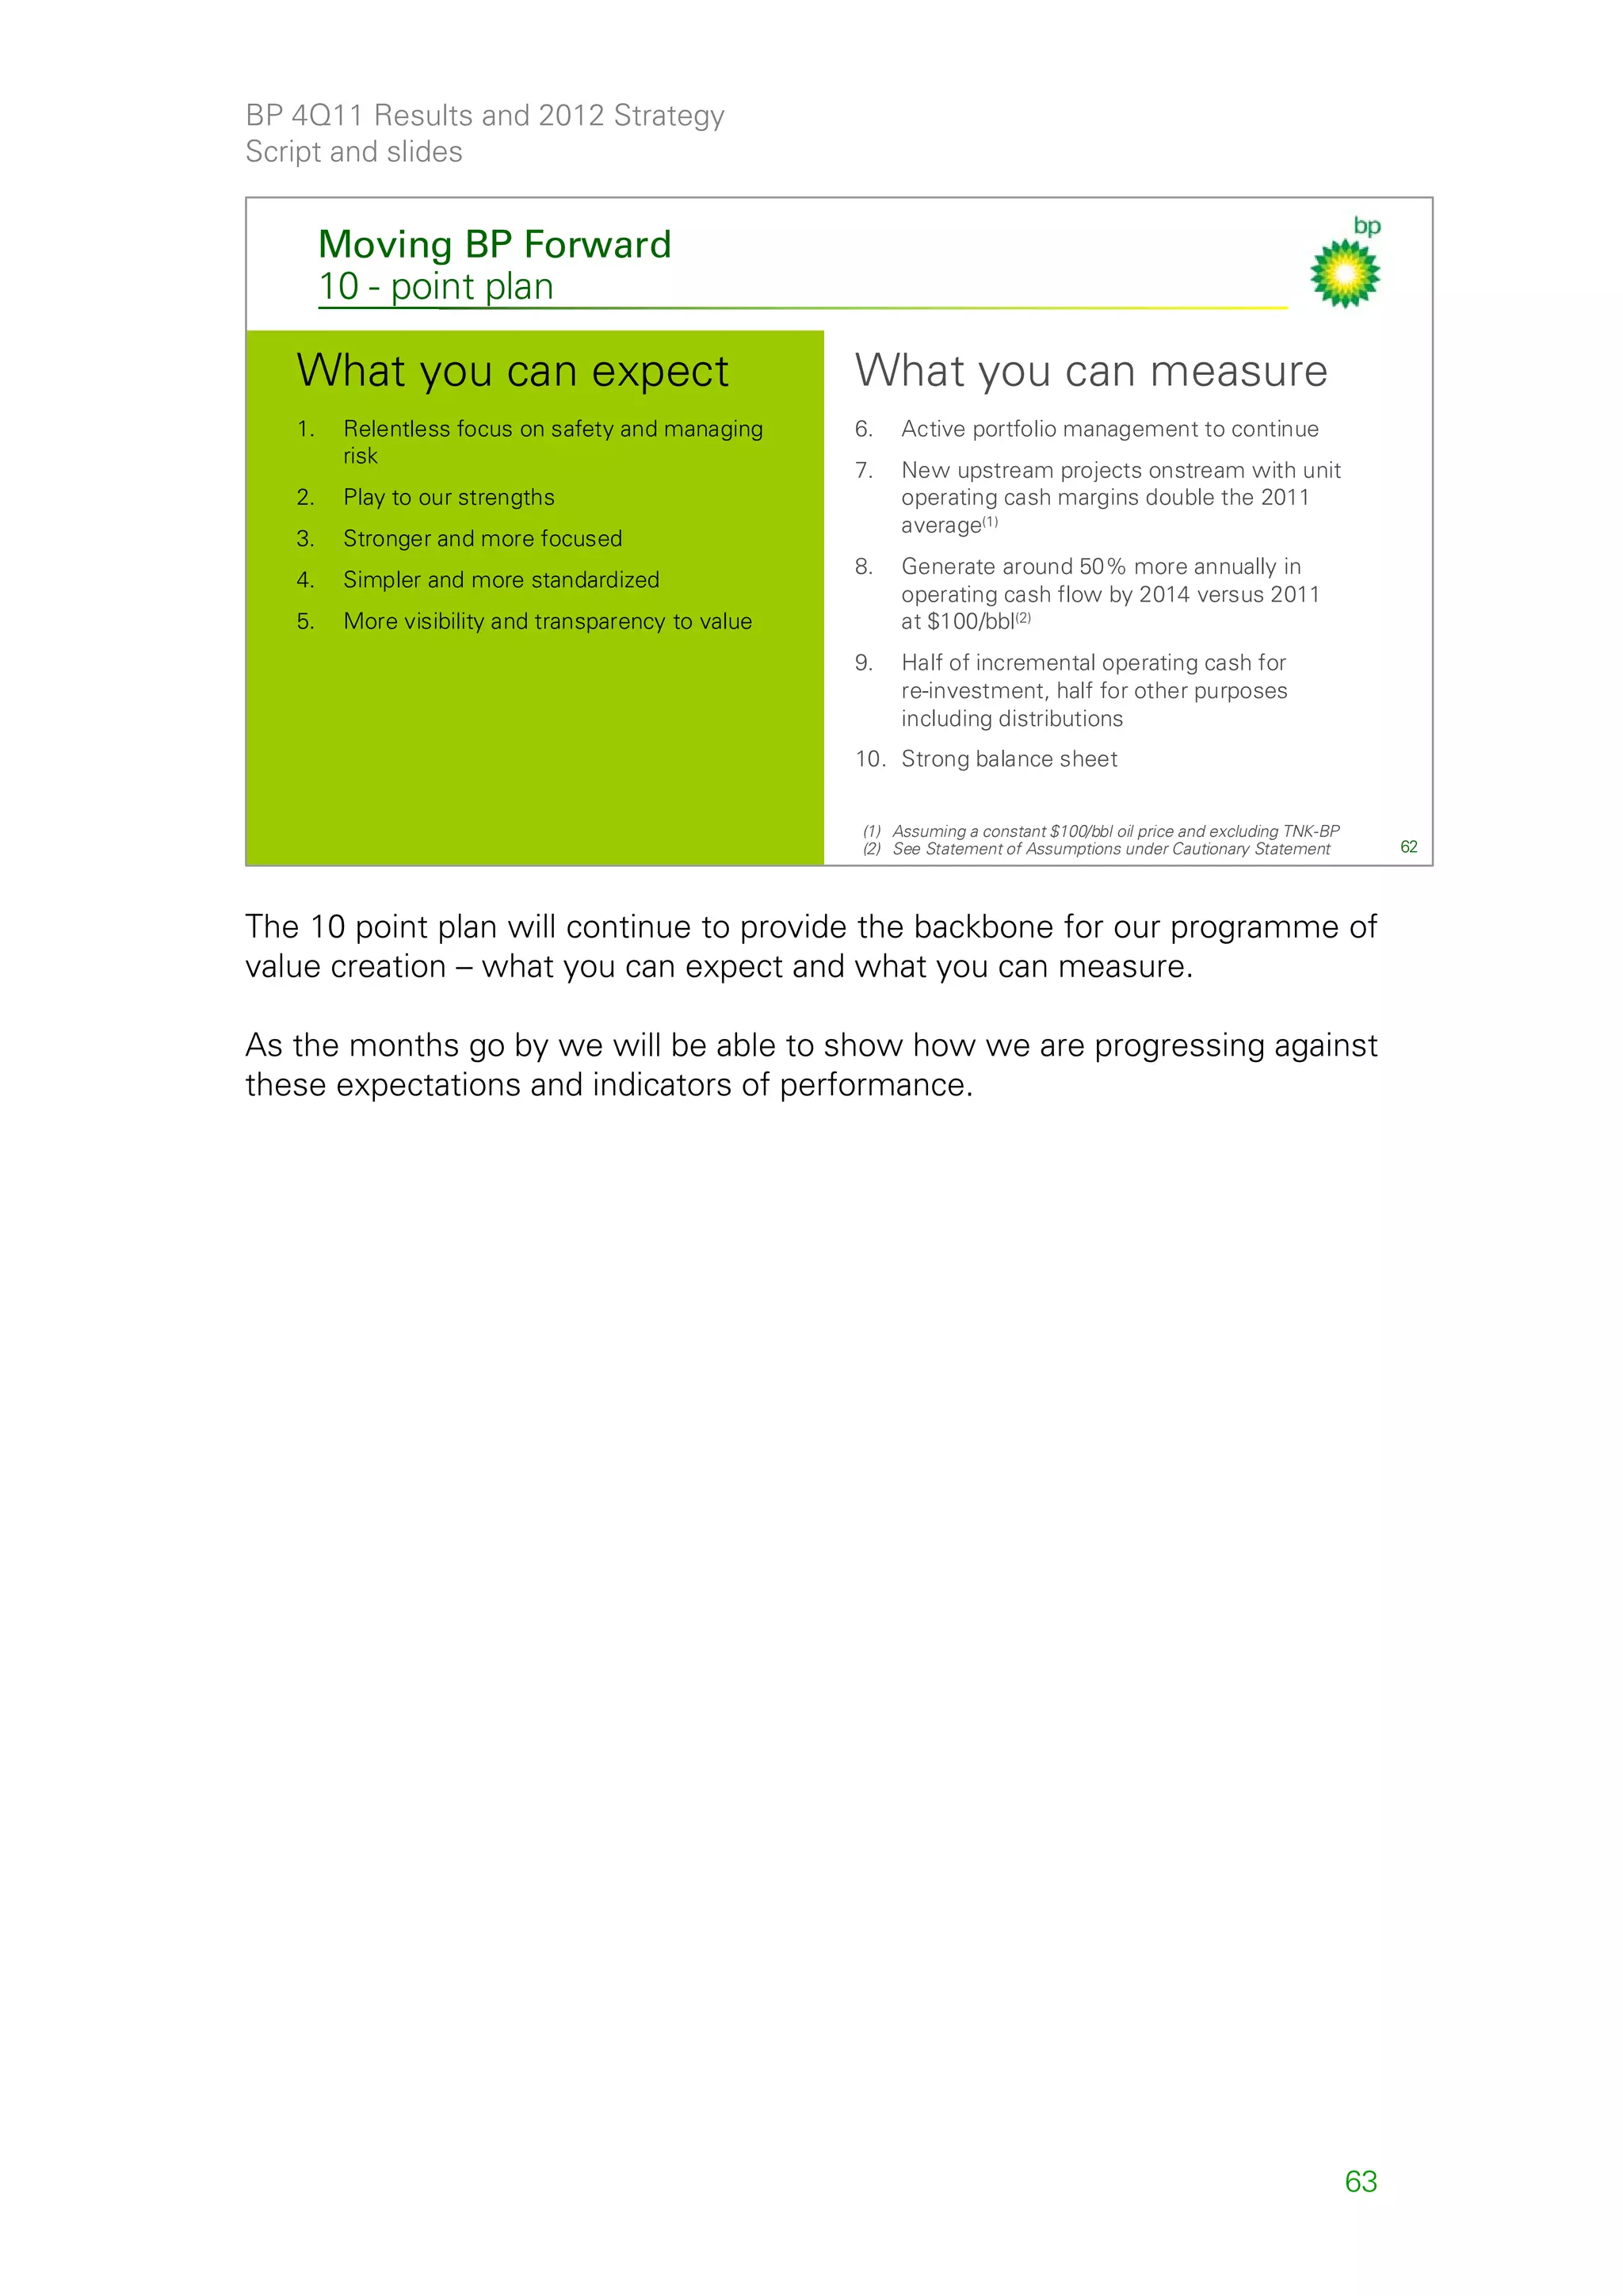
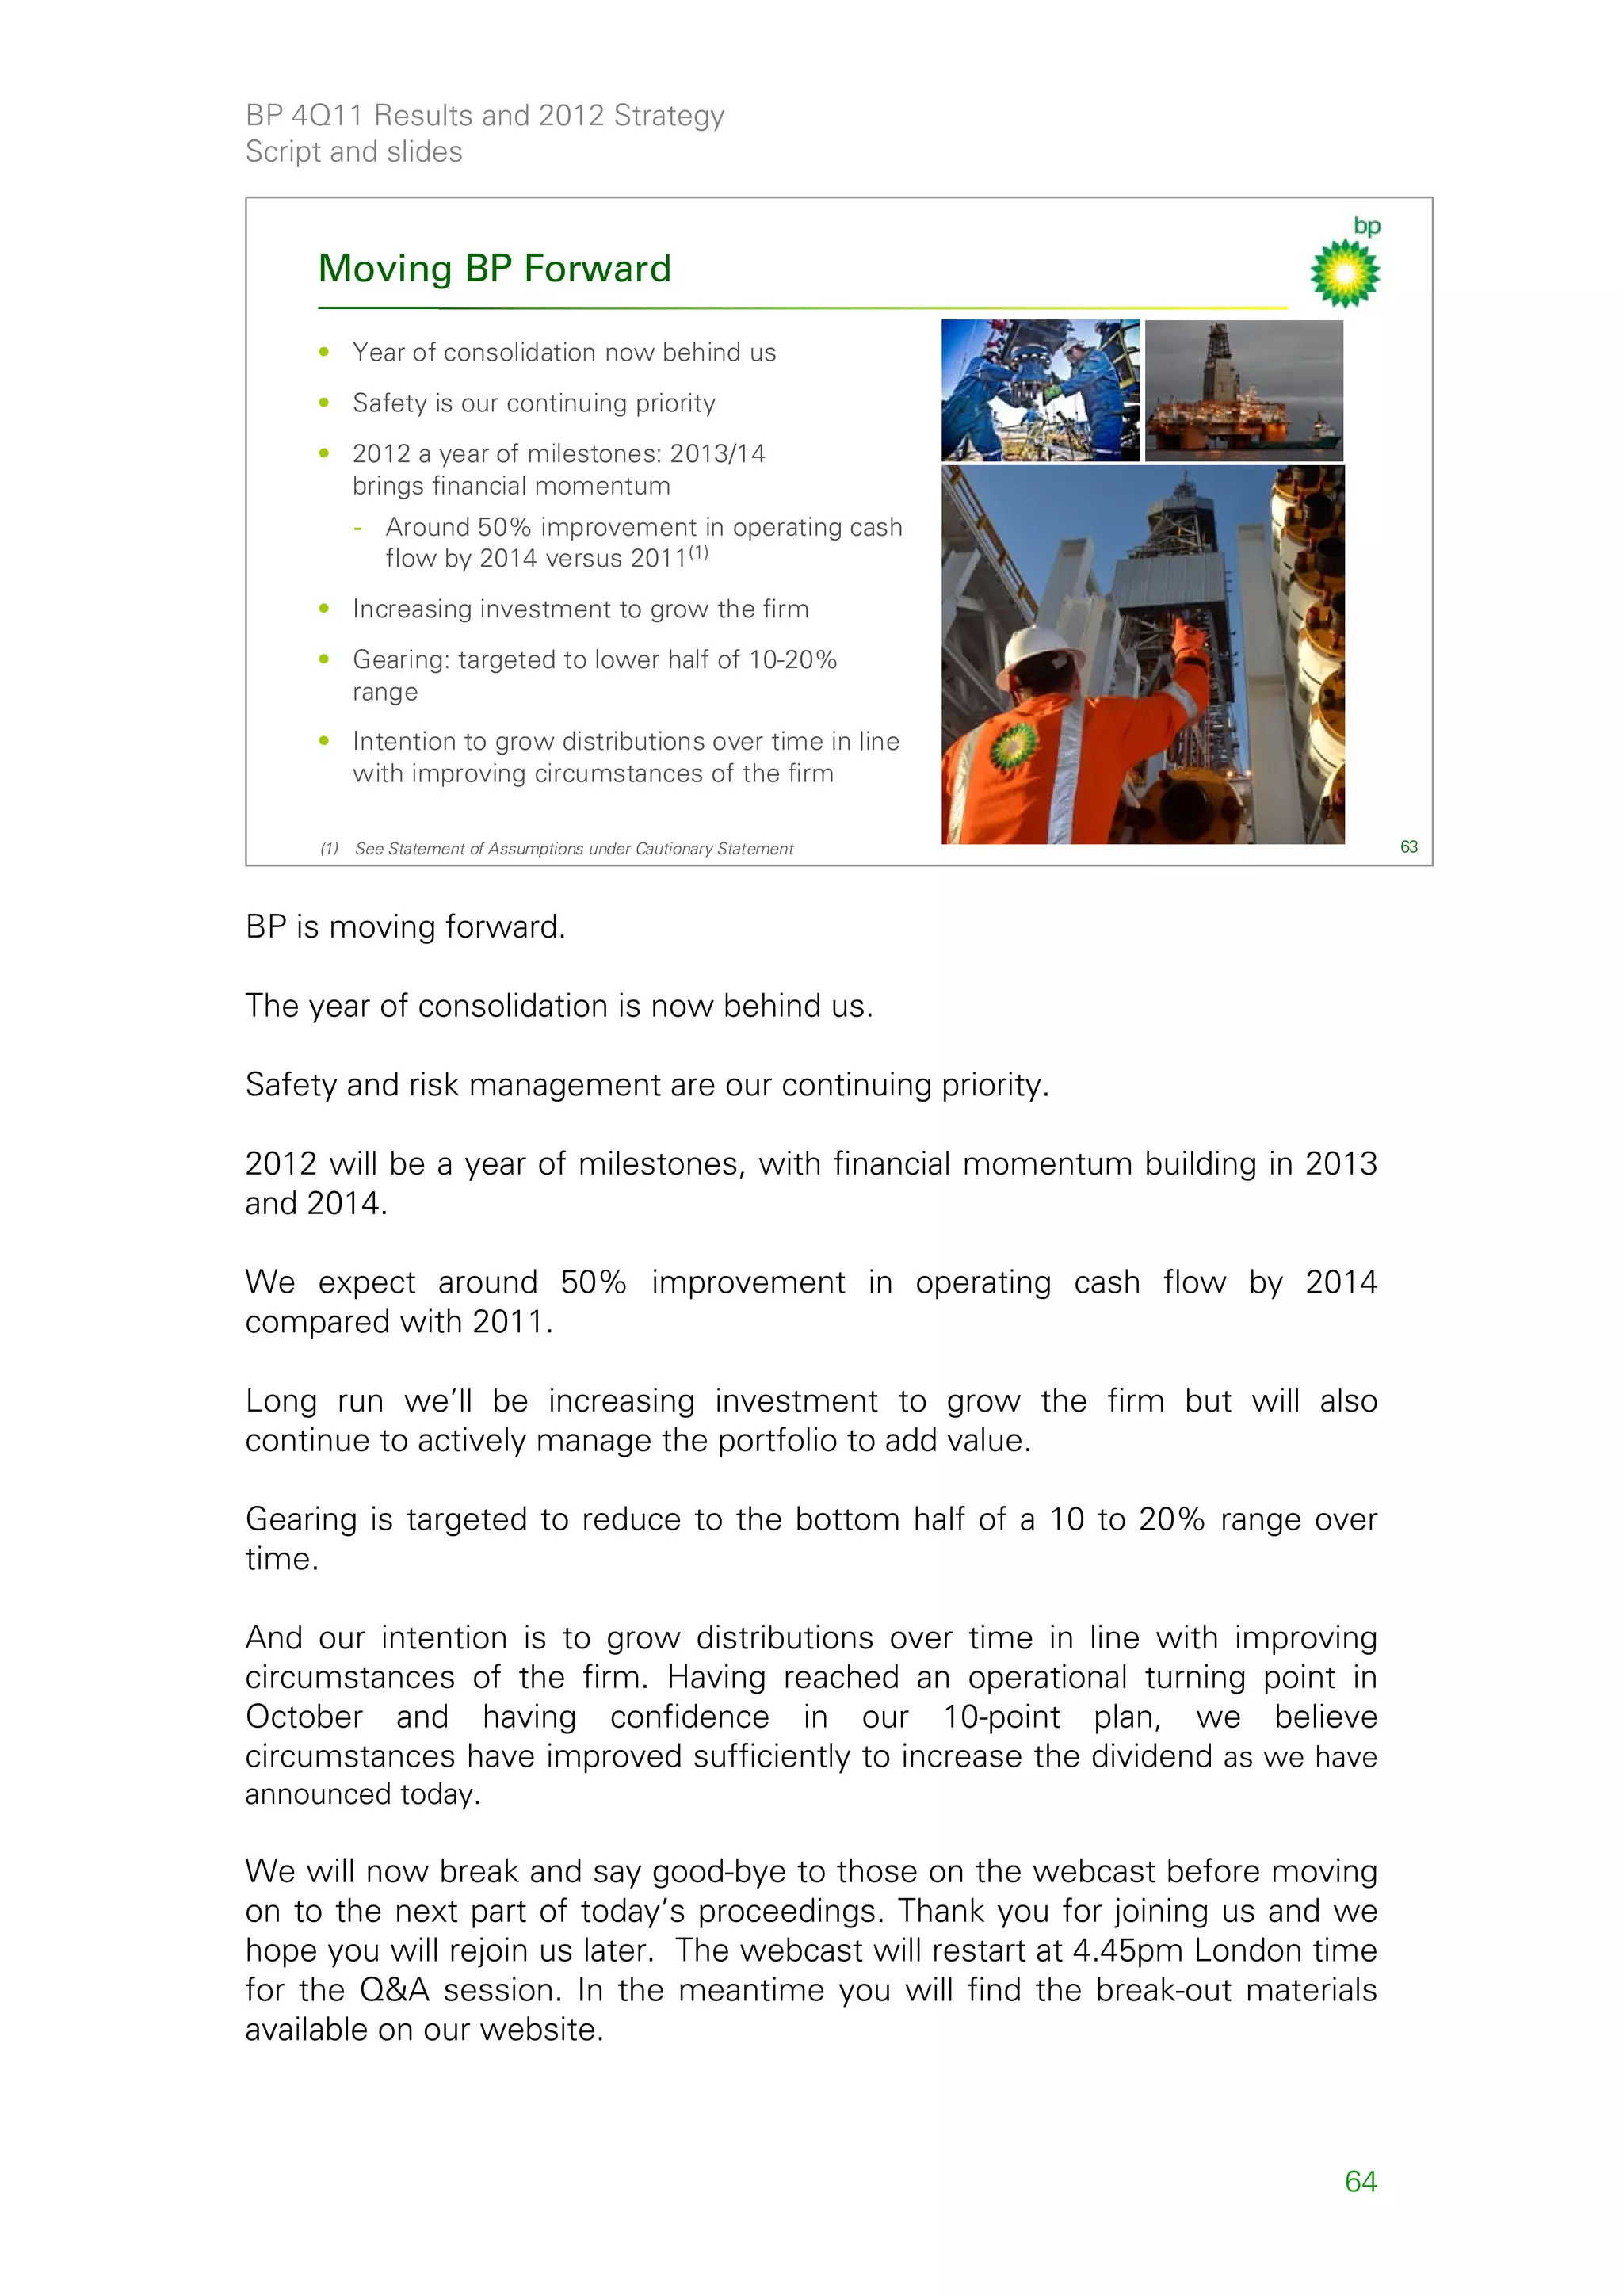
This shows the pipeline in more detail. You can see that we have some major
projects coming through behind the highlighted projects on the right side. These
projects will start up in the next three years. And there is a very strong inventory of
material exploration positions [on the left].
These are aligned with our strengths in deepwater, gas value chains and giant fields.
Deepwater will remain a core building block of our portfolio through the end of the
decade.
In the gas value chains we have world-scale projects in Azerbaijan, Tangguh in
Indonesia, in Egypt and Trinidad. We are appraising another in Oman.
In the area of giant fields we will have significant cash flow coming over decades
from our unconventional Canadian heavy oil projects and big unconventional gas
fields around the world.
43](https://image.slidesharecdn.com/bpfourthquarter2011resultspresentationslidesandscript-120914075044-phpapp01/75/P-4Q11-2012-Strategy-Presentation-43-2048.jpg)
![BP 4Q11 Results and 2012 Strategy
Script and slides
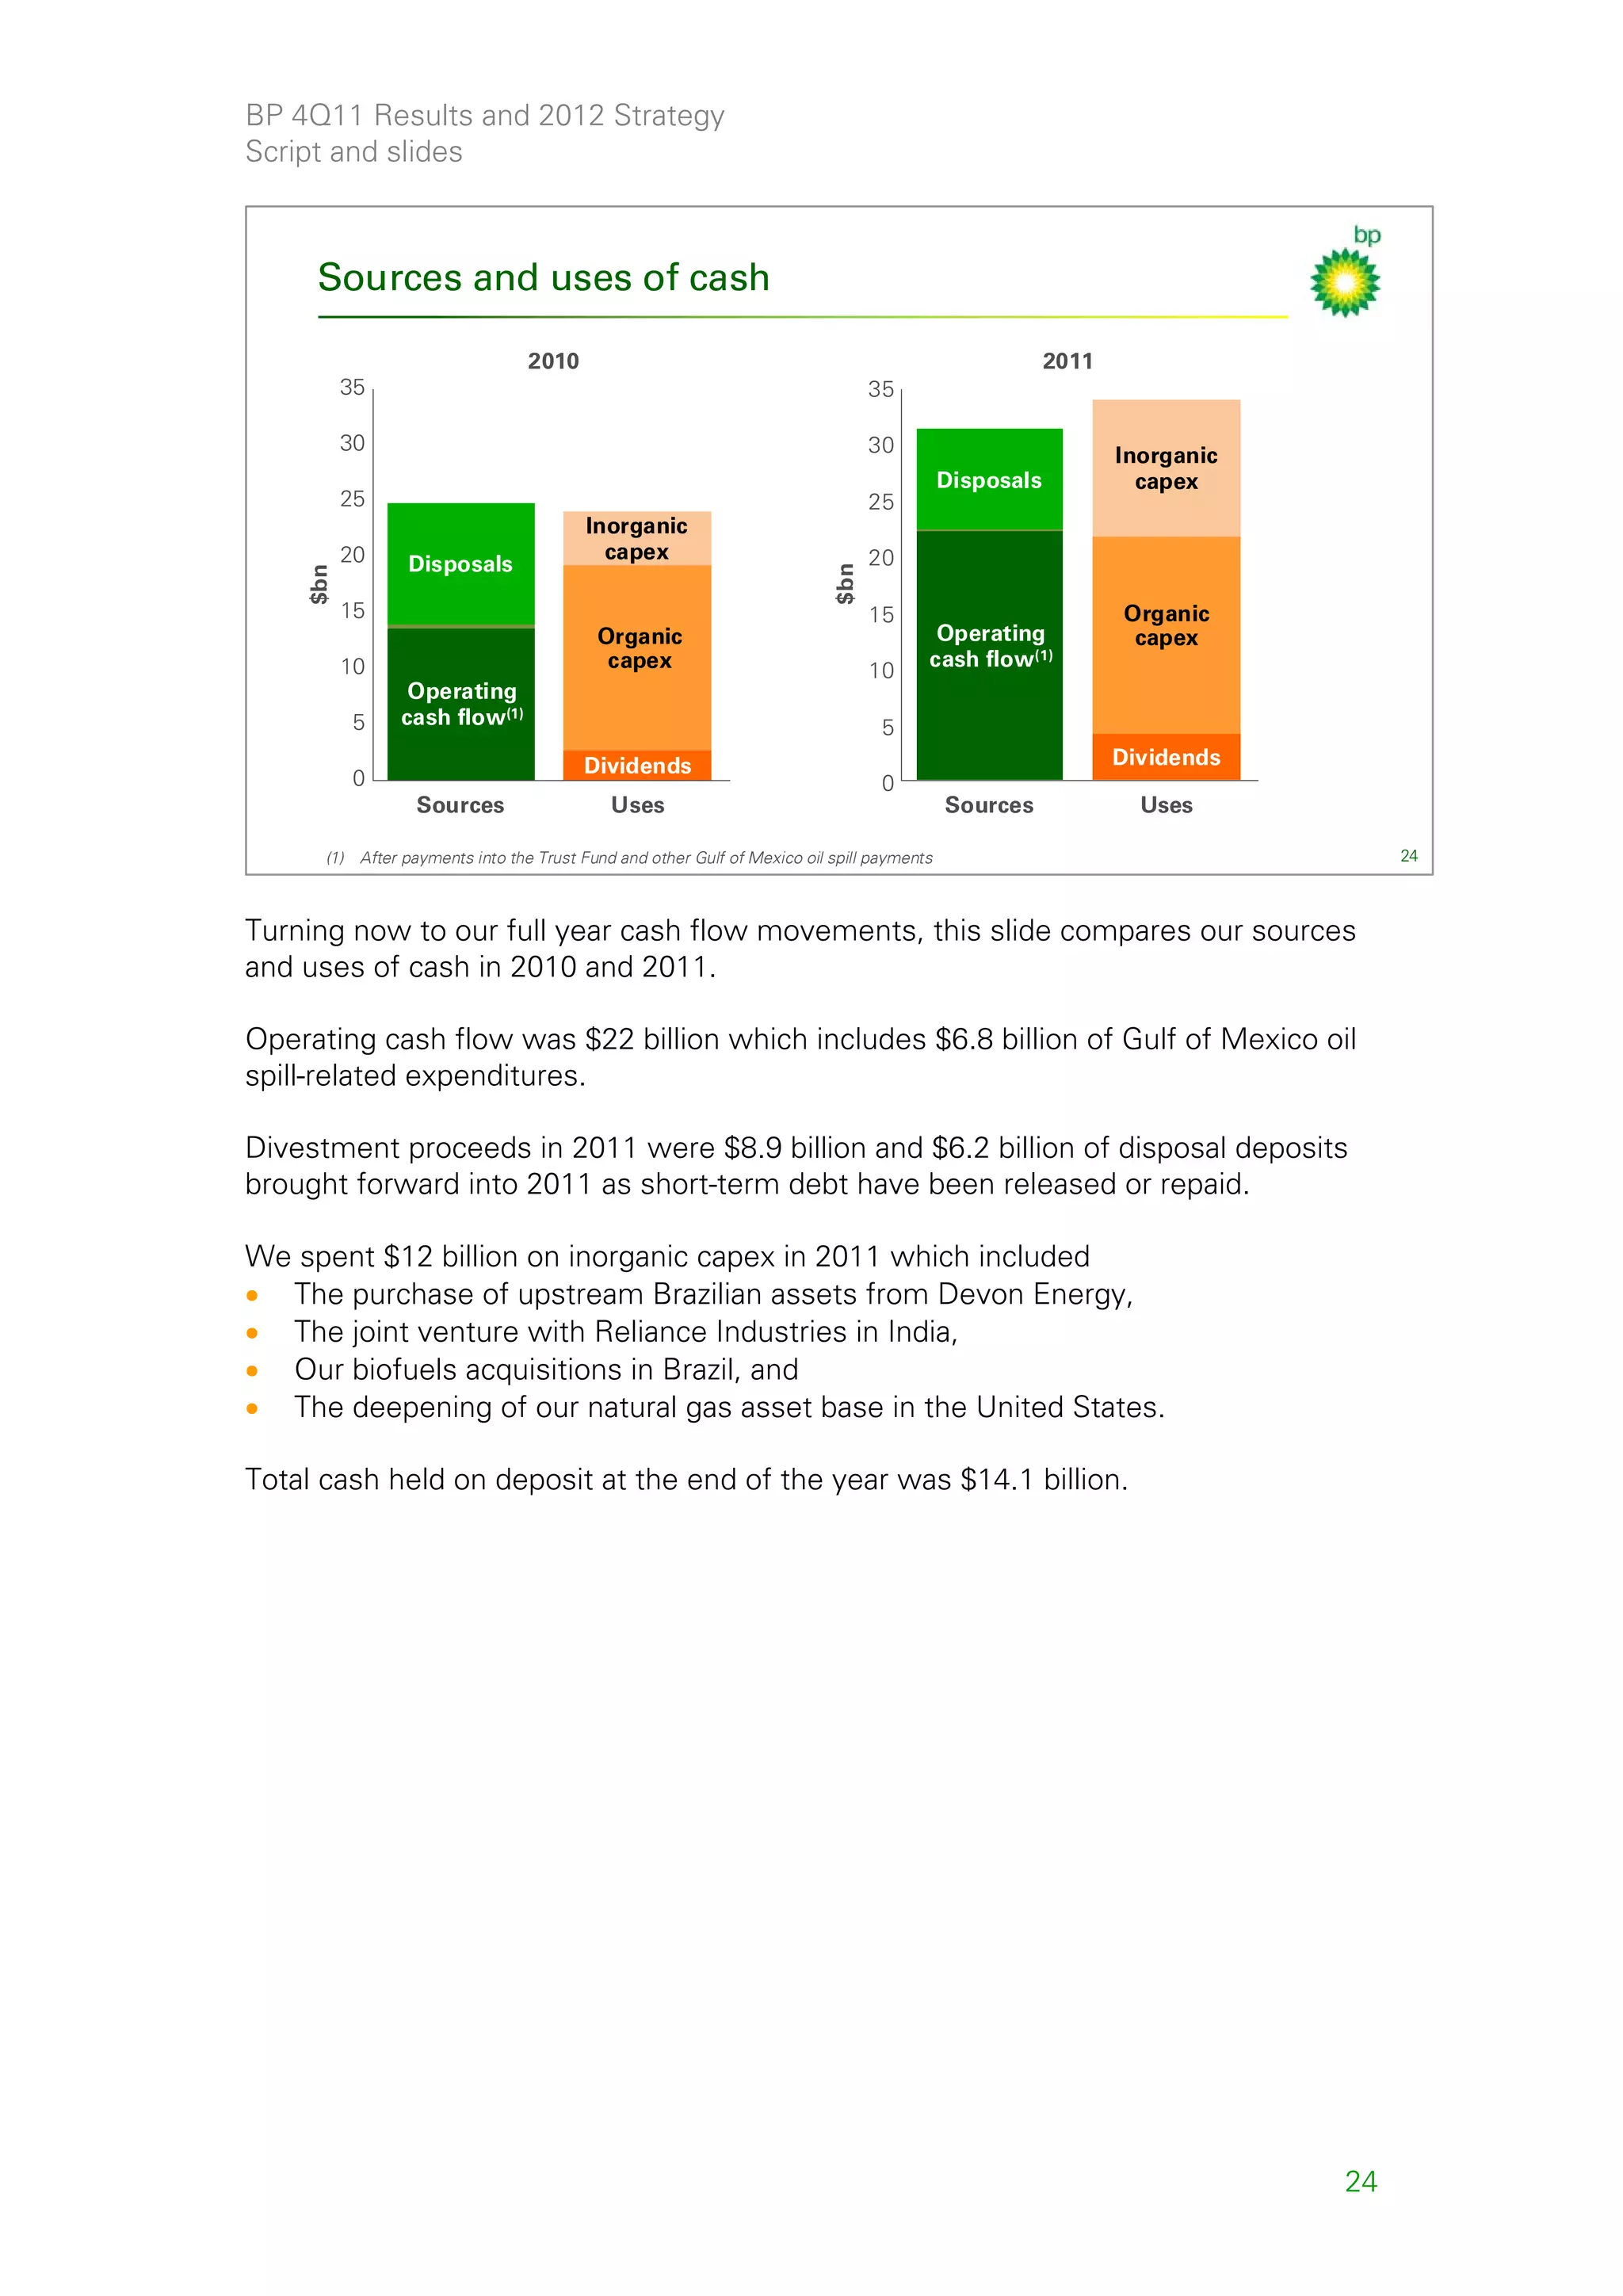
20KTM the next challenge in deepwater
Building 20KTM capability The next deepwater technical frontier: >15 thousand PSI
• BP is investing in technology to enable exploration,
development and production of reservoirs at
20 thousand PSI
• Successful development of 20KTM will enable us to:
- Develop deeper higher pressure resources in our
existing giant fields
- Explore for and produce new hydrocarbon resources in
global basins >15 thousand PSI
10-20 bn bbls resource potential
We will be developing four new 20KTM systems
Rig, riser and BOP Well designs and Subsea production Well intervention and
equipment completions system (SPS) containment
Stronger, larger and safer More real-time monitoring New High Integrity Pressure Apply lessons from Deepwater
design Protection System (HIPPS) Horizon
BOP = Blow Out Preventer
PSI = Pounds per square inch 45
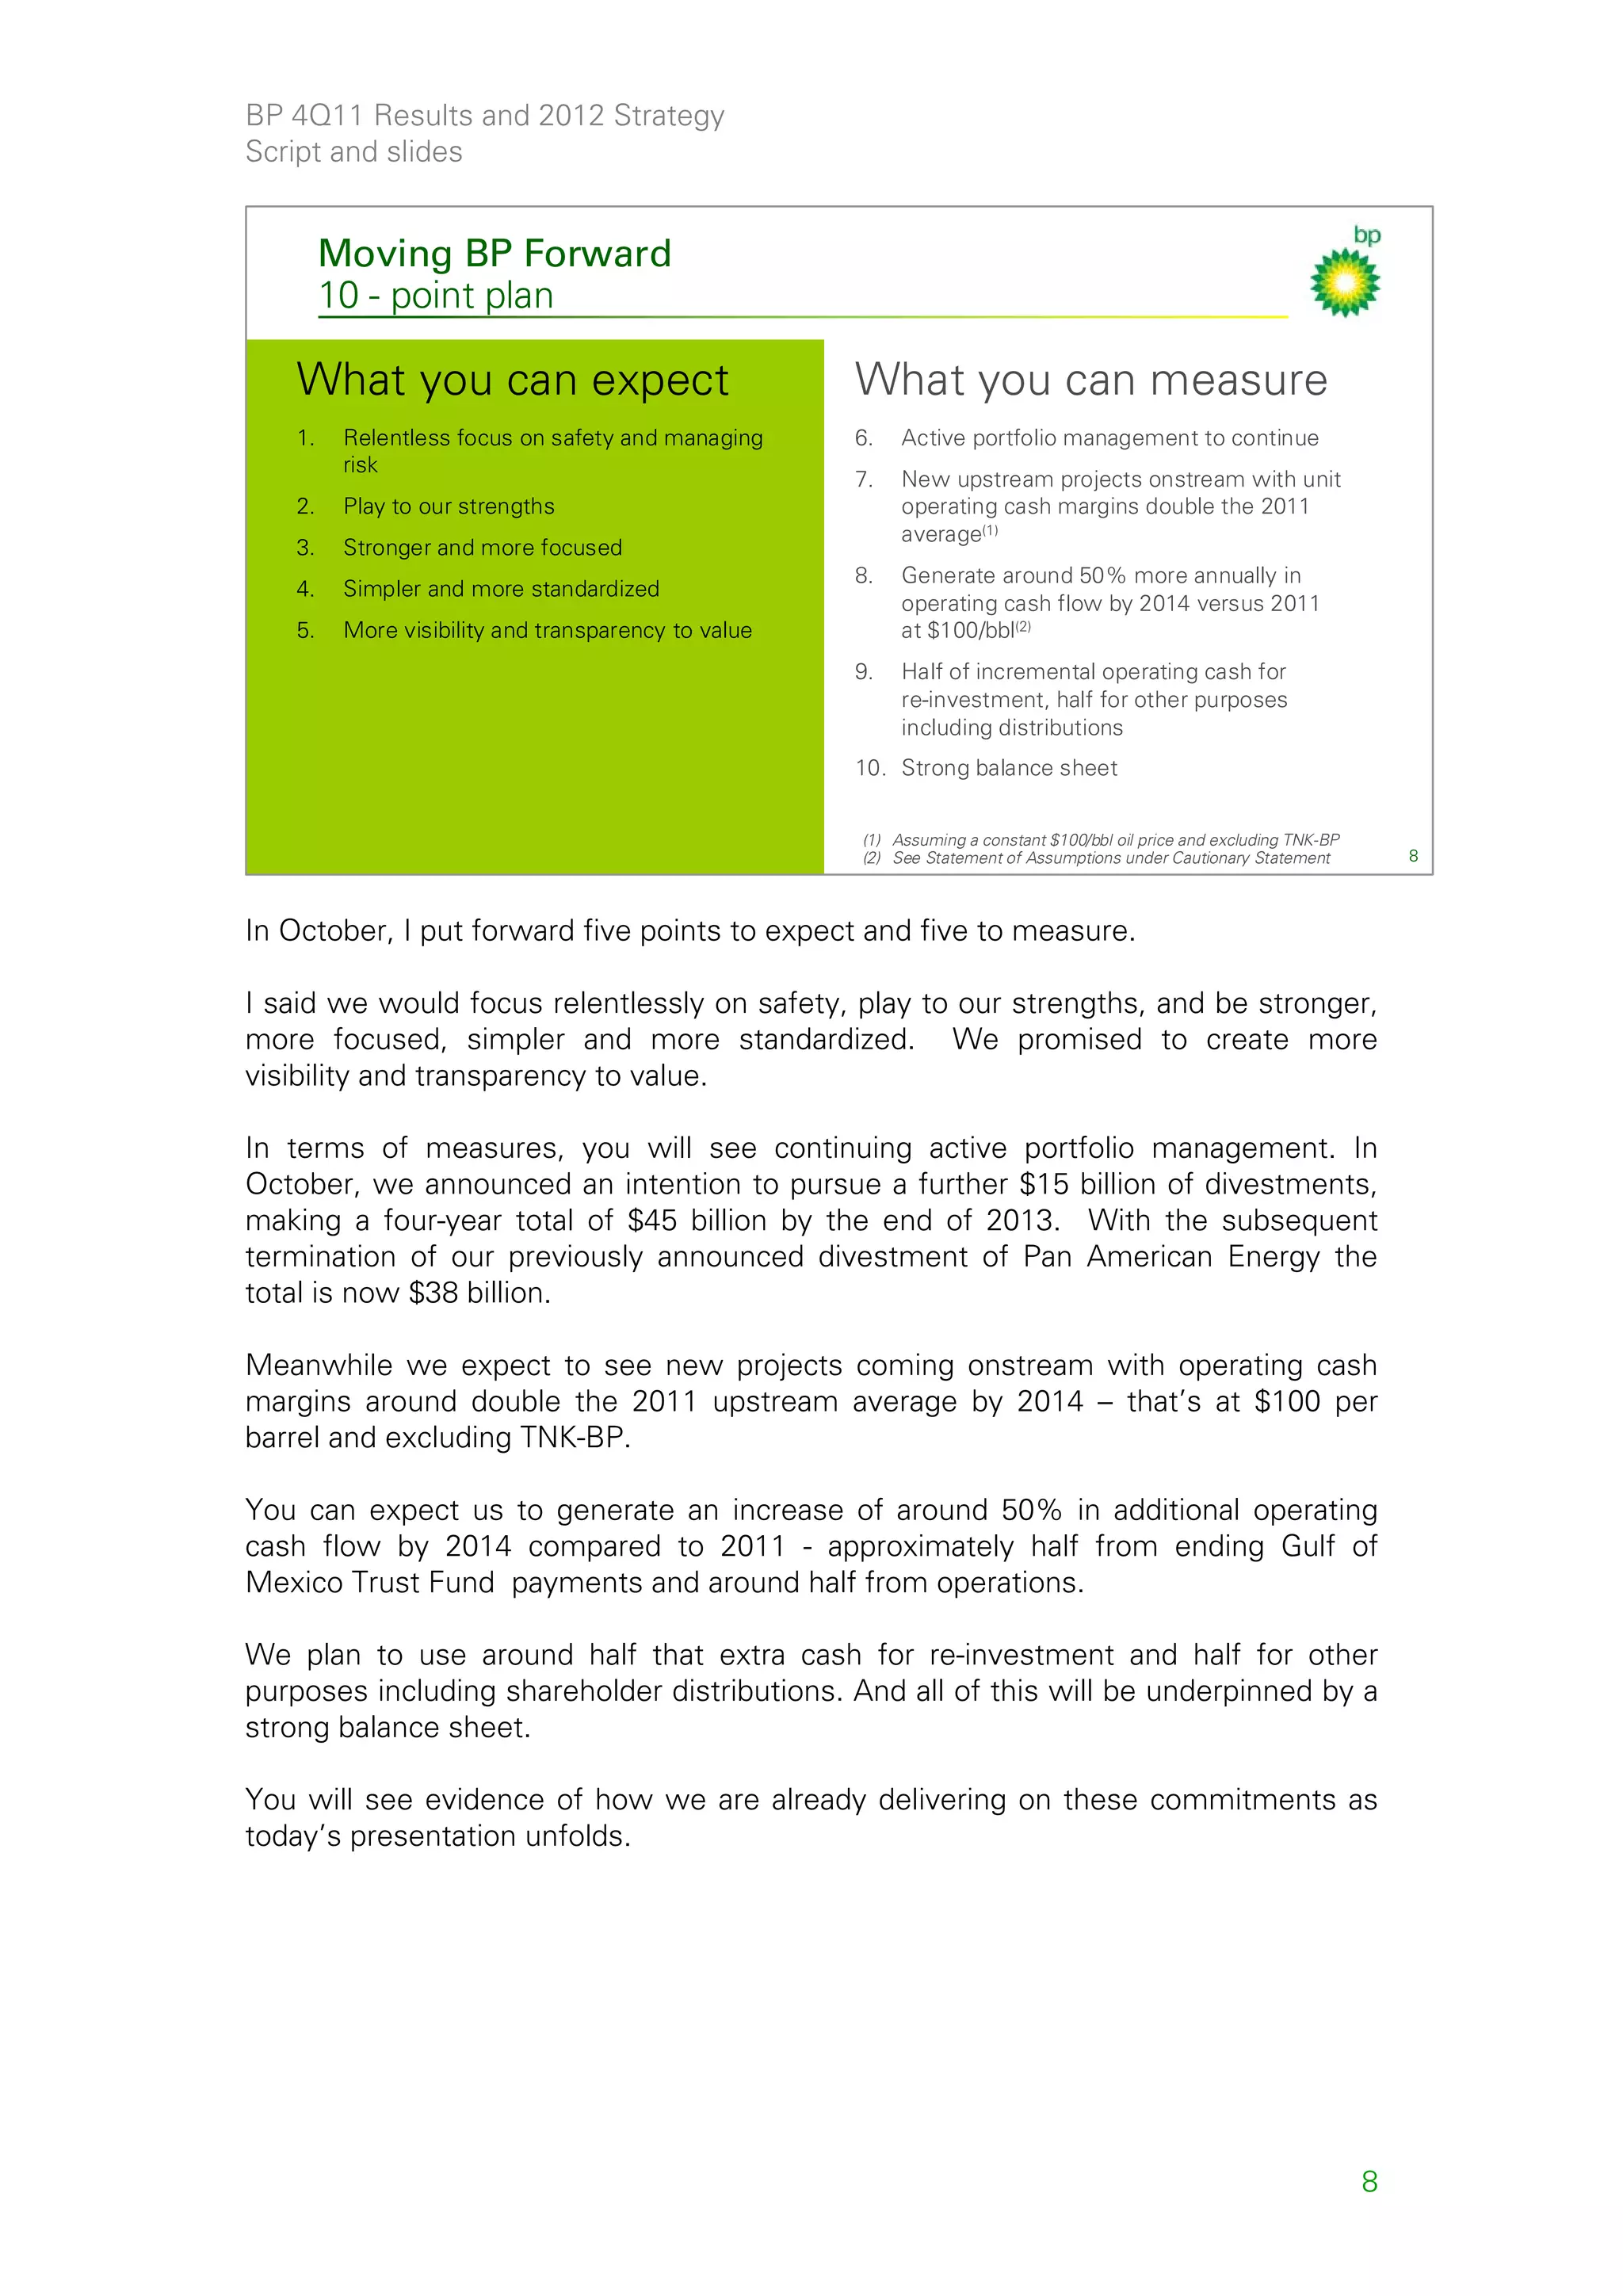
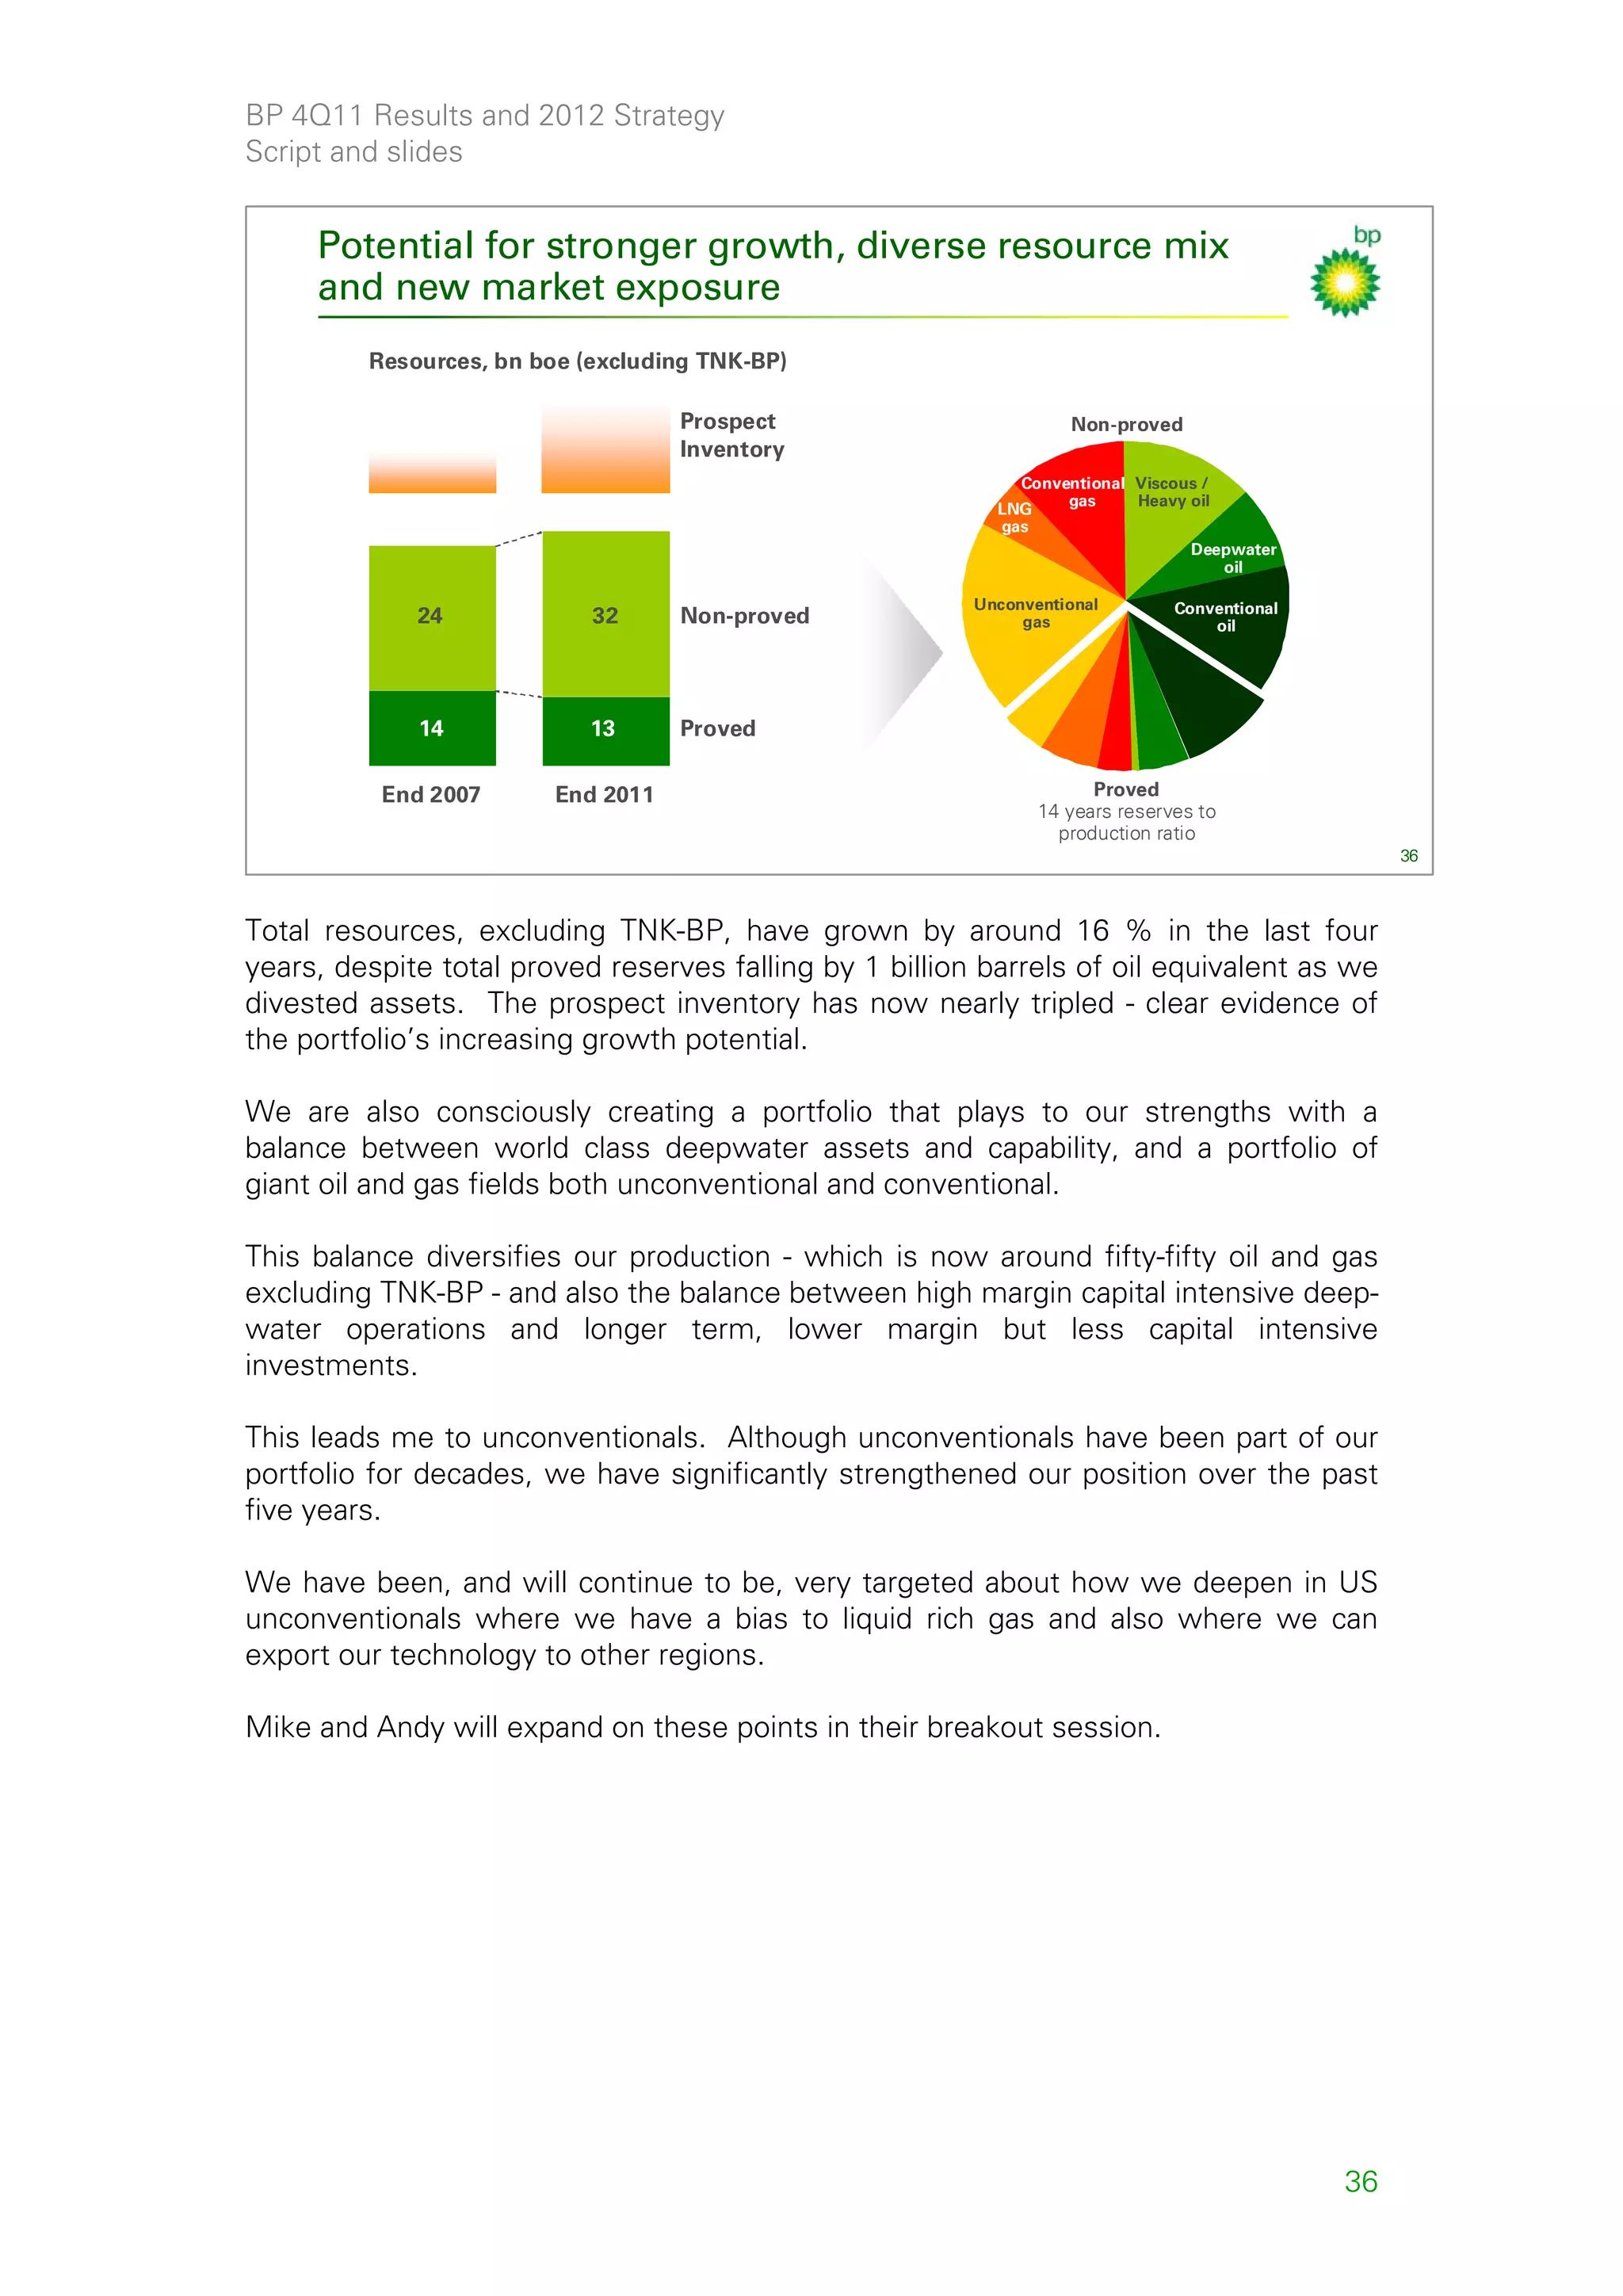
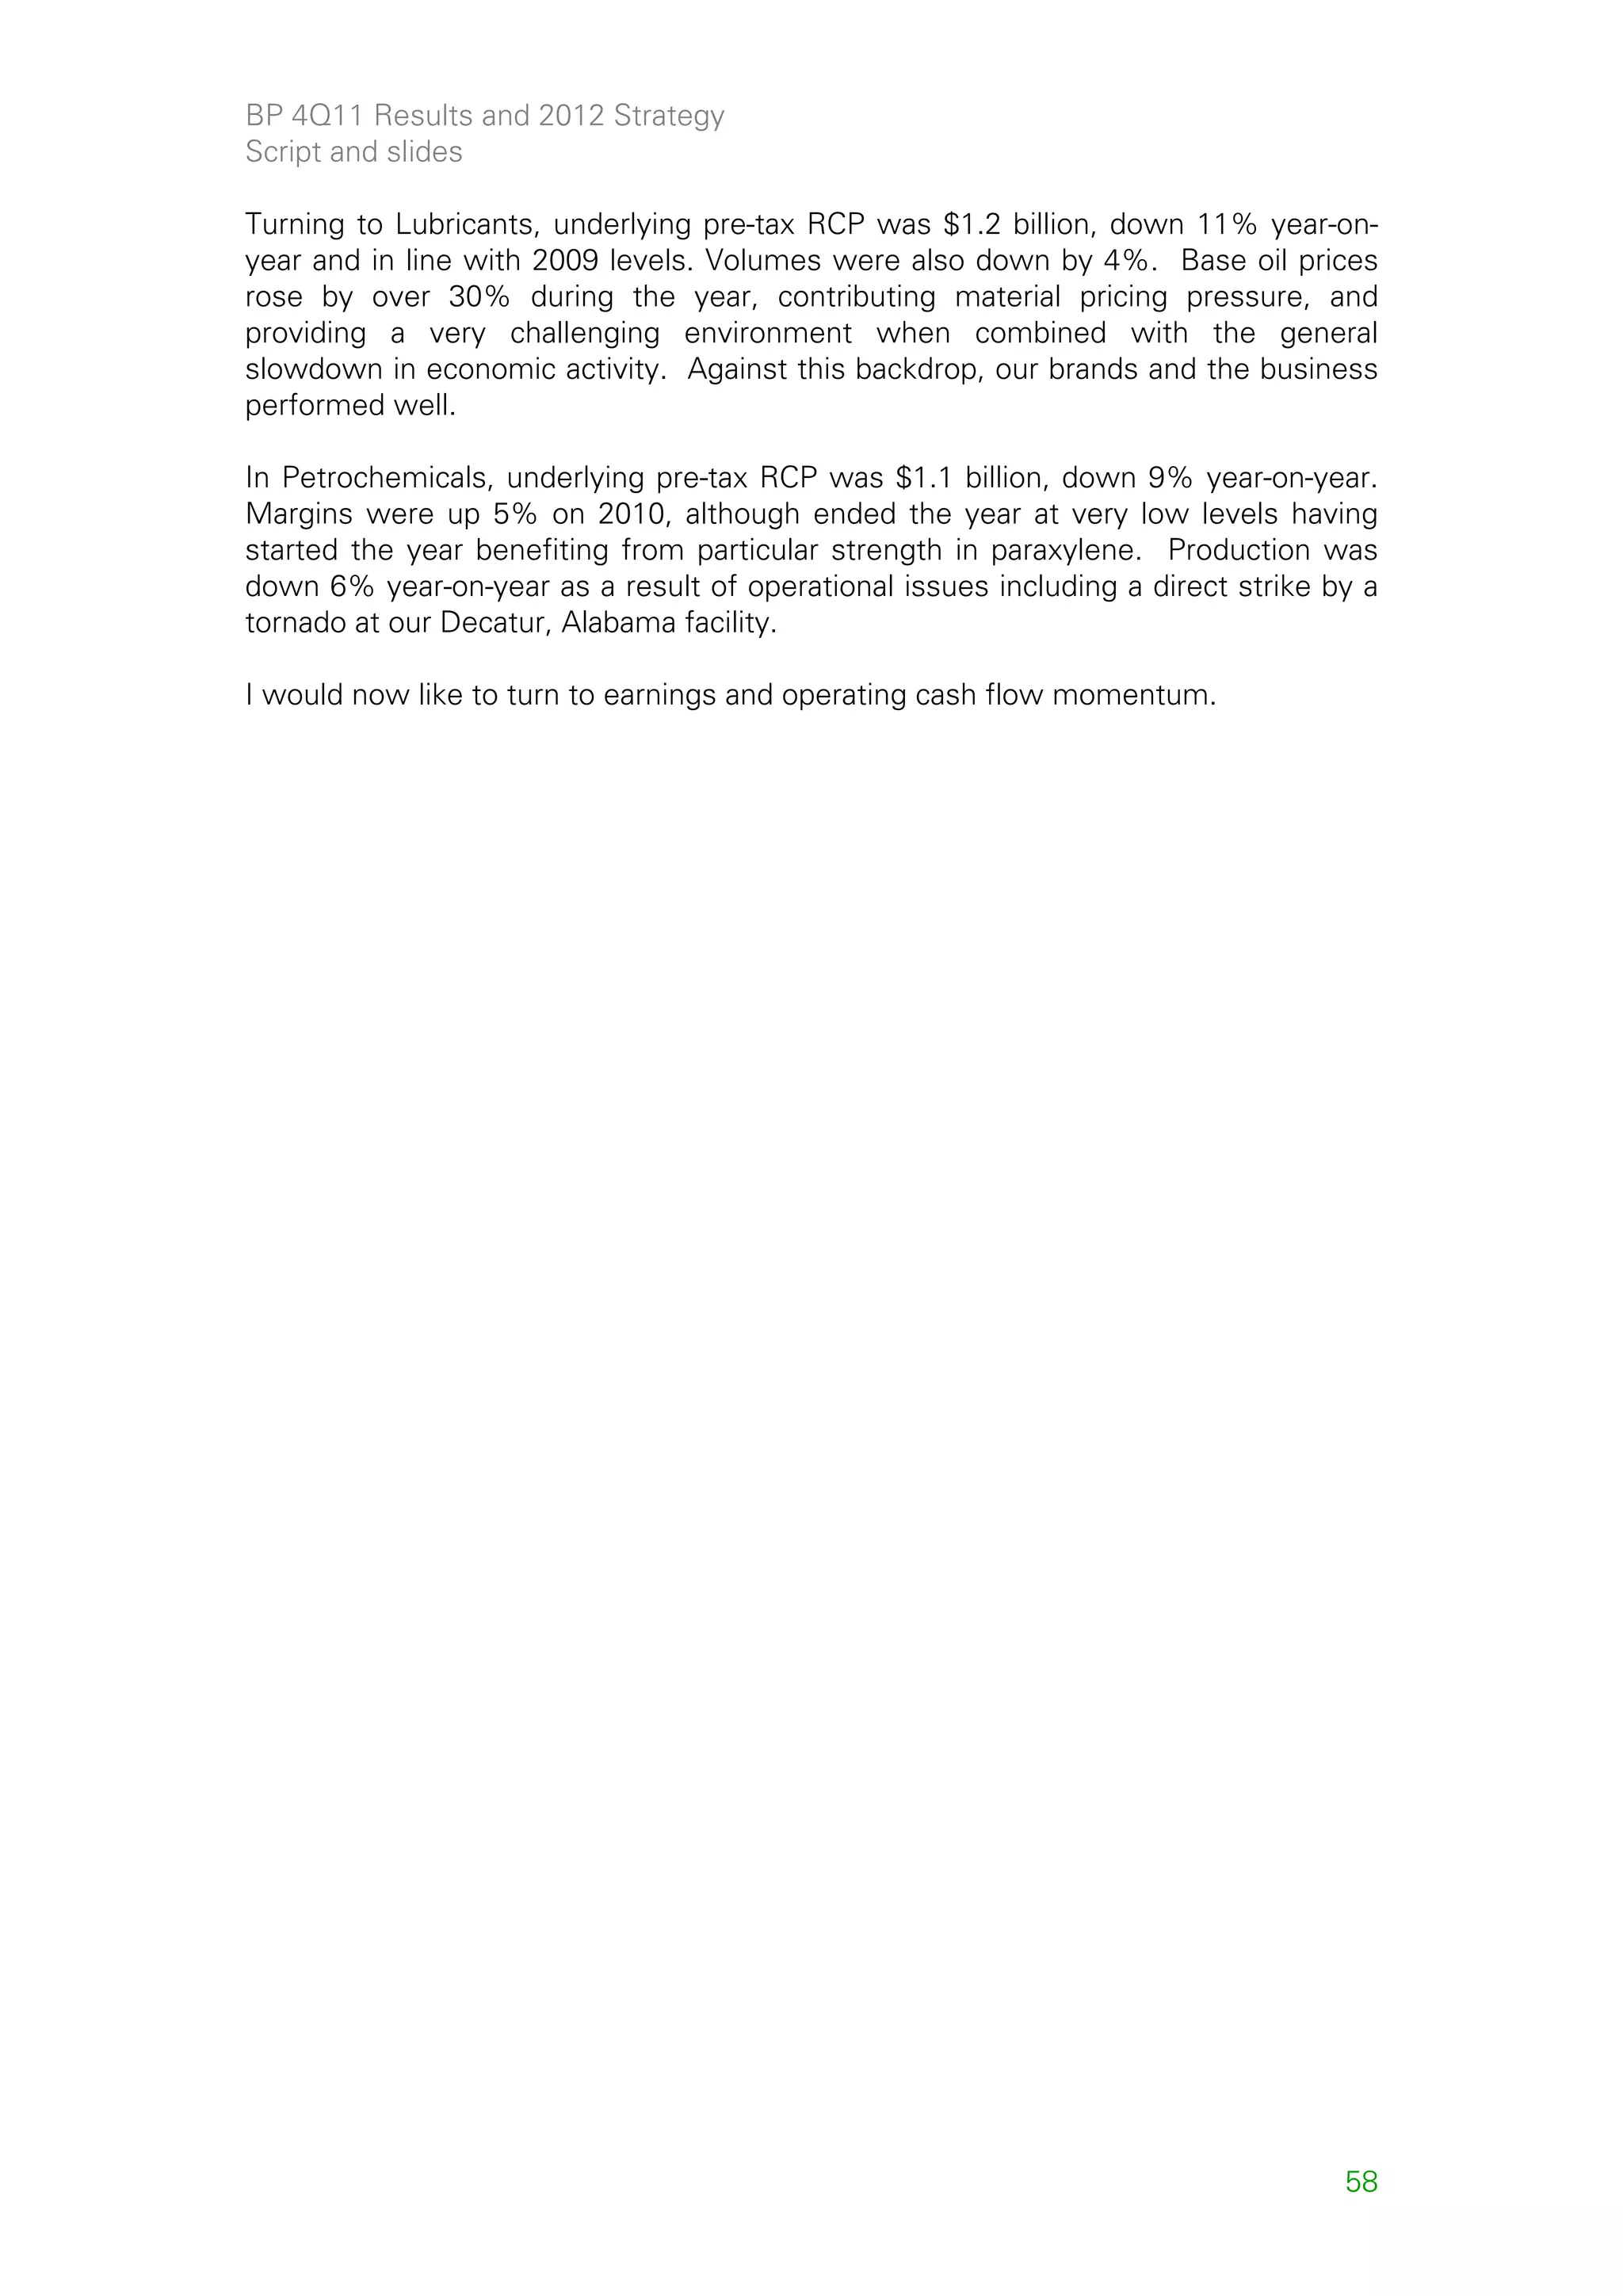
Earlier I mentioned the importance that technology plays in the world of energy. I
would like to make a departure from our usual format and show you something we
are very committed to and will be important for us in the years to come for safely
unlocking new deepwater resources.
Over the last few years we have had considerable success in exploring deeper plays
in some of our established basins - specifically the Paleogene of the Gulf of Mexico,
Tiber and Kaskida; the OlioMiocene of the Nile Delta, that is Raven and Satis; and
the PreFasila reservoirs of Shah Deniz in the Caspian.
Each of these plays has developable oil and gas today, but each also has a material
upside that sits beyond the industry’s current development capability due to high
reservoir pressures.
To address this undevelopable resource, today we are outlining a project to develop
a high pressure capability to drill, develop and produce resources beyond 15,000
pounds per square inch or 15kpsi - we call it Project 20K.
Let’s look at a short video that will give you some appreciation of the challenge and
the opportunity the project represents
[Play-out of Project 20K video]
You can see the challenge and the valuable opportunity this will unlock. We have
great people working on this and I believe it will not only open up some of BP's
existing resources, but perhaps a greater prize will be the new resources it will
unlock in exploration and development of resources.
We anticipate doing this both as BP and in partnership with NOC's. Much of the
technology will apply on and offshore and therefore be of help in the Middle East,
the Mediterranean, Russia and the Gulf of Mexico.
Like many advances in industry development of this capability will take some time.
We will keep you posted on our progress
45](https://image.slidesharecdn.com/bpfourthquarter2011resultspresentationslidesandscript-120914075044-phpapp01/75/P-4Q11-2012-Strategy-Presentation-45-2048.jpg)
![BP 4Q11 Results and 2012 Strategy
Script and slides
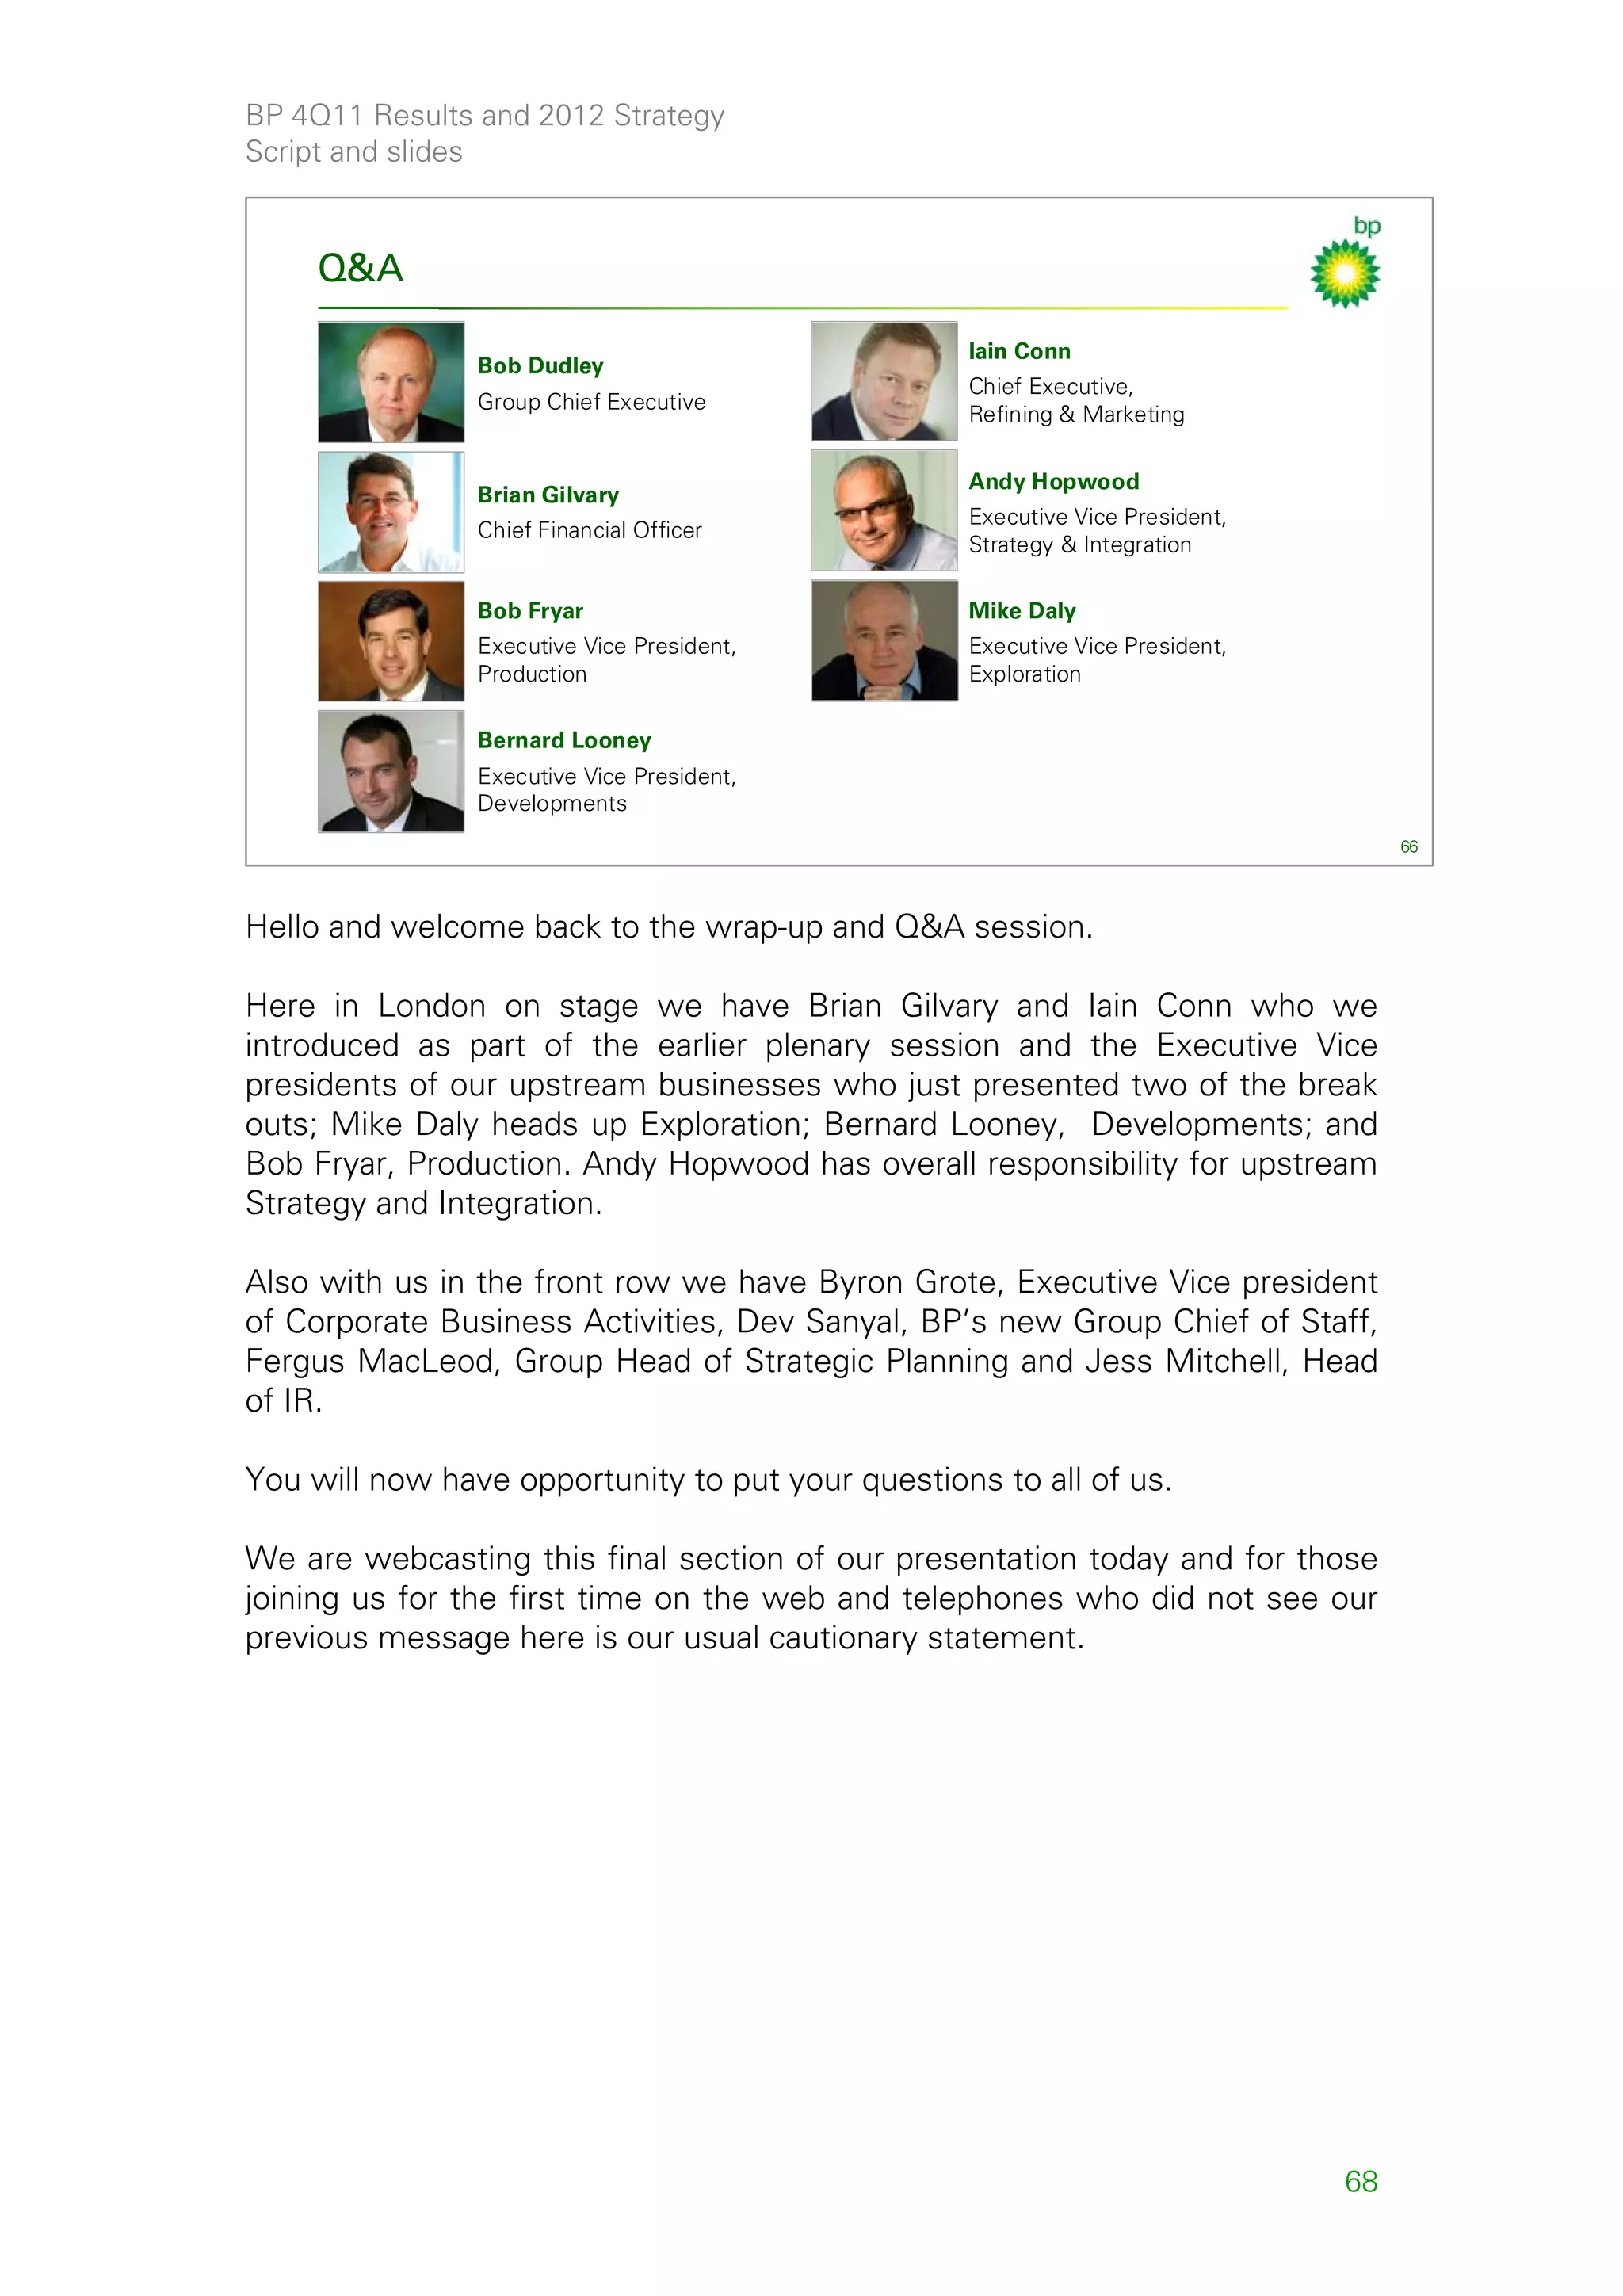
For those here in person, I will now hand over to our Head of Investor
Relations, Jess Mitchell, to explain the arrangements for the break-outs.
Thank you.
[Webcast ends]
65](https://image.slidesharecdn.com/bpfourthquarter2011resultspresentationslidesandscript-120914075044-phpapp01/75/P-4Q11-2012-Strategy-Presentation-65-2048.jpg)
![BP 4Q11 Results and 2012 Strategy
Script and slides
SECRET
2011 Results and
Strategy Presentation
2011 Results and
7 February 2012
Strategy Presentation
7 February 2012
65
[Picture for when attendees reconvene for wrap-up Q&A]
67](https://image.slidesharecdn.com/bpfourthquarter2011resultspresentationslidesandscript-120914075044-phpapp01/75/P-4Q11-2012-Strategy-Presentation-67-2048.jpg)