Download to read offline


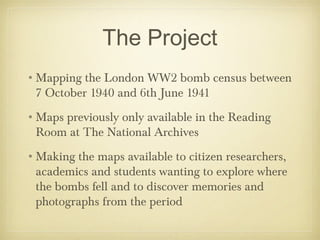
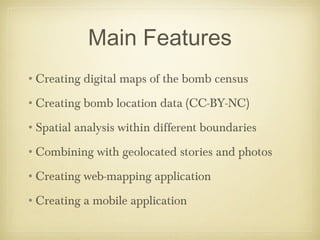
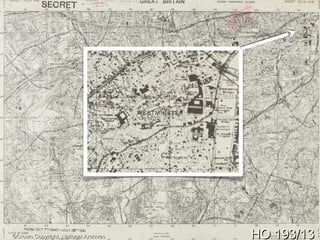
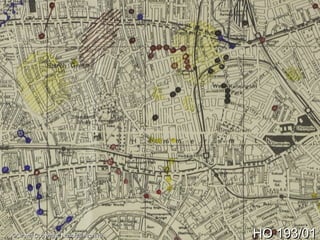
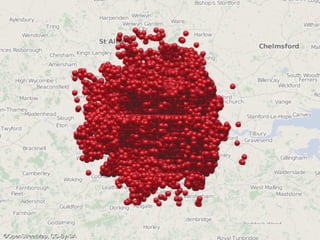
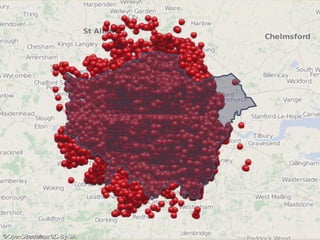
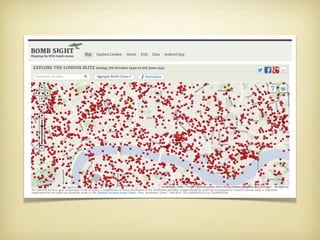
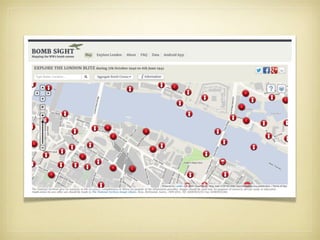
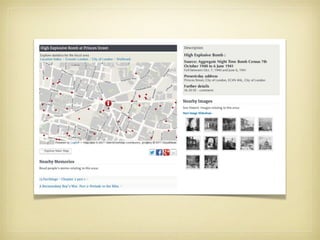


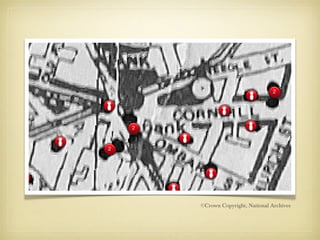
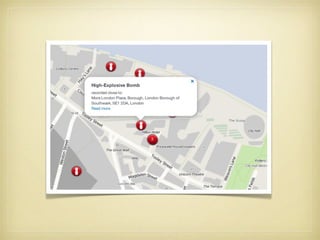
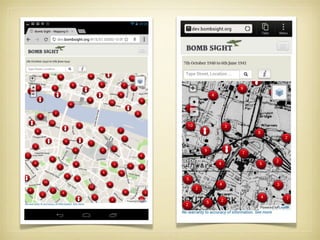
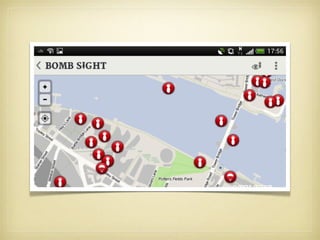
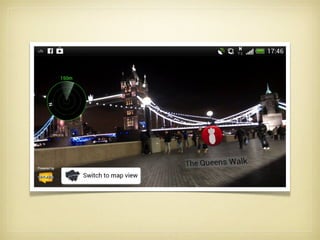

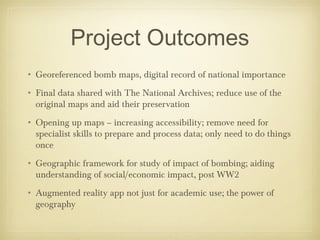


The project maps the London WWII bomb census from October 7, 1940, to June 6, 1941, making historical maps accessible online for researchers and the public. It includes the creation of digital maps, bomb location data, and a mobile web application, enhancing understanding of the bombing's social and economic impacts. The initiative aims to preserve original maps while encouraging broader engagement through tutorials and potential augmented reality applications.


