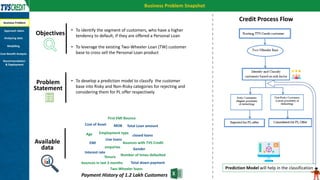
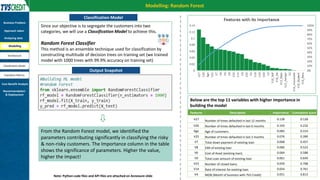
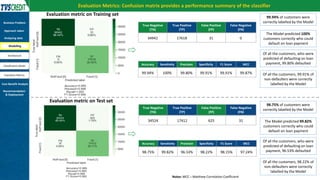
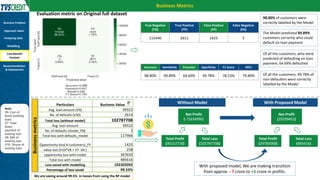
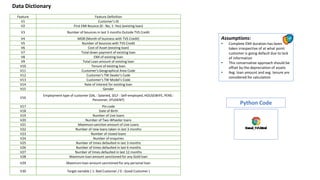
To identify the segment of customers, who have a higher tendency to default, if they are offered a Personal Loan
To leverage the existing Two-Wheeler Loan (TW) customer base to cross-sell the Personal Loan product
Depreciation at delta & singapore airline (HBR)Abhishek kyal
solution on Depreciation at delta and Singapore airlines by HBR. This is a very famous case study about depreciation , changes in method and impact on Profit.
This is the case study of the subject Managerial Accounting. It deals with the Break Even point. The analysis is basically on the break -even analysis for the multiple products. We have done the full analysis and the solution is in the presentation.
Super shampoo products and the indian mass market case studyMustahid Ali
Super shampoo products and the indian mass market case study, their evolution, marketing strategy adopted by them, their up and downs , how they became successful, their swot analysis and how they overcome to worst situation.
Accountancy Comprehensive Project For Class - 12th on Partnership FirmPriyanka Sahu
This slide is about the comprehensive project given to the students of class 12 for their practical examination. this project is strictly based on the CBSE guidelines. This is a format for making the project. Students can choose any of question in partnership firm and can solve it ,
A marketing Case Study of Natureview Farm, an organic yogurt manufacturer. This analysis was performed by E. Santhosh Kumar, IIT Madras, during an internship with Prof. Sameer Mathur, IIM Lucknow.
Many investors mistakenly base the success of their portfolios on returns alone. Few consider the risk that they took to achieve those returns. Since the 1960s, investors have known how to quantify and measure risk with the variability of returns, but no single measure actually looked at both risk and return together. Today, we have three sets of performance measurement tools to assist us with our portfolio evaluations. The Treynor, Sharpe and Jensen ratios combine risk and return performance into a single value, but each is slightly different. Which one is best for you? Why should you care? Let's find out.
Portfolio performance measures should be a key aspect of the investment decision process. These tools provide the necessary information for investors to assess how effectively their money has been invested (or may be invested). Remember, portfolio returns are only part of the story. Without evaluating risk-adjusted returns, an investor cannot possibly see the whole investment picture, which may inadvertently lead to clouded investment decisions.
AI powered Decision Making in Banks - How Banks today are using Advanced analytics in credit Decisioning, enhancing customer life time value, lower operating costs and stronger customer acquisition
The data set used in this project is available in the Kaggle and contains nineteen columns (independent variables) that indicate the characteristics of the clients of a fictional telecommunications corporation. The Churn column (response variable) indicates whether the customer departed within the last month or not. The class No includes the clients that did not leave the company last month, while the class YES contains the clients that decided to terminate their relations with the company. The objective of the analysis is to obtain the relation between the customer’s characteristics and the churn.
Use of Analytics to recover from COVID19 hit economyAmit Parija
As the world takes a unexpected economic down turn due to the COVID19 pandemic, data sciences and analytics is something business are turning to take quick decisions
Machine Learning models can bring value to organizations only if they are accepted by the end users. In most industries machine learning models are still typically used as decision support systems for human operators. Therefore, apart from technical requirements and KPIs, which are computed based on aggregated model outcomes, models need to be prescriptive and easy to interact with.
This talk focuses on several experiences from different industries (banking, insurance and manufacturing). In each example the primary machine learning model was extended with an optimisation or natural language processing module to improve the prescriptive power of the model, simplify interaction with end users and ensure smooth integration in organisations' operational procedures.
Presentation on "A Complete Overview of Data Driven Decision Making in a Quickly Changing Business Environment" given by Isaac Aidoo, Head of Data Analytics, Zoona.
Vortrag von Raj Venkatesan und Kim Whitler an der HWZ-Darden Konferenz vom 8. Juni 2017 an der HWZ Hochschule für Wirtschaft Zürich.
https://fh-hwz.ch/conference
Operationalizing Customer Analytics with Azure and Power BICCG
Many organizations fail to realize the value of data science teams because they are not effectively translating the analytic findings produced by these teams into quantifiable business results. This webinar demonstrates how to visualize analytic models like churn and turn their output into action. Senior Business Solution Architect, Mike Druta, presents methods for operationalizing analytic models produced by data science teams into a repeatable process that can be automated and applied continuously using Azure.
Applying machine learning to Kaggle data set to predict which customers are most likely to become customers. Random Forest column importance graph is helpful to prioritize the best segments to target.
Delve into the realm of predictive modeling for loan approval. Learn how data science is revolutionizing the lending industry, making the loan approval process faster, more accurate, and fairer. Discover the key factors that influence loan decisions and how predictive modelling is shaping the future of lending. visit https://bostoninstituteofanalytics.org/data-science-and-artificial-intelligence/ for more data science insights
As Europe's leading economic powerhouse and the fourth-largest hashtag#economy globally, Germany stands at the forefront of innovation and industrial might. Renowned for its precision engineering and high-tech sectors, Germany's economic structure is heavily supported by a robust service industry, accounting for approximately 68% of its GDP. This economic clout and strategic geopolitical stance position Germany as a focal point in the global cyber threat landscape.
In the face of escalating global tensions, particularly those emanating from geopolitical disputes with nations like hashtag#Russia and hashtag#China, hashtag#Germany has witnessed a significant uptick in targeted cyber operations. Our analysis indicates a marked increase in hashtag#cyberattack sophistication aimed at critical infrastructure and key industrial sectors. These attacks range from ransomware campaigns to hashtag#AdvancedPersistentThreats (hashtag#APTs), threatening national security and business integrity.
🔑 Key findings include:
🔍 Increased frequency and complexity of cyber threats.
🔍 Escalation of state-sponsored and criminally motivated cyber operations.
🔍 Active dark web exchanges of malicious tools and tactics.
Our comprehensive report delves into these challenges, using a blend of open-source and proprietary data collection techniques. By monitoring activity on critical networks and analyzing attack patterns, our team provides a detailed overview of the threats facing German entities.
This report aims to equip stakeholders across public and private sectors with the knowledge to enhance their defensive strategies, reduce exposure to cyber risks, and reinforce Germany's resilience against cyber threats.
Explore our comprehensive data analysis project presentation on predicting product ad campaign performance. Learn how data-driven insights can optimize your marketing strategies and enhance campaign effectiveness. Perfect for professionals and students looking to understand the power of data analysis in advertising. for more details visit: https://bostoninstituteofanalytics.org/data-science-and-artificial-intelligence/
Adjusting primitives for graph : SHORT REPORT / NOTESSubhajit Sahu
Graph algorithms, like PageRank Compressed Sparse Row (CSR) is an adjacency-list based graph representation that is
Multiply with different modes (map)
1. Performance of sequential execution based vs OpenMP based vector multiply.
2. Comparing various launch configs for CUDA based vector multiply.
Sum with different storage types (reduce)
1. Performance of vector element sum using float vs bfloat16 as the storage type.
Sum with different modes (reduce)
1. Performance of sequential execution based vs OpenMP based vector element sum.
2. Performance of memcpy vs in-place based CUDA based vector element sum.
3. Comparing various launch configs for CUDA based vector element sum (memcpy).
4. Comparing various launch configs for CUDA based vector element sum (in-place).
Sum with in-place strategies of CUDA mode (reduce)
1. Comparing various launch configs for CUDA based vector element sum (in-place).
Chatty Kathy - UNC Bootcamp Final Project Presentation - Final Version - 5.23...John Andrews
SlideShare Description for "Chatty Kathy - UNC Bootcamp Final Project Presentation"
Title: Chatty Kathy: Enhancing Physical Activity Among Older Adults
Description:
Discover how Chatty Kathy, an innovative project developed at the UNC Bootcamp, aims to tackle the challenge of low physical activity among older adults. Our AI-driven solution uses peer interaction to boost and sustain exercise levels, significantly improving health outcomes. This presentation covers our problem statement, the rationale behind Chatty Kathy, synthetic data and persona creation, model performance metrics, a visual demonstration of the project, and potential future developments. Join us for an insightful Q&A session to explore the potential of this groundbreaking project.
Project Team: Jay Requarth, Jana Avery, John Andrews, Dr. Dick Davis II, Nee Buntoum, Nam Yeongjin & Mat Nicholas
Show drafts
volume_up
Empowering the Data Analytics Ecosystem: A Laser Focus on Value
The data analytics ecosystem thrives when every component functions at its peak, unlocking the true potential of data. Here's a laser focus on key areas for an empowered ecosystem:
1. Democratize Access, Not Data:
Granular Access Controls: Provide users with self-service tools tailored to their specific needs, preventing data overload and misuse.
Data Catalogs: Implement robust data catalogs for easy discovery and understanding of available data sources.
2. Foster Collaboration with Clear Roles:
Data Mesh Architecture: Break down data silos by creating a distributed data ownership model with clear ownership and responsibilities.
Collaborative Workspaces: Utilize interactive platforms where data scientists, analysts, and domain experts can work seamlessly together.
3. Leverage Advanced Analytics Strategically:
AI-powered Automation: Automate repetitive tasks like data cleaning and feature engineering, freeing up data talent for higher-level analysis.
Right-Tool Selection: Strategically choose the most effective advanced analytics techniques (e.g., AI, ML) based on specific business problems.
4. Prioritize Data Quality with Automation:
Automated Data Validation: Implement automated data quality checks to identify and rectify errors at the source, minimizing downstream issues.
Data Lineage Tracking: Track the flow of data throughout the ecosystem, ensuring transparency and facilitating root cause analysis for errors.
5. Cultivate a Data-Driven Mindset:
Metrics-Driven Performance Management: Align KPIs and performance metrics with data-driven insights to ensure actionable decision making.
Data Storytelling Workshops: Equip stakeholders with the skills to translate complex data findings into compelling narratives that drive action.
Benefits of a Precise Ecosystem:
Sharpened Focus: Precise access and clear roles ensure everyone works with the most relevant data, maximizing efficiency.
Actionable Insights: Strategic analytics and automated quality checks lead to more reliable and actionable data insights.
Continuous Improvement: Data-driven performance management fosters a culture of learning and continuous improvement.
Sustainable Growth: Empowered by data, organizations can make informed decisions to drive sustainable growth and innovation.
By focusing on these precise actions, organizations can create an empowered data analytics ecosystem that delivers real value by driving data-driven decisions and maximizing the return on their data investment.
Ch03-Managing the Object-Oriented Information Systems Project a.pdf
Personal Loan Risk Assessment
1. Name: Kunal Kashyap
College: Indian Institute of Management Kashipur
Case:
Round 3: Grand Finale
Personal Loan Risk Assessment on
Two-Wheeler Loan Customer Base
2. Business Problem Snapshot
Business Problem
Approach taken
Objectives
• To identify the segment of customers, who have a higher
tendency to default, if they are offered a Personal Loan
• To leverage the existing Two-Wheeler Loan (TW) customer
base to cross sell the Personal Loan product
• To develop a prediction model to classify the customer
base into Risky and Non-Risky categories for rejecting and
considering them for PL offer respectively
Problem
Statement
Credit Process Flow
Analyzing data
Modelling
Cost-Benefit Analysis
Live loans
closed loans
enquiries Gender
Age
Interest rate
Tenure
EMI
MOB
First EMI Bounce
Total down payment
Total Loan amount
Two-Wheeler loans
Employment type
Number of times defaulted
Cost of Asset
bounces with TVS Credit
bounces in last 3 months
Available
data
Payment History of 1.2 Lakh Customers
Prediction Model will help in the classification
Recommendation
& Deployment
3. Methodology Used | Research Insights
Start
End
Key Highlight
Team Data
Science
Process
(TDSP)
methodology
has been used
for solving this
case
Business
Understanding
Modelling
Data acquisition
& Understanding
Deployment
Approach
TDSP methodology
• Small ticket personal loans (STPL) are considered as
personal loans of ticket size less than Rs 50,000
• STPL market – 12000 Cr as of Aug 2020 | Half of them is
for loans below Rs 5000
• TG - young, low income, digitally savvy customers who
have small ticket and short-term credit needs, and no or
limited credit history customers
• Demand driver -> millennials and young borrowers in
the age group 18-30 years
140 %
Growth in FY 2019 | Driven by STPL
segment
• Home renovation, wedding, higher education or
travel costs
• To meet a medical emergency et al.
End-use
Research Insights
• Alternative data – digital footprint of customers such
as Social media profile, mobile bill, Social scoring by
psychometric analysis through digital footprints
Sources: Microsoft TDSP methodology| Paisa bazaar | BCG report | Financial Express
Business Problem
Approach taken
Analyzing data
Modelling
Cost-Benefit Analysis
Recommendation
& Deployment
4. Data Wrangling, Exploration & Cleaning
Key Highlight
Ensemble
algorithm to
be used for
future work to
achieve higher
accuracy and
enhanced
business
opportunities
Features V1, V11,
V13, and V17 have
not been used for
modelling
technique
Transformation -
Data has been
normalized using
Min-Max method
One hot encoding
has been applied
on features
V15(Gender) and
V16(Employment)
Dataset was split
in equal
proportion for
Testing and
Training purpose
Four features –
V21, V22, V28,
and V29 were
removed due to
missing values or
very less data
A new feature
named ‘Age’ has
been created from
V18 and V18 is
removed
Random Over-
sampling and
Random Under-
sampling of minority
class and majority
class was performed
respectively due to
imbalanced nature
of dataset
Step 7
Step 6
Step 5
Step 4
Step 3
Step 2
We are left with
119,486
customers after
removing rows
with incomplete
data
Step 1
The data consists of past loan history of 119,529 customers; It has 30 features from various sources
Data Source
Business Problem
Approach taken
Analyzing data
Modelling
Cost-Benefit Analysis
Recommendation
& Deployment
5. Classification
Good Customer
(Non-default)
Bad Customer
(Default)
Random
Oversampling of
minority class
Random
Undersampling of
majority class
Modeling Architecture
Modified
dataset
Given
dataset
Loaded
dataset
Evaluation metrics
Test set
Training set
Random Forrest Model
Overall dataset
Other
Models
Logistic regression
Deep Neural Network
SMOTE using KNN for
minority class
generation
Random Forrest Model
Business Problem
Approach taken
Analyzing data
Modelling
Cost-Benefit Analysis
Recommendation
& Deployment
Architecture
Classification Model
Evaluation Metrics
6. Modelling: Random Forest
Features Description Importance Cumulative score
V27 Number of times defaulted in last 12 months 0.128 0.128
V26 Number of times defaulted in last 6 months 0.103 0.232
Age Age of customers 0.083 0.314
V25 Number of times defaulted in last 3 months 0.076 0.390
V7 Total down payment of existing loan 0.068 0.457
V8 EMI of existing loan 0.066 0.523
V6 Cost of Asset (existing loan) 0.064 0.588
V9 Total Loan amount of existing loan 0.061 0.649
V23 Number of closed loans 0.059 0.708
V14 Rate of interest for existing loan 0.054 0.761
V4 MOB (Month of business with TVS Credit) 0.051 0.813
Since our objective is to segregate the customers into two
categories, we will use a Classification Model to achieve this.
Random Forest Classifier
This method is an ensemble technique used for classification by
constructing multitude of decision trees on training set (we trained
model with 1000 trees with 99.9% accuracy on training set)
Below are the top 11 variables with higher importance in
building the model
From the Random Forest model, we identified the
parameters contributing significantly in classifying the risky
& non-risky customers. The Importance column in the table
shows the significance of parameters. Higher the value,
higher the impact!
Classification Model
Output Snapshot
Business Problem
Approach taken
Analyzing data
Modelling
Cost-Benefit Analysis
Recommendation
& Deployment
Architecture
Classification Model
Evaluation Metrics
Note: Python code files and API files are attached on Annexure slide
7. Evaluation Metrics: Confusion matrix provides a performance summary of the classifier
Evaluation metric on Training set
Accuracy Sensitivity Precision Specificity F1 Score MCC
99.94% 100% 99.80% 99.91% 99.91% 99.87%
True Negative
(TN)
True Positive
(TP)
False Positive
(FP)
False Negative
(FN)
34942 17618 31 0
Evaluation metric on Test set
Accuracy Sensitivity Precision Specificity F1 Score MCC
98.75% 99.82% 96.53% 98.22% 98.15% 97.24%
True Negative
(TN)
True Positive
(TP)
False Positive
(FP)
False Negative
(FN)
34524 17412 625 31
99.94% of customers were
correctly labelled by the Model
Of all the customers, who were
predicted of defaulting on loan
payment, 99.80% defaulted
The Model predicted 100%
customers correctly who could
default on loan payment
Of all the customers, 99.91% of
non-defaulters were correctly
labelled by the Model
98.75% of customers were
correctly labelled by the Model
Of all the customers, who were
predicted of defaulting on loan
payment, 96.53% defaulted
The Model predicted 99.82%
customers correctly who could
default on loan payment
Of all the customers, 98.22% of
non-defaulters were correctly
labelled by the Model
Notes: MCC – Matthew Correlation Coefficient
Business Problem
Approach taken
Analyzing data
Modelling
Cost-Benefit Analysis
Recommendation
& Deployment
Architecture
Classification Model
Evaluation Metrics
8. Business Metrics
Note:
V6: Cost of
Asset (existing
loan)
V7: Total
down
payment of
existing loan
V8: EMI of
existing loan
V10: Tenure of
existing loan:
Evaluation metric on Original full dataset
Accuracy Sensitivity Precision Specificity F1 Score MCC
98.80% 99.89% 64.69% 99.78% 78.53% 79.89%
True Negative
(TN)
True Positive
(TP)
False Positive
(FP)
False Negative
(FN)
115446 2611 1425 3
98.80% of customers were
correctly labelled by the Model
Of all the customers, who were
predicted of defaulting on loan
payment, 64.69% defaulted
The Model predicted 99.89%
customers correctly who could
default on loan payment
Of all the customers, 99.78% of
non-defaulters were correctly
labelled by the Model
Business
metrics
Particulars Business Value
Avg. loan amount (V9) 39322
No. of defaults (V30) 2614
Total loss (without model) 102787708
Avg. loan amount 39322
No. of defaults (model_FN) 3
Total loss with defaults_model 117966
Opportunity loss( # customers)_FP 1425
value lost (V10*V8 + V7 -V6 ) 258
opportunity loss with model 367650
Total loss with model 485616
Loss saved with modelling 102302092
Percentage of loss saved 99.53%
Net Profit
(-72634990)
Total Profit
(30152718)
Total Loss
(102787708)
Without Model With Proposed Model
Net Profit
(29299452)
Total Profit
(29785068)
Total Loss
(485616)
With proposed model, We are making transition
from approx. - 7 crore to +3 crore in profits.
We are saving around 99.5% in losses from using the RF model
Business Problem
Approach taken
Analyzing data
Modelling
Cost-Benefit
Analysis
Recommendation
& Deployment
9. Deployment
Recommendations
• It is recommended to use
analytical model like the
proposed one to save losses for
this initiative
• Alternative data – Digital
footprint of customers such as
Social media profile, Social scoring
by psychometric analysis through
digital footprints to be used
Business Problem
Approach taken
Analyzing data
Modelling
Cost-Benefit Analysis
Recommendation
& Deployment
Call POST: Created API is called using POST where it displays HTML page to enter the input of feature. Post execution, console will let us know
the output based on model.
12. Feature Feature Definition
V1 Customer's ID
V2 First EMI Bounce (0 : No, 1: Yes) (existing loan)
V3 Number of bounces in last 3 months Outside TVS Credit
V4 MOB (Month of business with TVS Credit)
V5 Number of bounces with TVS Credit
V6 Cost of Asset (existing loan)
V7 Total down payment of existing loan
V8 EMI of existing loan
V9 Total Loan amount of existing loan
V10 Tenure of existing loan
V11 Customer's Geographical Area Code
V12 Customer's TW Dealer's Code
V13 Customer's TW Model’s Code
V14 Rate of interest for existing loan
V15 Gender
V16
Employment type of customer (SAL : Salaried, SELF : Self-employed, HOUSEWIFE, PENS :
Pensioner, STUDENT)
V17 Pin code
V18 Date of Birth
V19 Number of Live loans
V20 Number of Two-Wheeler loans
V21 Maximum sanction amount of Live Loans
V22 Number of new loans taken in last 3 months
V23 Number of closed loans
V24 Number of enquiries
V25 Number of times defaulted in last 3 months
V26 Number of times defaulted in last 6 months
V27 Number of times defaulted in last 12 months
V28 Maximum loan amount sanctioned for any Gold loan
V29 Maximum loan amount sanctioned for any personal loan
V30 Target variable ( 1: Bad Customer / 0 : Good Customer )
Assumptions:
• Complete EMI duration has been
taken irrespective of at what point
customer is going default due to lack
of information
• This conservative approach should be
offset by the depreciation of assets
• Avg. loan amount and avg. tenure are
considered for calculation
Data Dictionary
Python Code