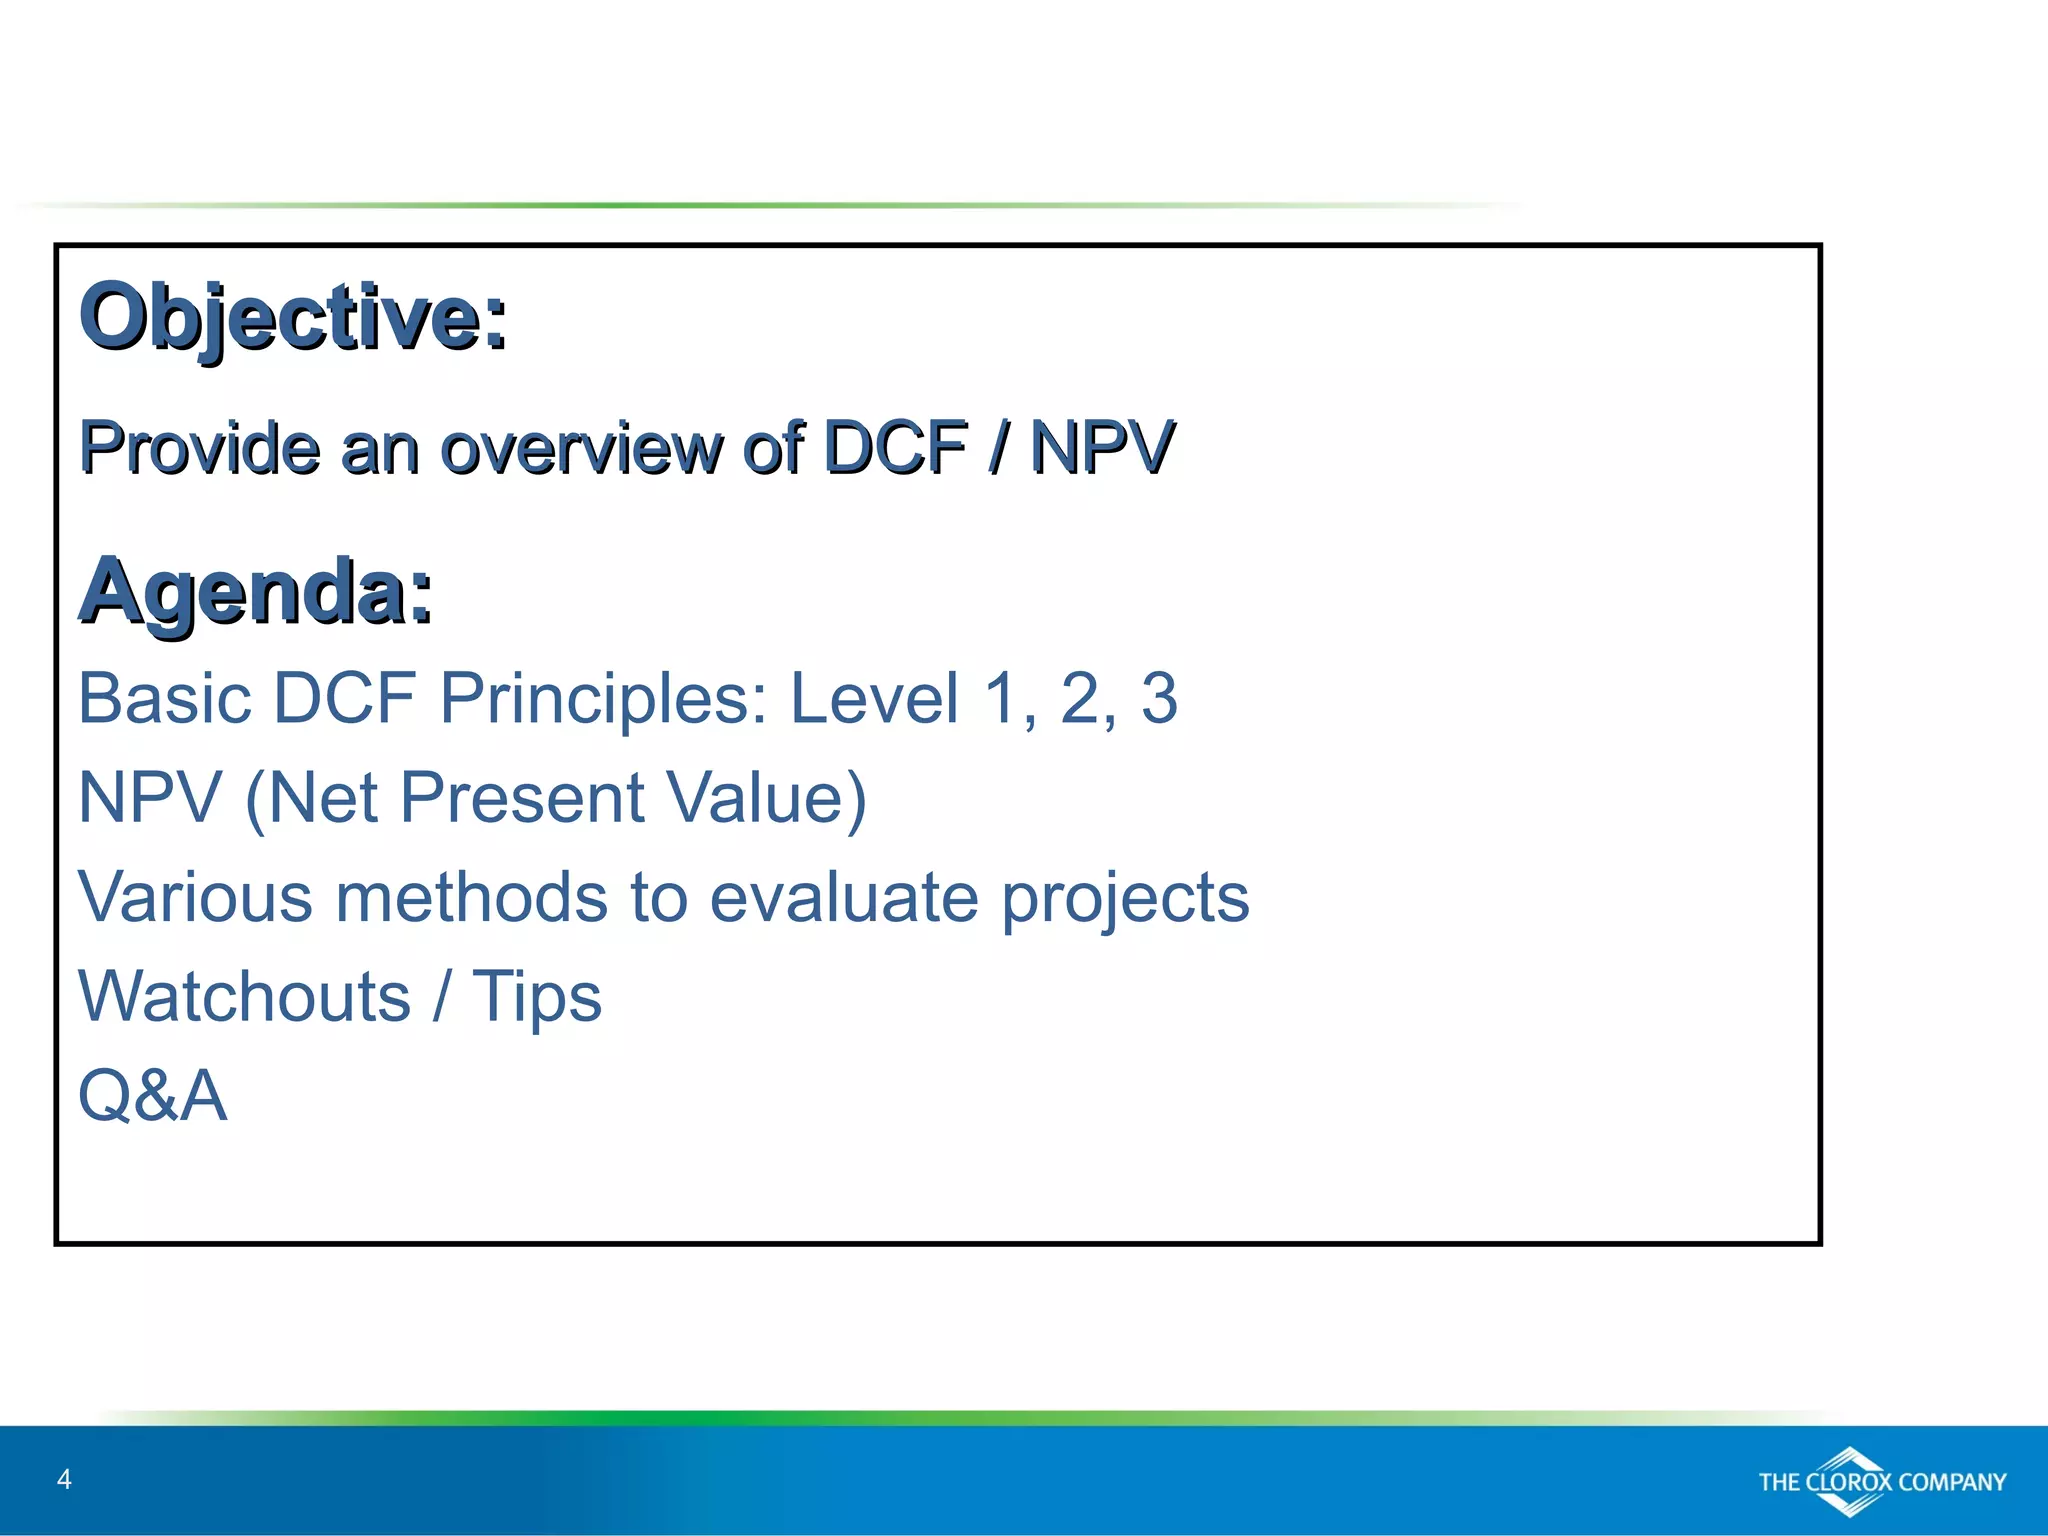
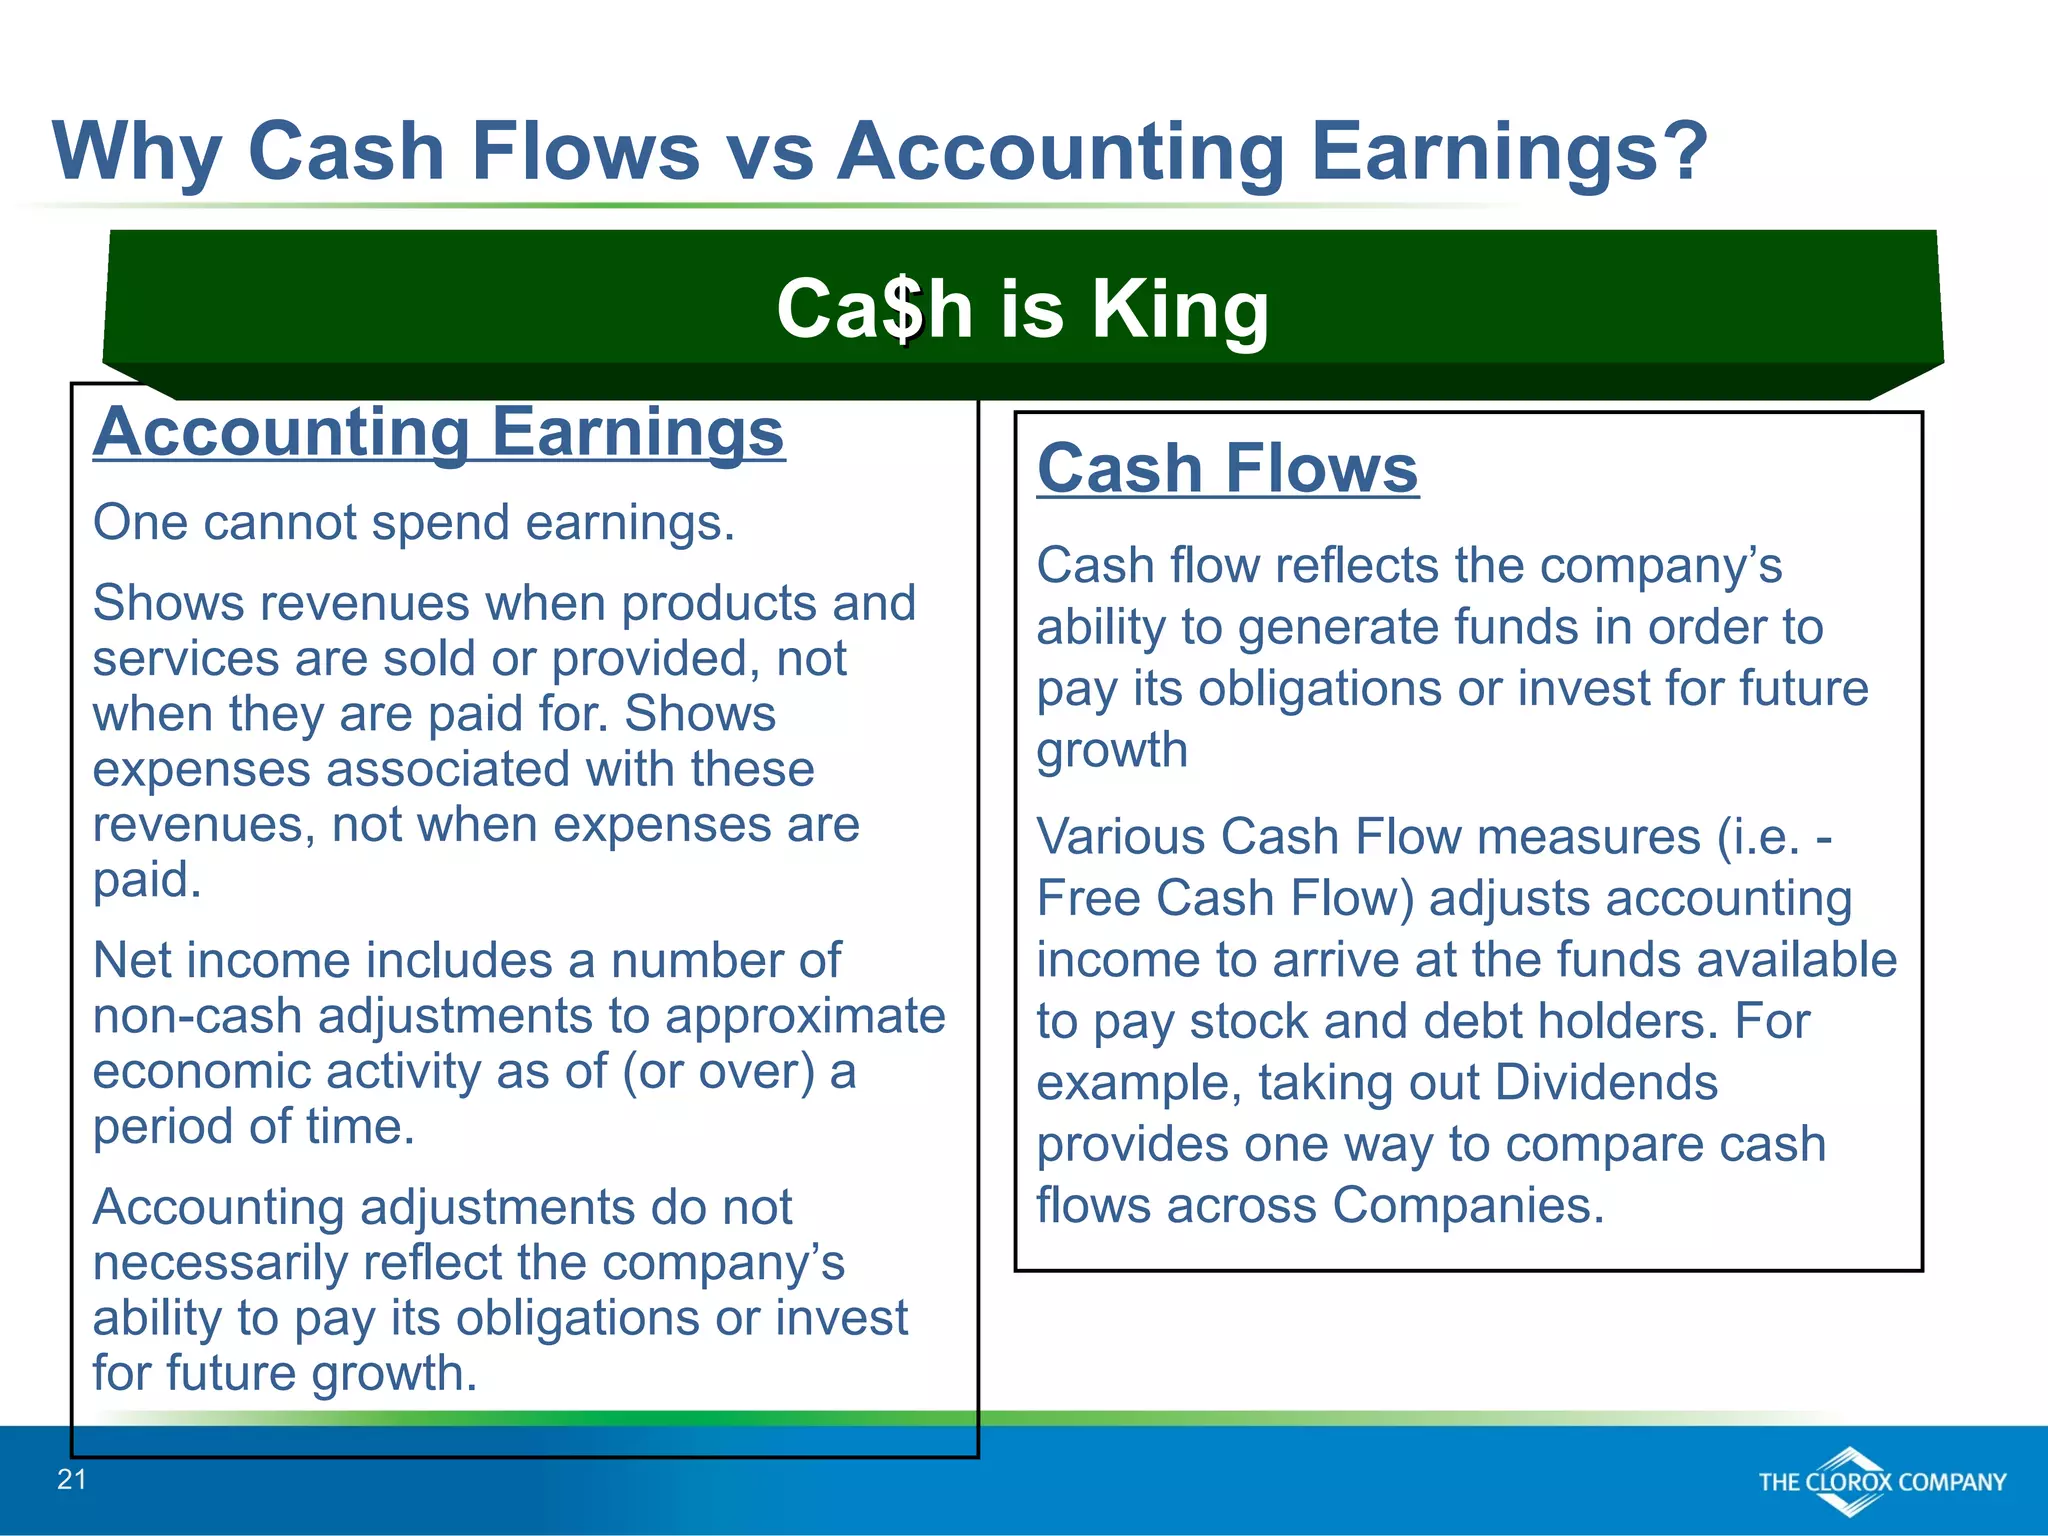
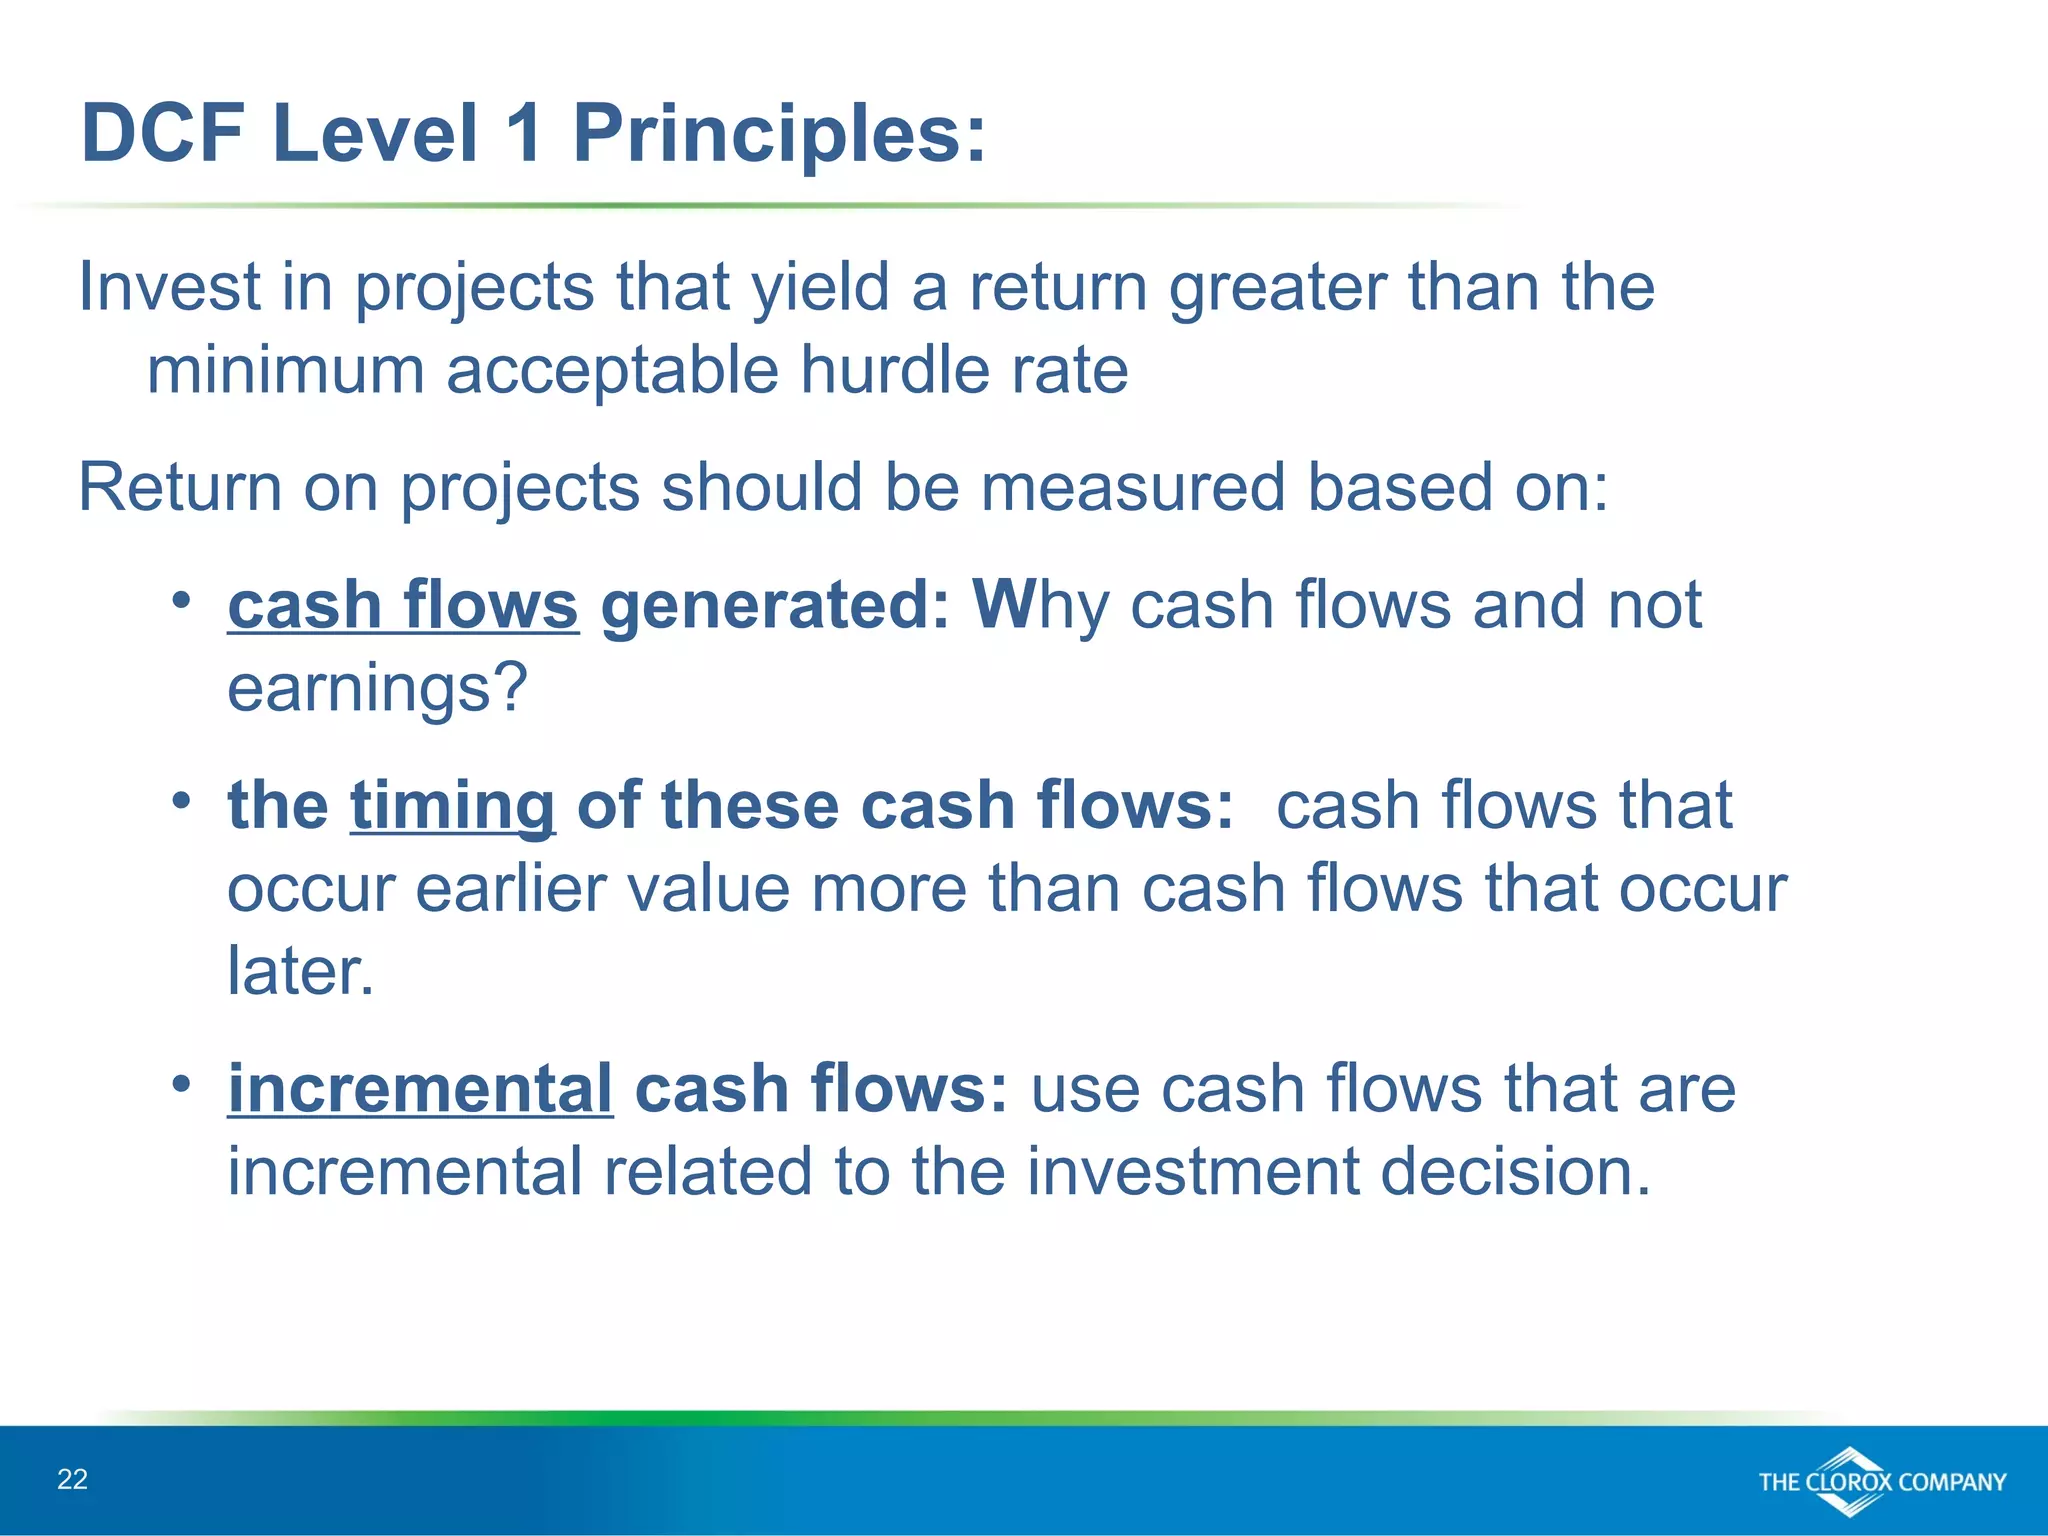
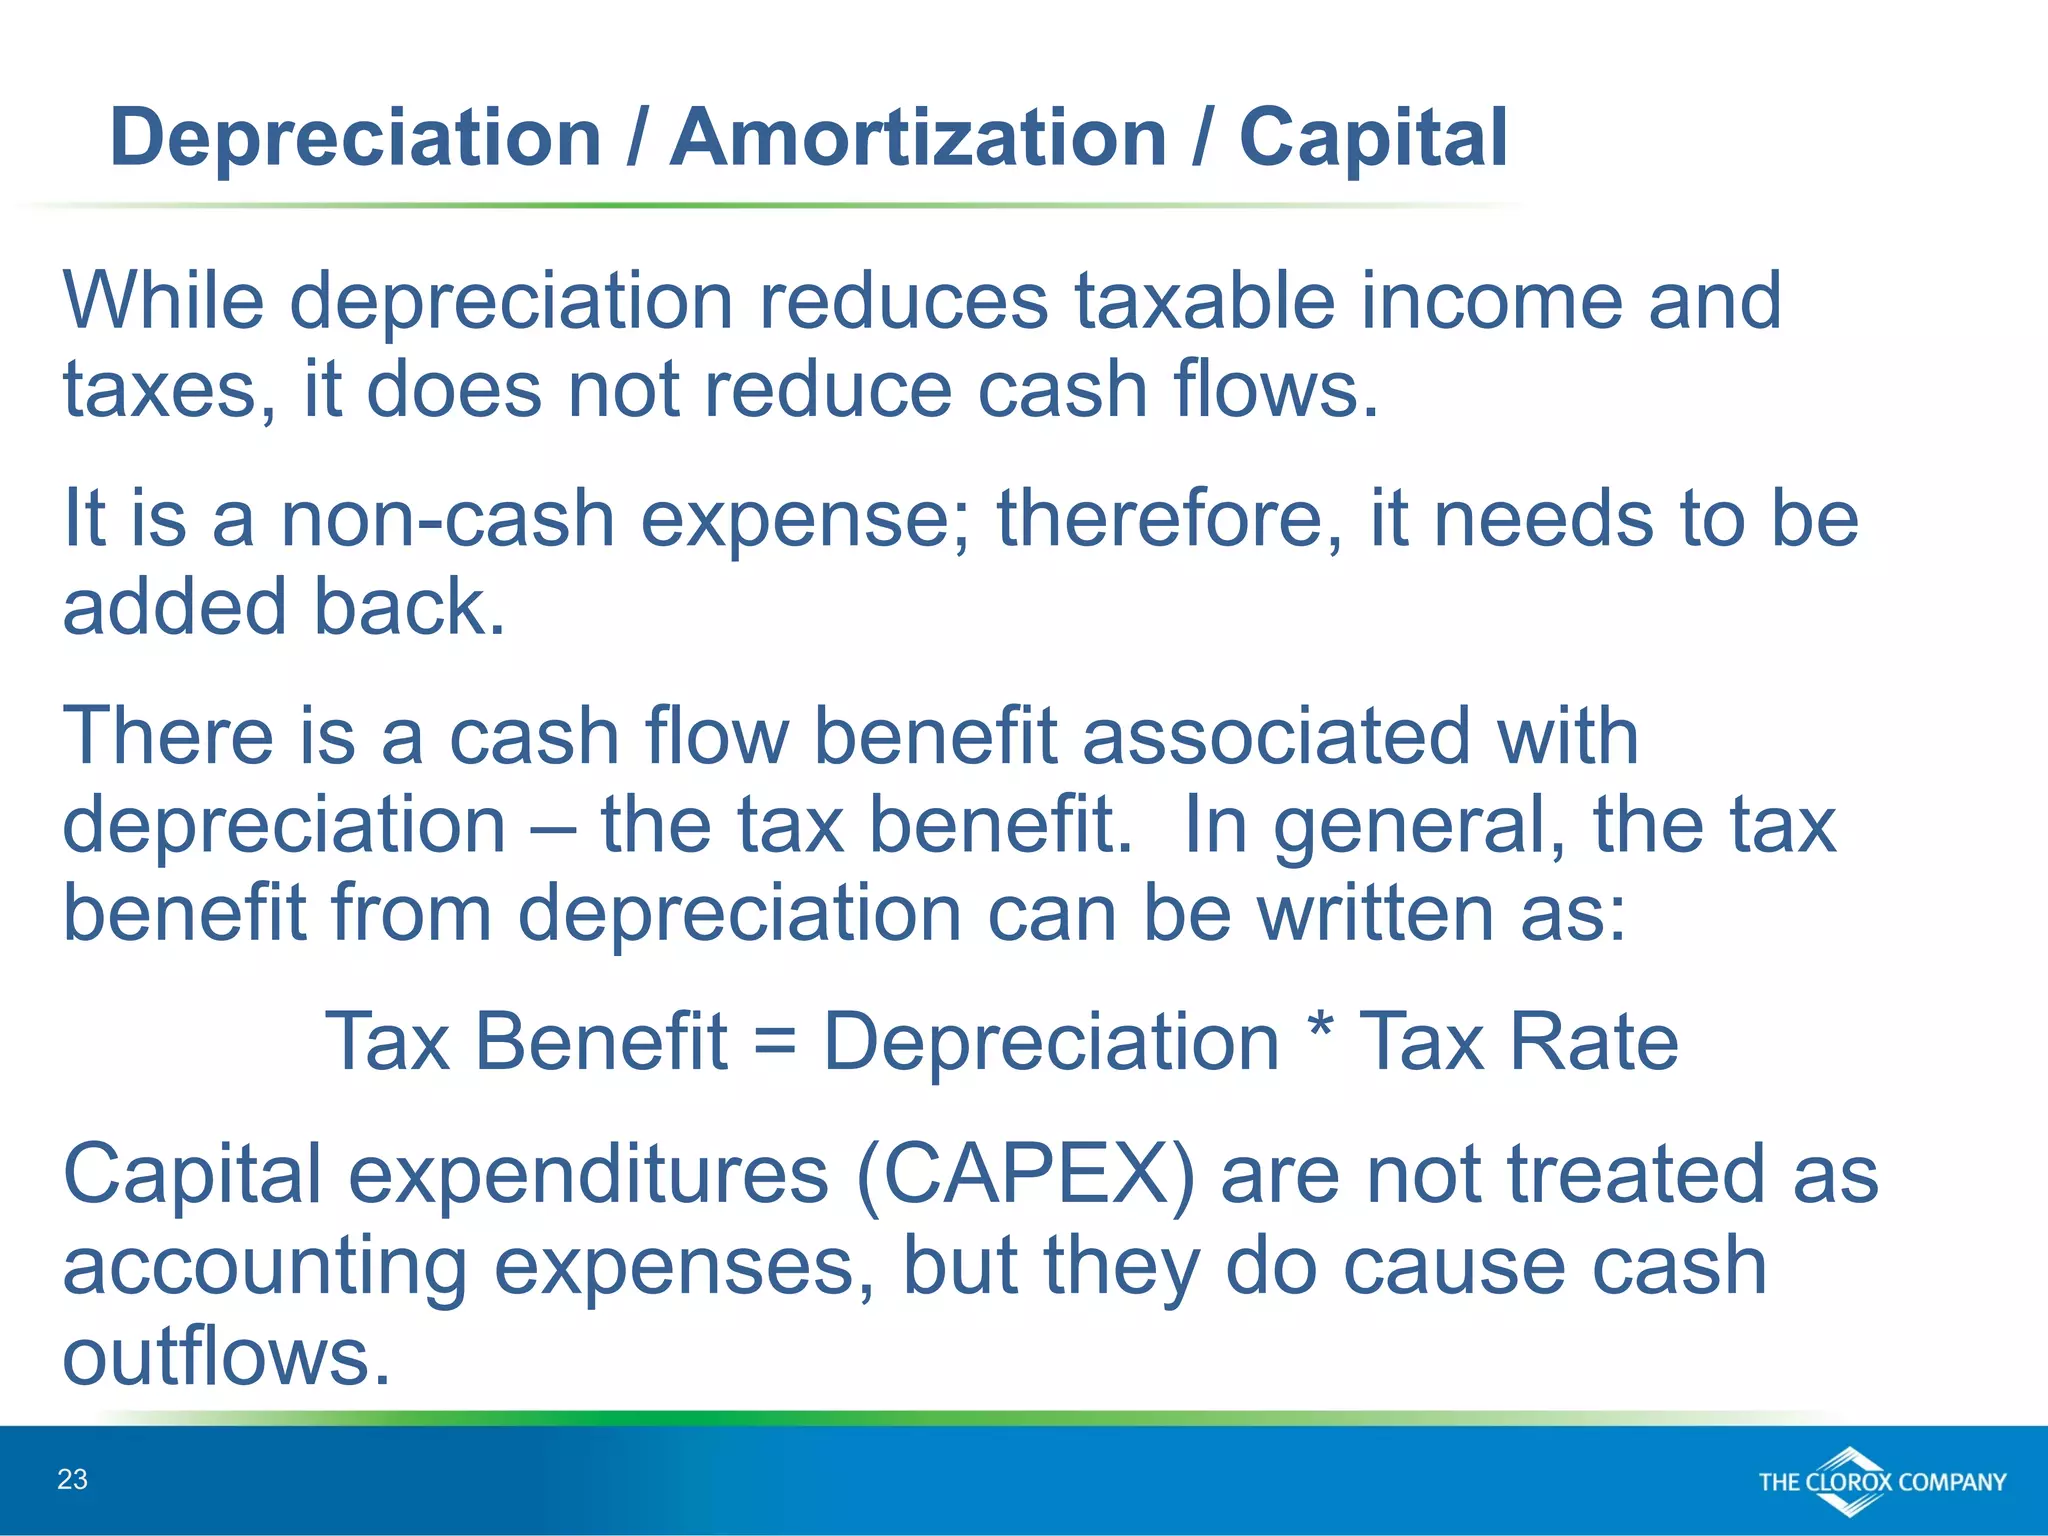
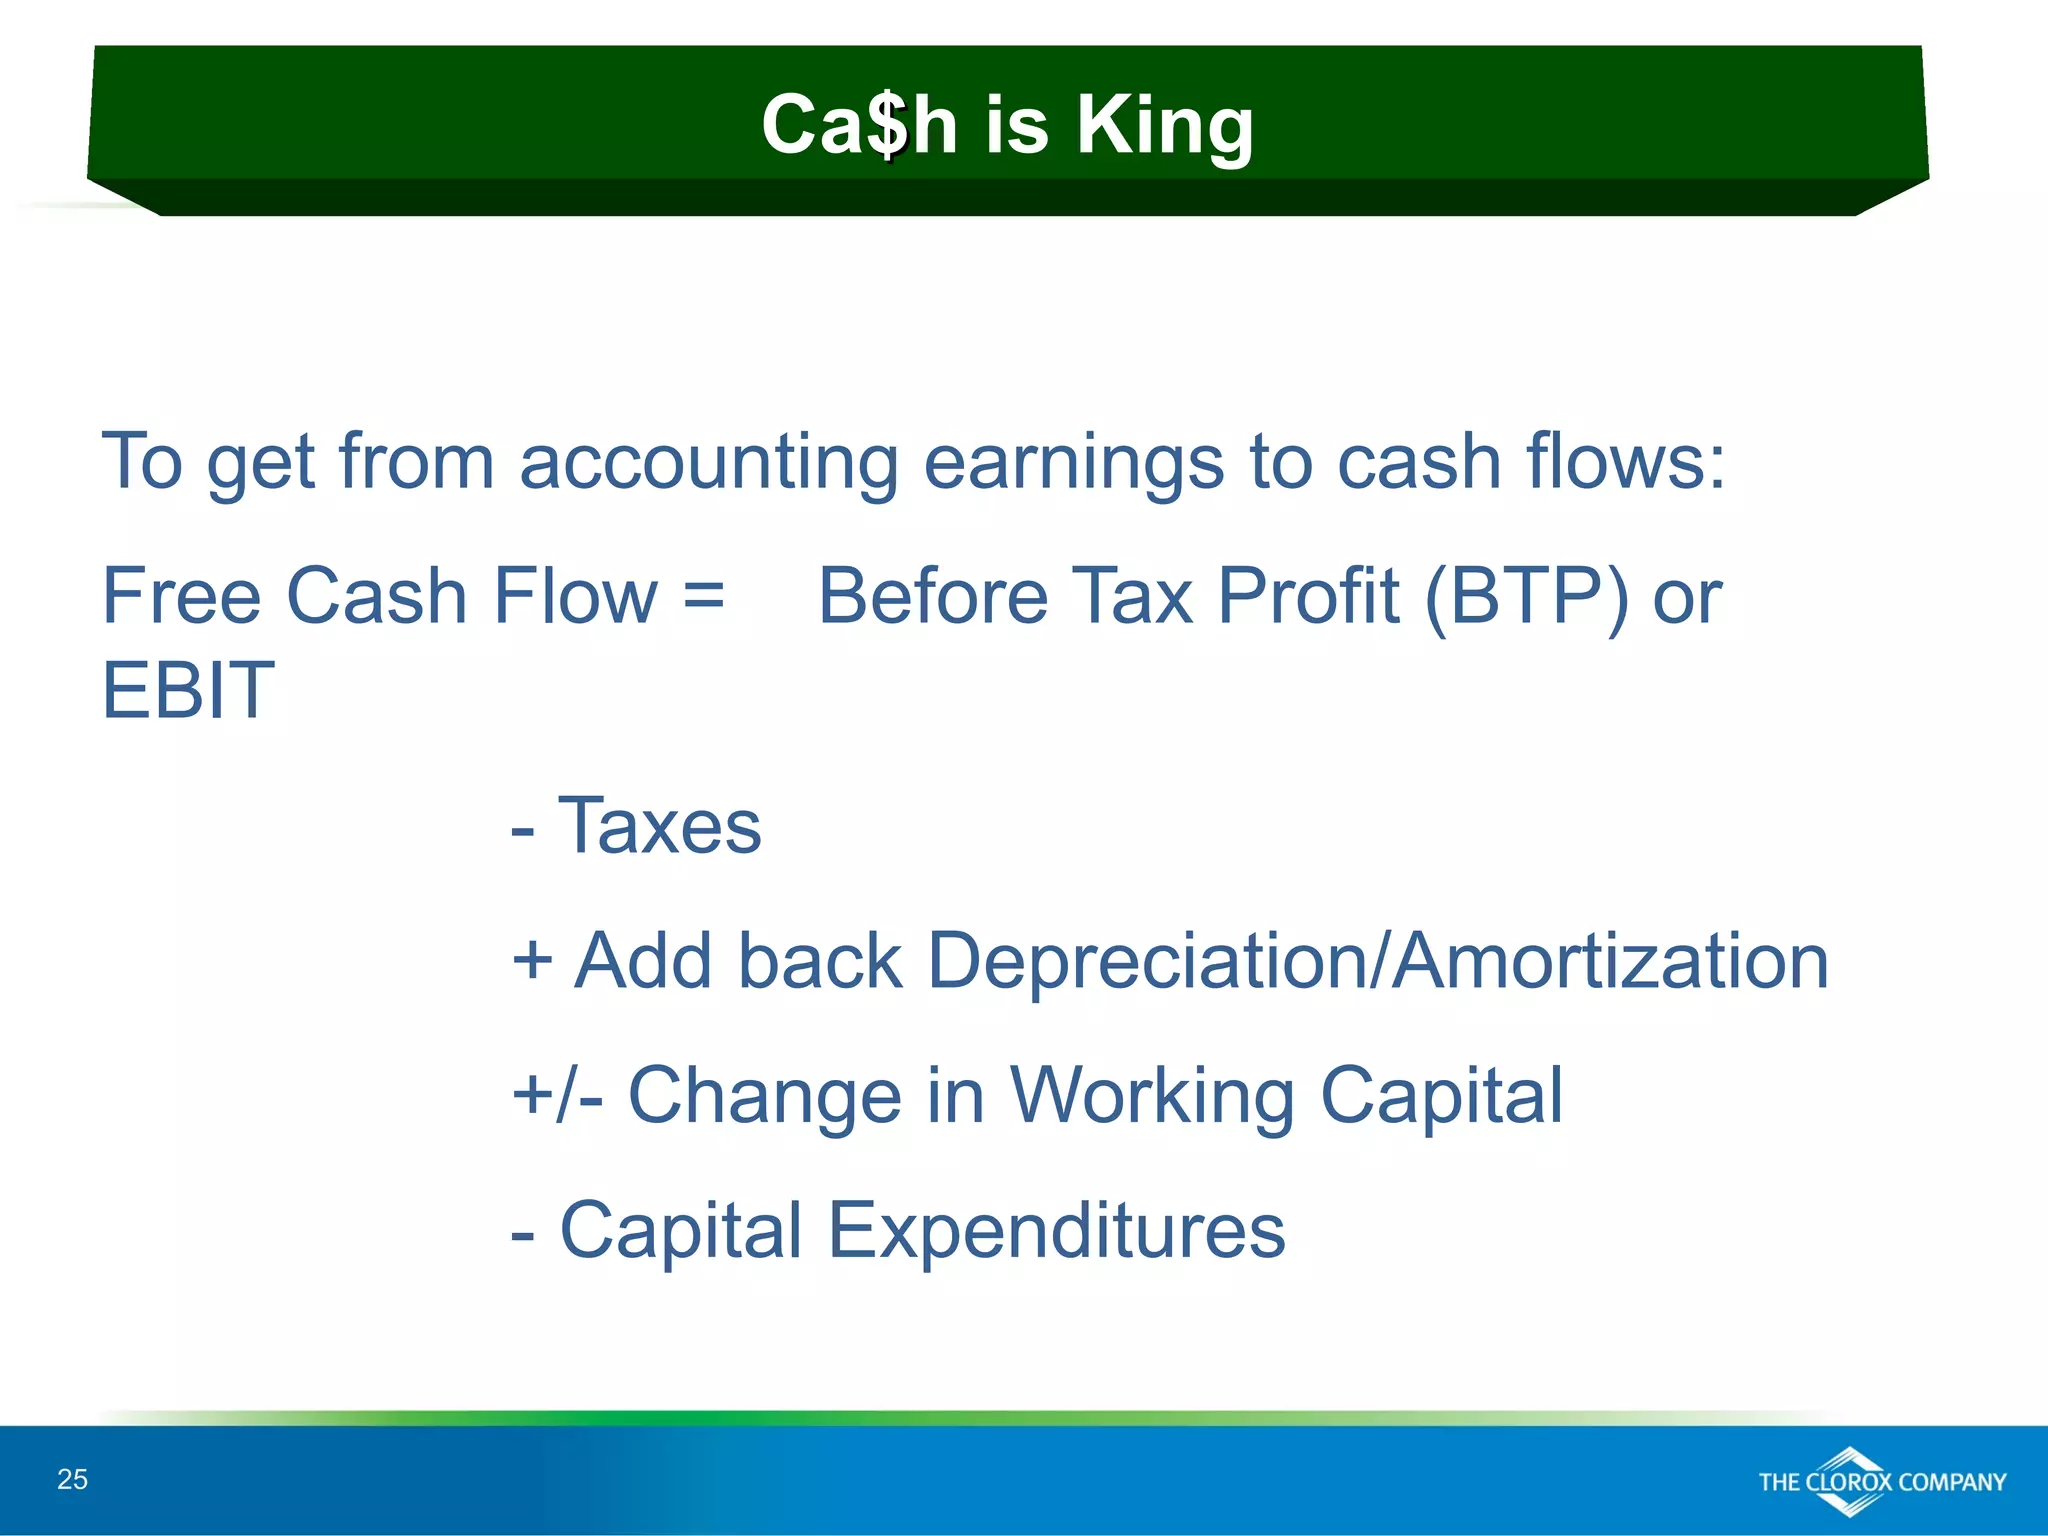
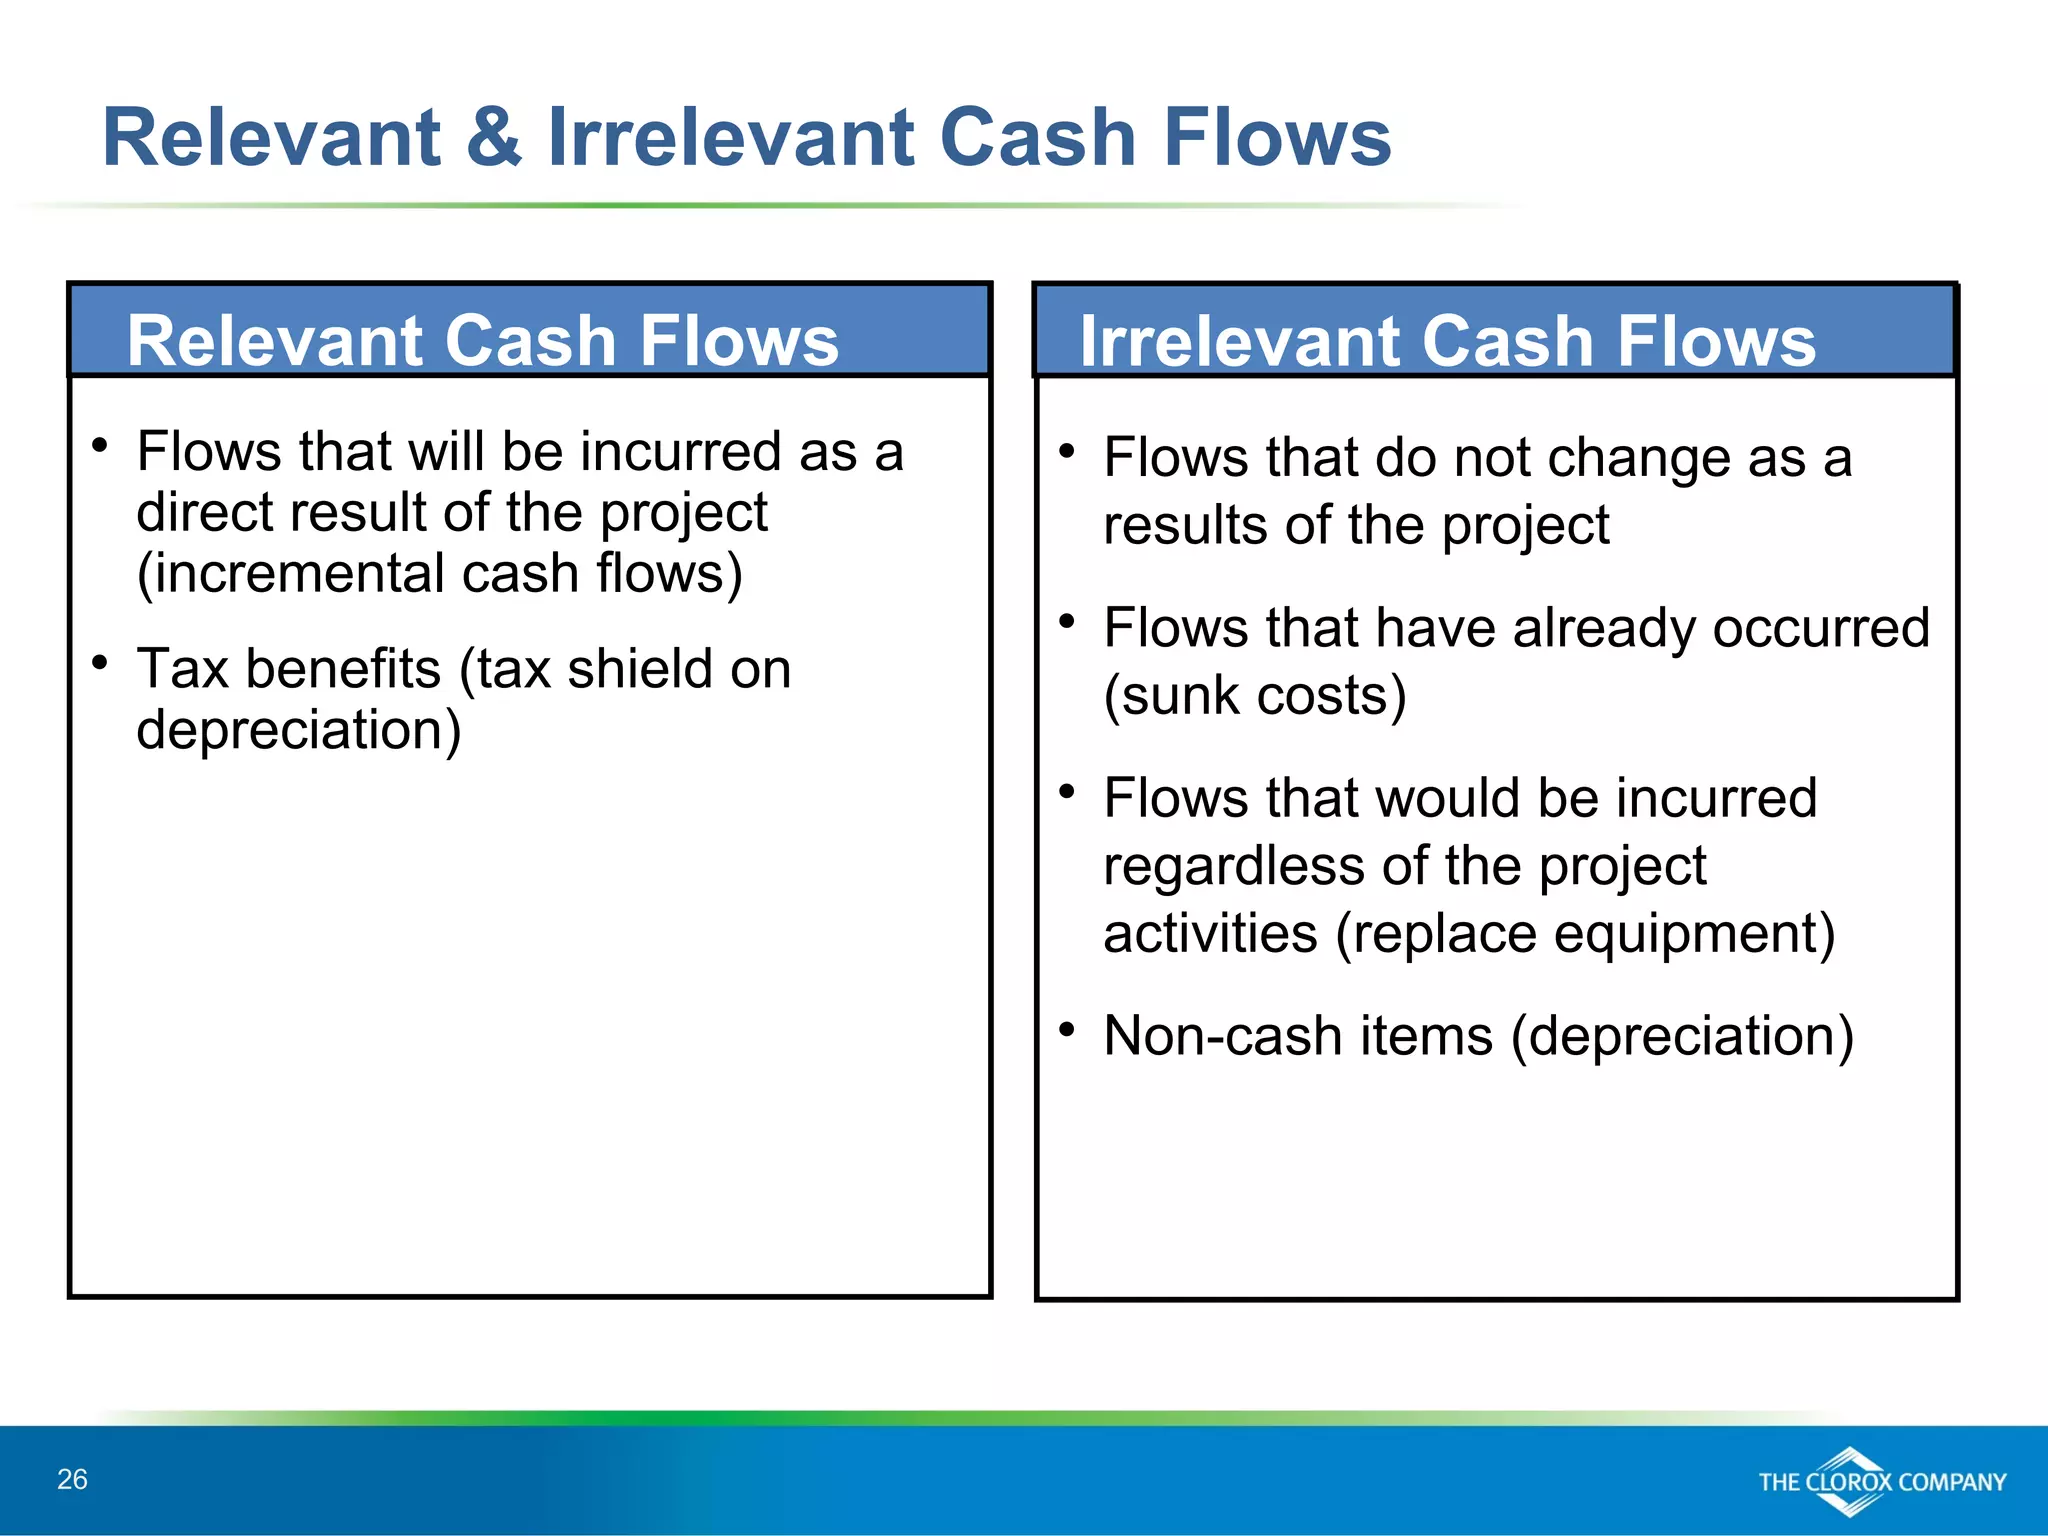
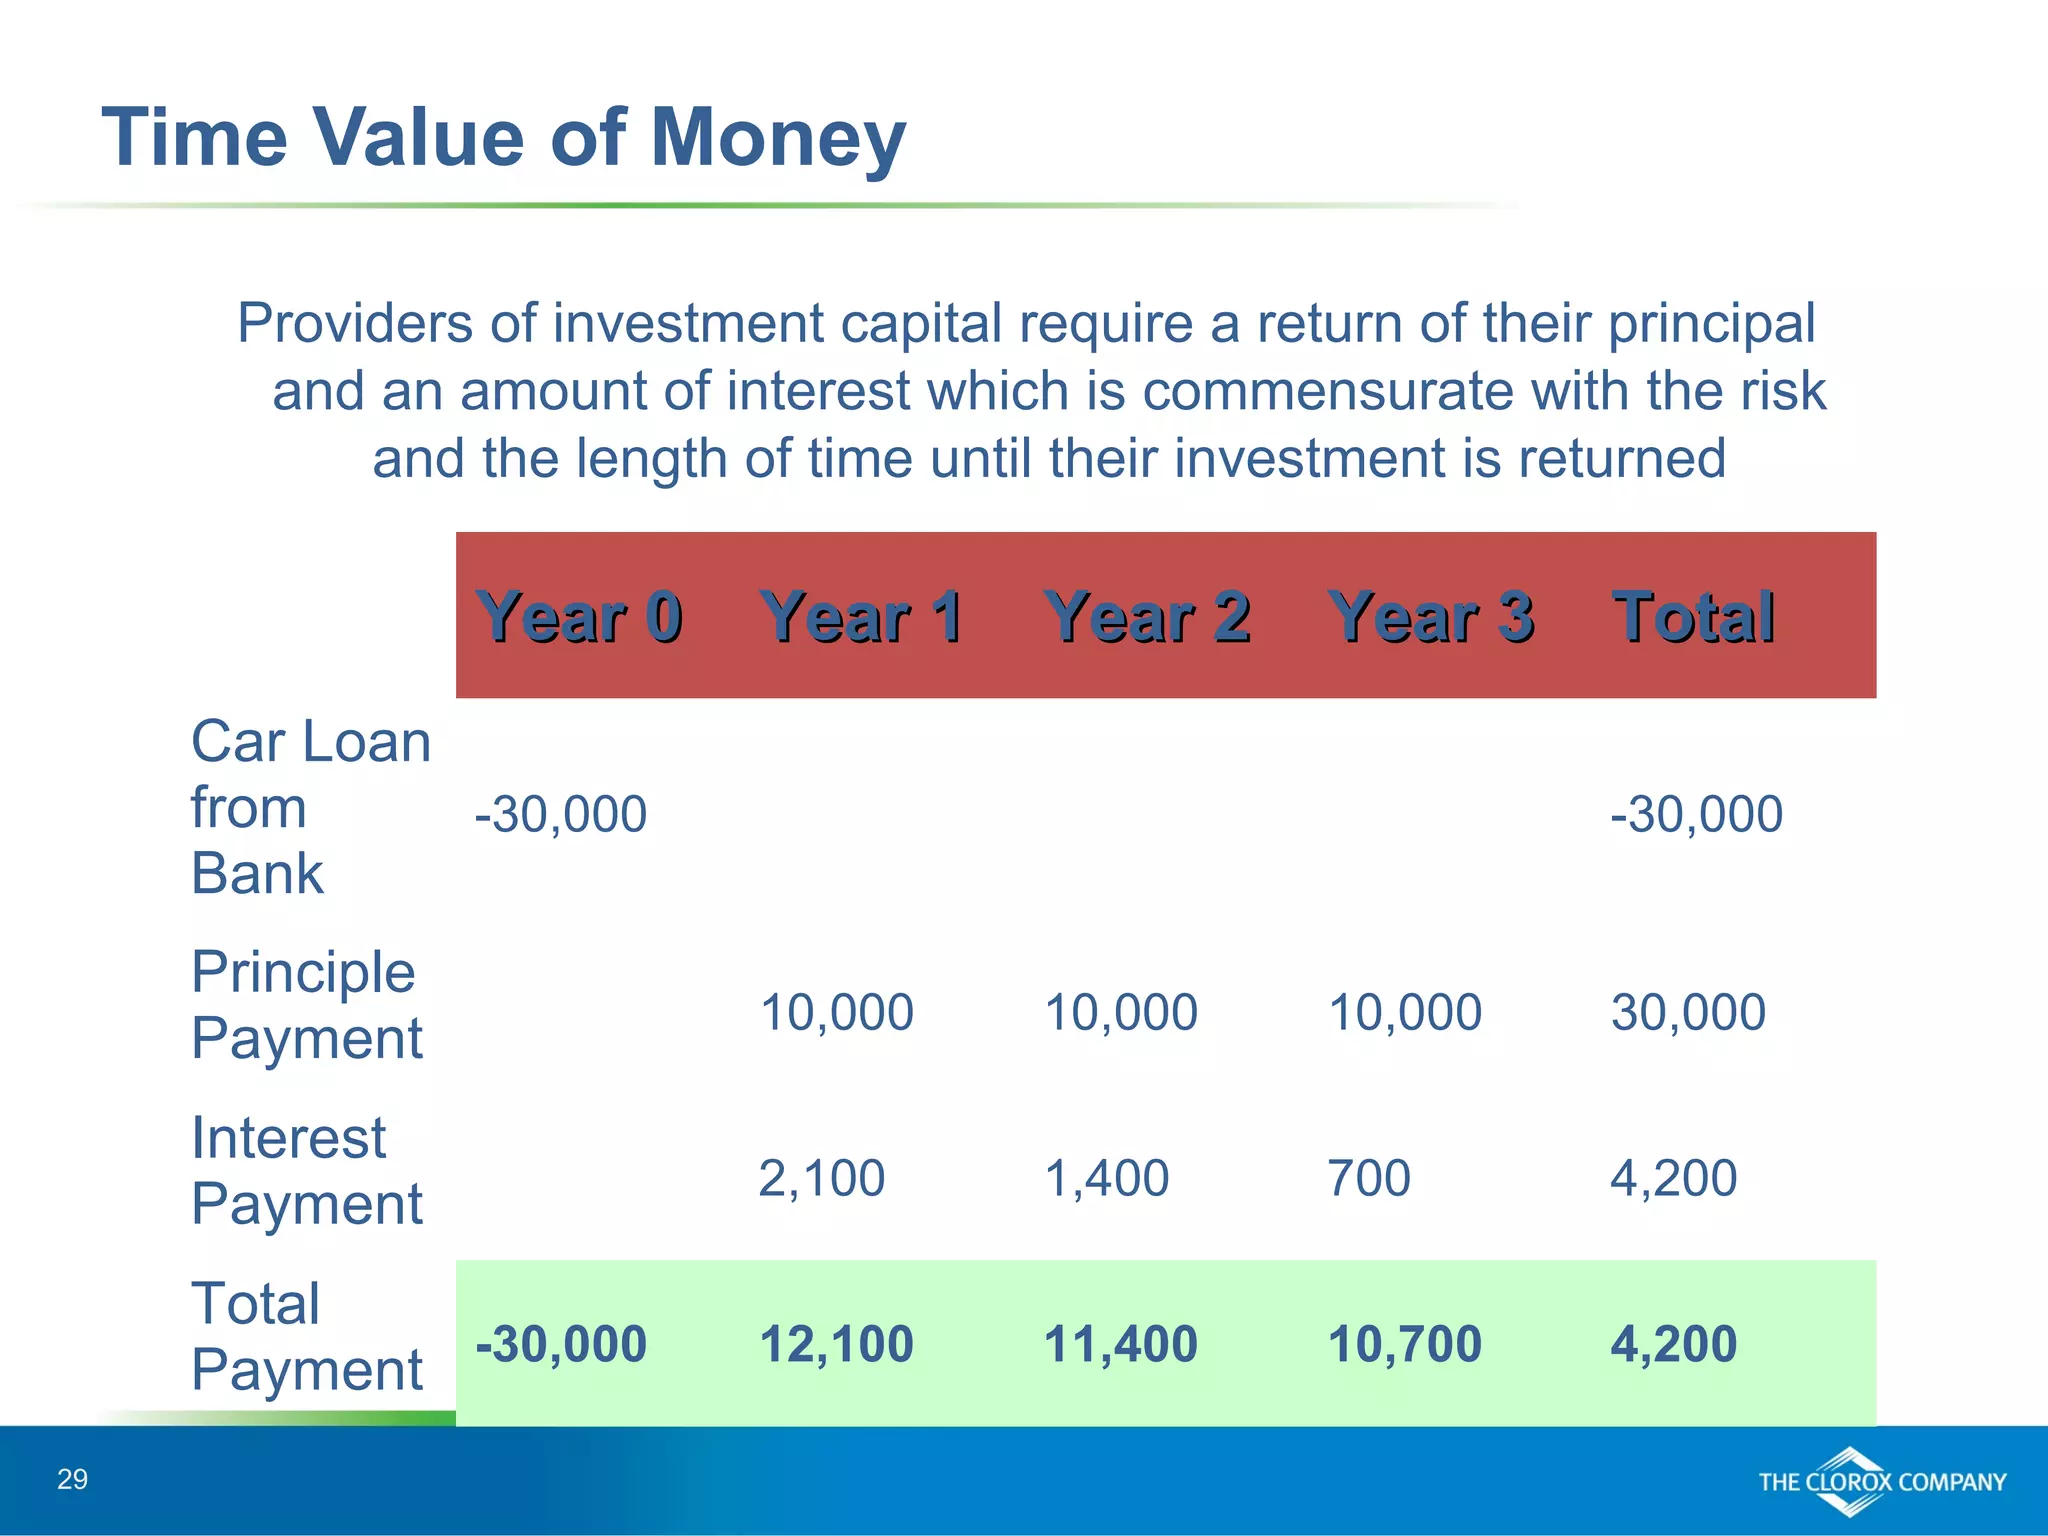
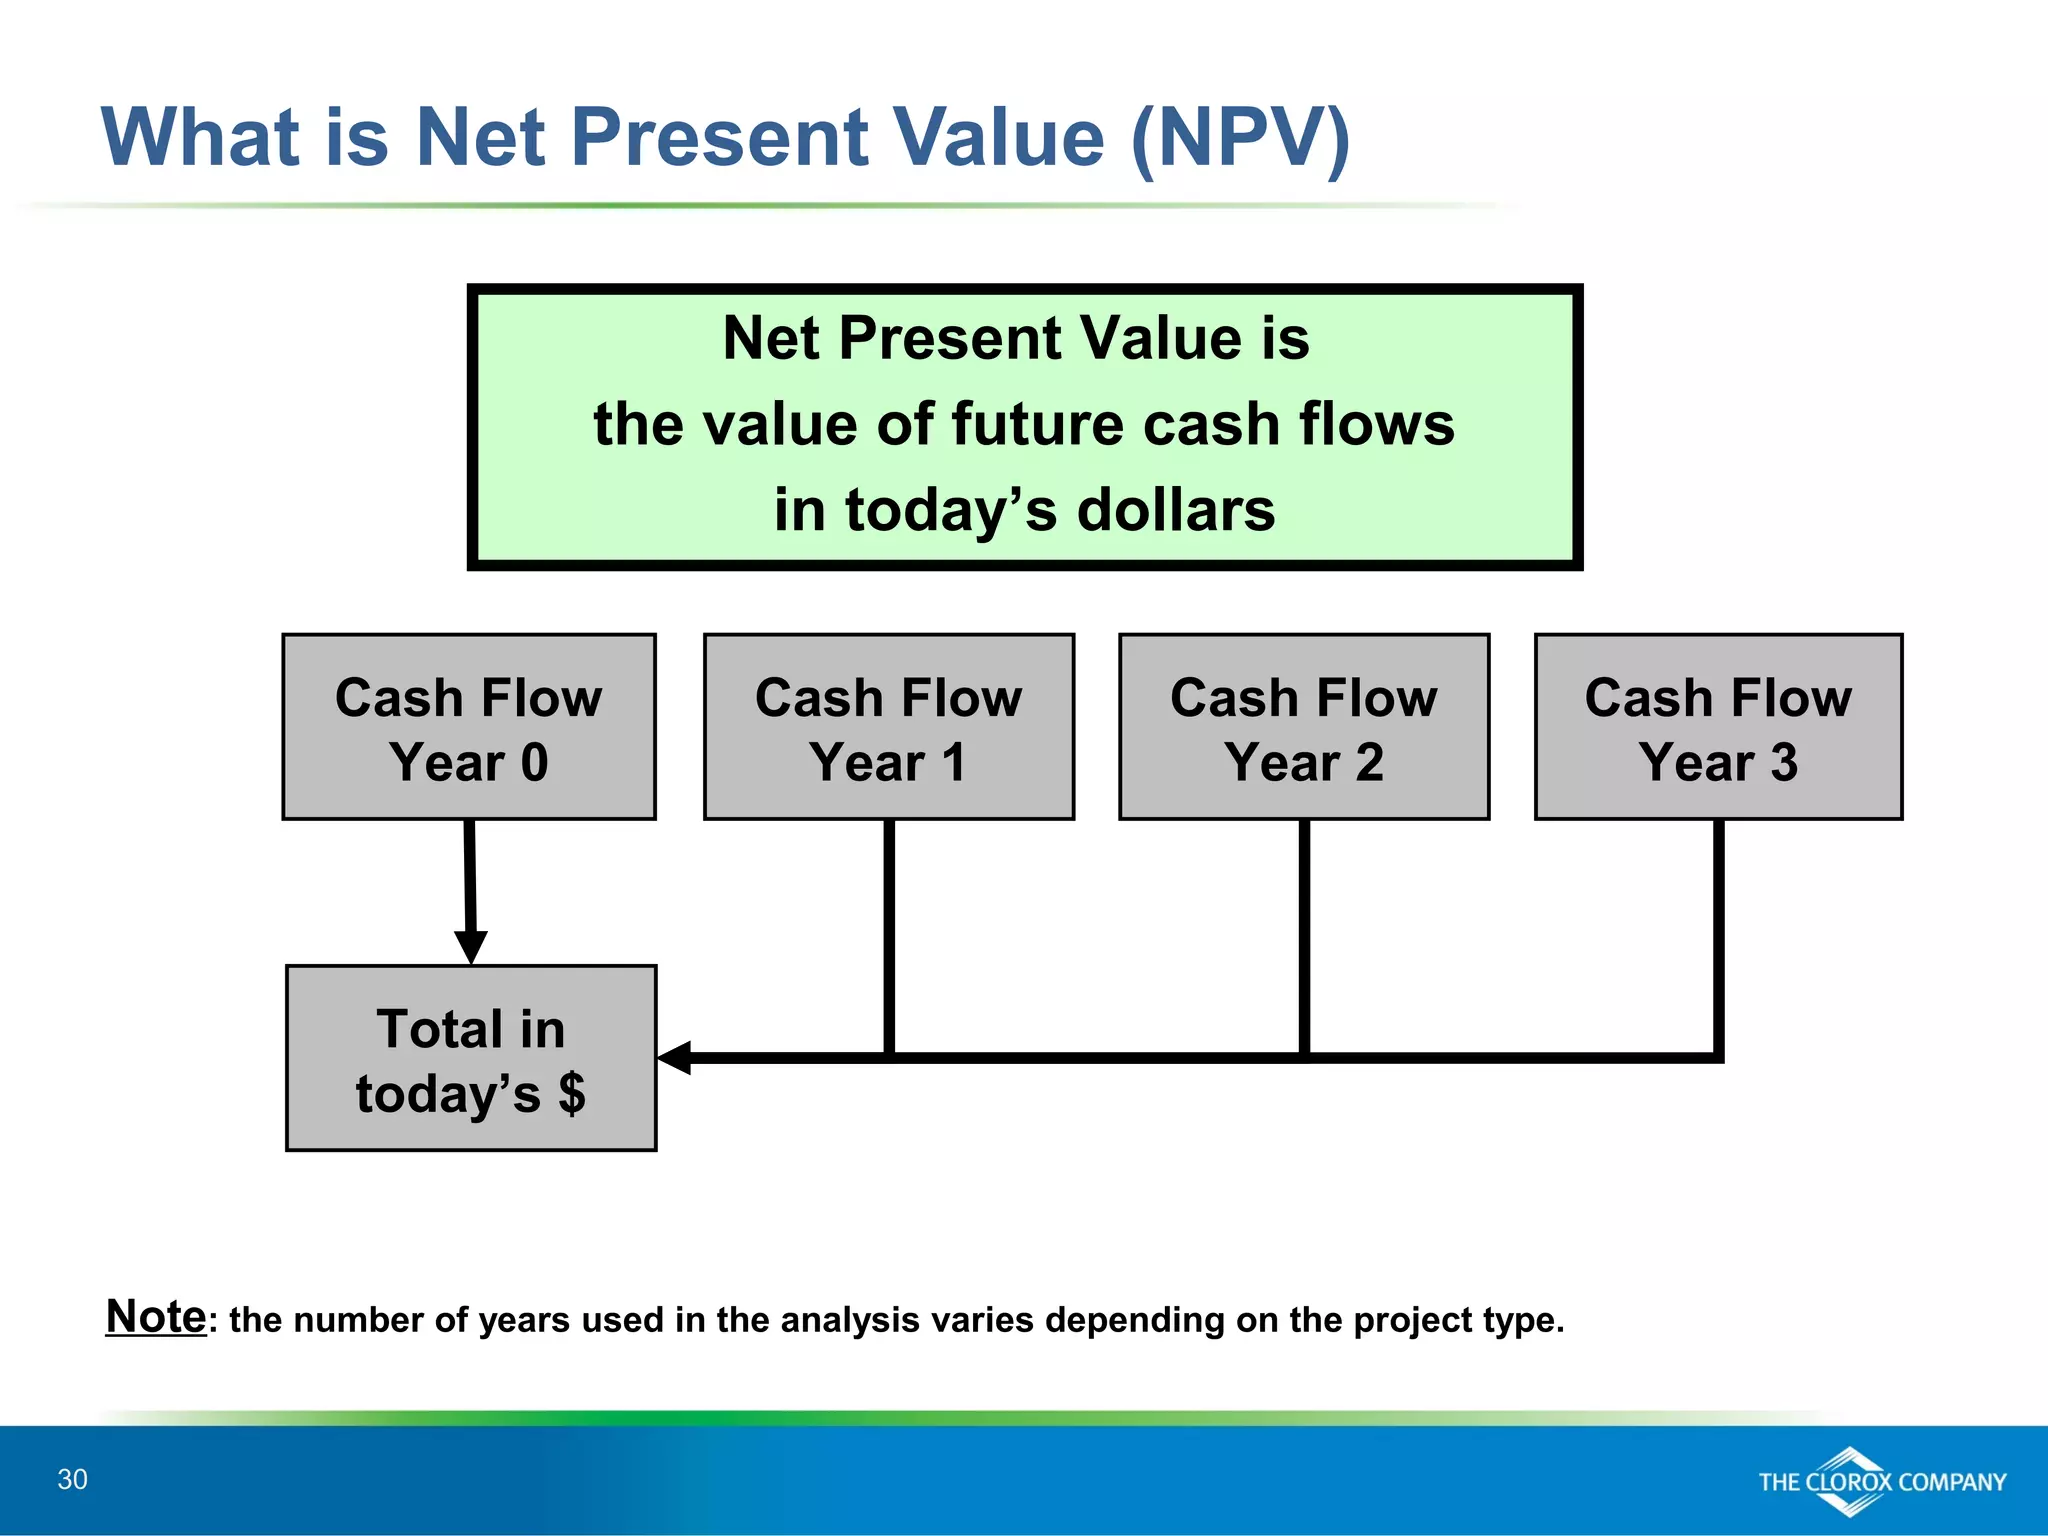
3. 3
DCF Thought
DCF is like Chess. The concept is relatively easy to
understand. Becoming good at DCF / NPV
analysis takes practice. To become a master takes
dedication, time, and effort.
Today, we will focus on learning the fundamentals,
and introduce you to some of the more advanced
concepts. For those who wish to become a Grand
Master, we have plenty of resources to guide you.
4. 4
Objective:Objective:
Provide an overview of DCF / NPVProvide an overview of DCF / NPV
Agenda:Agenda:
Basic DCF Principles: Level 1, 2, 3
NPV (Net Present Value)
Various methods to evaluate projects
Watchouts / Tips
Q&A
5. 5
DCF Level 1 = Castling
Castling
•A special move involving both the king and one
rook. Its purpose is generally to protect the king
and develop the rook. Castling on the kingside is
sometimes called castling short and castling on
the queenside is called castling long; the
difference is based on whether the rook moves a
short distance (two squares) or a long distance
(three squares).
6. 6
DCF / Chess Thought: diagrams / pictures
help drive home the thought.
Move Rook immediately next to the King on its opposite side:
7. 7
DCF:
Investment A Investment B
Cash is a scarce resource. Discounted Cash Flow Analysis provides
a basis to compare different investment options.
Which
investment is
better?
8. 8
DCF Level 1 Principles:
Discounted cash flow (DCF) analysis is a method of
valuing a project (or a Company) using the concept of
time value of money and risk:
• $1 today is worth more than $1 a year from today;
• Cash invested in a project is riskier than a US T-Bill, or
some other ‘risk free’ investment.
9. 9
DCF Level 2 = En Passant
En passant
•("in the act of passing"; derived from French) The
rule that allows a pawn that has just advanced
two squares to be captured by a pawn on the
same rank and adjacent file. The pawn is
therefore taken as if it had only moved one
space. It is only possible to take en passant on
the next move.
12. 12
Fianchetto
•Refers to a bishop developed to the second
square and the longest diagonal on the file of the
adjacent knight (that is, b2 or g2 for white, b7 or
g7 for black), or the process of developing a
bishop to such a square. It usually occurs after
moving the pawn on that file ahead one square
(or perhaps two). The Italian word is actually a
noun ("in fianchetto") and not a verb.
13. 13
Fianchetto means “to flank”. It refers to a
move where the bishop is placed on the
longest diagonal it can attack.
14. 14
DCF Level 3 Thoughts:
• Monte Carlo Simulation
• Decision Tree + NPV
19. 19
Cash Flow versus Earnings?
Why and when did the use of Cash
Flows versus Earnings come into
practice?
20. 20
Cash Flow versus Earnings?
Discounted cash flow was first formally
articulated in 1938 after the market
became wary of relying on reported
income, or any measure of value
besides cash.
21. 21
Why Cash Flows vs Accounting Earnings?
Accounting Earnings
One cannot spend earnings.
Shows revenues when products and
services are sold or provided, not
when they are paid for. Shows
expenses associated with these
revenues, not when expenses are
paid.
Net income includes a number of
non-cash adjustments to approximate
economic activity as of (or over) a
period of time.
Accounting adjustments do not
necessarily reflect the company’s
ability to pay its obligations or invest
for future growth.
Cash Flows
Cash flow reflects the company’s
ability to generate funds in order to
pay its obligations or invest for future
growth
Various Cash Flow measures (i.e. -
Free Cash Flow) adjusts accounting
income to arrive at the funds available
to pay stock and debt holders. For
example, taking out Dividends
provides one way to compare cash
flows across Companies.
Ca$$h is King
22. 22
DCF Level 1 Principles:
Invest in projects that yield a return greater than the
minimum acceptable hurdle rate
Return on projects should be measured based on:
• cash flows generated: Why cash flows and not
earnings?
• the timing of these cash flows: cash flows that
occur earlier value more than cash flows that occur
later.
• incremental cash flows: use cash flows that are
incremental related to the investment decision.
23. 23
Depreciation / Amortization / Capital
While depreciation reduces taxable income and
taxes, it does not reduce cash flows.
It is a non-cash expense; therefore, it needs to be
added back.
There is a cash flow benefit associated with
depreciation – the tax benefit. In general, the tax
benefit from depreciation can be written as:
Tax Benefit = Depreciation * Tax Rate
Capital expenditures (CAPEX) are not treated as
accounting expenses, but they do cause cash
outflows.
24. 24
Working Capital
Intuitively, money invested in inventory or in
accounts receivable cannot be used elsewhere.
Therefore, it represents a drain on cash flows.
25. 25
To get from accounting earnings to cash flows:
Free Cash Flow = Before Tax Profit (BTP) or
EBIT
- Taxes
+ Add back Depreciation/Amortization
+/- Change in Working Capital
- Capital Expenditures
Ca$$h is King
26. 26
Relevant & Irrelevant Cash Flows
Flows that will be incurred as a
direct result of the project
(incremental cash flows)
Tax benefits (tax shield on
depreciation)
Flows that do not change as a
results of the project
Flows that have already occurred
(sunk costs)
Flows that would be incurred
regardless of the project
activities (replace equipment)
Non-cash items (depreciation)
Irrelevant Cash FlowsRelevant Cash Flows
29. 29
Time Value of Money
Providers of investment capital require a return of their principal
and an amount of interest which is commensurate with the risk
and the length of time until their investment is returned
Year 0Year 0 Year 1Year 1 Year 2Year 2 Year 3Year 3 TotalTotal
Car Loan
from
Bank
-30,000 -30,000
Principle
Payment 10,000 10,000 10,000 30,000
Interest
Payment 2,100 1,400 700 4,200
Total
Payment -30,000 12,100 11,400 10,700 4,200
30. 30
What is Net Present Value (NPV)
Net Present Value is
the value of future cash flows
in today’s dollars
Cash Flow
Year 0
Total in
today’s $
Cash Flow
Year 1
Cash Flow
Year 2
Cash Flow
Year 3
Note: the number of years used in the analysis varies depending on the project type.
31. 31
Time Value Factor Calculation
( )PV Factor
1
r
t== +1
r = discount rate*
t = Time (years)
( )FV Factor r
t
== +1
If r = 9%, then the
present value of $1
earned three years from
now is $0.77
$1* / (1+0.09)^3
If r = 9%, then the value
of $1 invested today will
equal $1.30 three years
from now
$1* X (1+0.09)^3
NoteNote: Clorox uses its Weighted Average Cost of Capital (WACC) as its discount rate
32. 32
What is required for determining NPV?
Project YearProject Year 00 11 22 33
Cash Flows CF0 CF1 CF2 CF3
(Multiplied by)
Discount factor
1 1/(1+r)^1 1/(1+r)^2 1/(1+r)^3
(Equals)
Discounted Cash Flows
DCF0 DCF1 DCF2 DCF3
Sum the discounted cash flows to getSum the discounted cash flows to get
the Net Present Value of future cash flowsthe Net Present Value of future cash flows
1
2
33. 33
What is required for determining NPV?
Project YearProject Year 00 11 22 33 44 55 66 77
Cash Flows -3,000 -11,100 3,000 3,700 5,400 5,700 4,900 5,000
(Multiplied by)
Discount factor
1
1/
(1+r)^1
1/
(1+r)^2
1/
(1+r)^3
1/(1+r)^4
1/
(1+r)^5
1/
(1+r)^6
1/(1+r)^7
(Equals)
Discounted Cash
Flows
DCF0 DCF1 DCF2 DCF3 DCF4 DCF5 DCF6 DCF7
1
2
The first step in calculating Net Present Value
requires the determination of relevant,relevant, incrementalincremental cash flows
34. 34
Net Present Value Conclusion
If NPV is negative, reject the project;
otherwise, further consideration is
required.
Having cash flows and present value factors,
the Net Present Value can be calculated
Project YearProject Year 00 11 22 33 44 55 66 77
Cash Flows -3,000 -11,100 3,000 3,700 5,400 5,700 4,900 5,000
(Multiplied by)
Discount factor
(10%)
1 .91 .83 .75 .68 .62 .56 .51
(Equals)
Discounted Cash
Flows
-3,000 -10,091 2,479 2,780 3,688 3,539 2,766 2,566
Cumulative Cash
Flows (NPV)
-3,000 -13,091 -10,612 -7,832 -4,132 -604 2,162 4,728
35. DCF Level 2: What Rate Should We Use
to Discount Cash Flows?
36. 36
Weighted Average Cost of Capital Definition
Weighted Average Cost of Capital (WACC) is
the minimum rate of return that must be realized
in order to satisfy investors: both debt holders and
shareholders.
Cost ofCost of
EquityEquity
Cost ofCost of
DebtDebt++>>
ProjectProject
ReturnsReturns
38. 38
Calculating WACC
Cost of Capital has two components:
Cost of equity (rk)
After tax Cost of debt (rd)
These are multiplied by the relative weight of their
market values to arrive at an average cost:
WACC = rk * (E/(D+E)) + rd * (D/(D+E))
E = market value of equity
D = market value of debt
WACC = rk * (E/(D+E)) + rd * (D/(D+E))
40. 40
“The AAA rating has made the U.S. Treasury bond one of
the world’s safest investments — and has helped the
nation borrow at extraordinarily cheap rates to finance
its government operations, including two wars and an
expensive social safety net for retirees.
Treasury bonds have also been a stalwart of stability amid
the economic upheaval of the past few years. The
nation has had a AAA rating for 70 years.
Analysts say that, over time, the downgrade could push
up borrowing costs for the U.S. government, costing
taxpayers tens of billions of dollars a year. It could also
drive up interest rates for consumers and companies
seeking mortgages, credit cards and business loans.”
(Washington Post, August 5, 2011)
42. 42
DCF Level 2 Principles:
• ‘AAA’ Extremely strong capacity to meet
financial commitments.
• ‘A’ Strong capacity to meet financial
commitments, but somewhat susceptible to
adverse economic conditions and changes in
circumstances
• ‘BBB’ Adequate capacity to meet financial
commitments, but more subject to adverse
economic conditions
• ‘BBB-’ Considered lowest investment grade by
market participants
43. 43
Standard & Poors Ratings:
•‘BB+’ Considered highest speculative grade by
market participants
•‘B’ More vulnerable to adverse business, financial
and economic conditions but currently has the
capacity to meet financial commitments
•‘CCC’ Currently vulnerable and dependent on
favorable business, financial and economic conditions
to meet financial commitments
•‘CC’ Currently highly vulnerable
•‘C’ A bankruptcy petition has been filed or similar
action
•‘D’ Payments default on financial commitments
44. 44
DCF Level 2 Principles:
What factors do the Rating Agencies take into
account in the Consumer Products arena?
45. 45
Market share, including its market position and the ability
to sustain or increase share;
Strength, breadth, and diversity of brands in the product
portfolio;
Degree of competition from private label and/or house-
branded products within each product category and
country market;
Product portfolio life cycle, i.e., the balance of well-
established products and new product introductions;
Degree of operating efficiency, including size and
economies of scale, which in turn may translate into
greater purchasing power with suppliers;
Extent of geographic diversification; and
Management's track record of product innovation and
brand building, including efficiency and effectiveness
of marketing spend.
46. 46
Degree of concentration of manufacturing plants or operating
lines and procurement, including high exposure to
particular raw materials or suppliers (this may be a critical
factor for smaller, or more narrowly focused companies);
Customer concentration, (this may be a critical factor for
smaller, or more narrowly focused companies);
Reach and degree of penetration of distribution network,
including costs of developing efficient distribution
networks in faster-growing emerging markets;
Legal and regulatory environment, including taxation and
restrictions on consumption and marketing of certain
products; and History of managing product liability,
reputational risks, and business interruptions.
47. 47
US:
We have lowered our long-term sovereign credit
rating on the United States of America to 'AA+'
from 'AAA‘
48. 48
Standard & Poors Ratings:
• United States AA+
• Canada AAA
• Hong Kong AAA
• New Zealand AA+
• China AA-
• Italy A
• Bahamas BBB+
• Greece CC
51. 51
Cost of Debt
Clorox’s cost of debt includes short term notes and
long term debt
After tax cost of debt is 5.00% * (1-38%) = 3.1%
Pretax rate Balance ($MM)
US Commercial Paper 4.78% $487
Debt 2-3 years 5.21% $500
Debt 4-5 years 4.26% $575
Debt 5-10 years 5.42% $1,029
Total 5.00% $2,590
53. 53
CAPM Formula:
Cost of equity = Risk free rate + Beta * Market
risk premium
• Risk free rate is equal to the return on long term
government securities; e.g. 30 year treasury bond yield.
• Beta is a measure of risk defined by the correlation
between Clorox’s stock price movement and the stock
market in total.
• Equity market risk premium is the premium investors
require for purchasing stock vs. debt instruments.
Cost of Equity - CAPM
54. 54
Cost of Equity Assumptions
• Risk Free RateRisk Free Rate: 5.5%
• BetaBeta: in the range of 0.65 to 0.85 range for cost
of capital calculations, in line with industry
averages. Average = 0.75.
56. 56
Cost of Equity Assumptions
•Market risk premium = expected market return -
risk-free rate.
•Determine the "risk-free" rate of return.
Treasuries are considered to be risk free as they
are backed by the "full faith and credit" of the
U.S. government. For this reason, we can use
them as a proxy for the risk-free rate.
57. 57
Cost of Equity Assumptions
•Determine the expected return of the market.
According to Ibbotson Associates, the S&P has
returned an average of 10.3 percent a year,
compounded, since 1926 (CNN, 2008). This is a
good proxy for expected return of the market.
•The market risk premium equals the average
expected return from the market minus the risk
free rate. The risk premium = 6.5 percent.
58. 58
Cost of Equity Assumptions
• Market risk premiumMarket risk premium: ranges from 5.5% to 7.5%
for cost of capital calculations: call it +6.5%
Cost of equity = Risk free rate + Beta * Market risk premium
10.5% = 5.5% 0.75+ 6.5%*
Cost of equity = Risk free rate + Beta * Market risk premium
59. 59
Equity Risk Profile Concept
No risk investment Government T-Bill
Inflation risk Government Bond
Equity market risk
(Beta = 1.0)
S&P 500
Clorox
Risk Type Example
Company specific risk
(Beta = .75)
Yield
Curve
Cost of
Equity
4.0
1.5
6.5
-1.5
% Rate
4.0
5.5
12.0
10.5
% Rate
Cumulative
61. 61
Capital Structure
Market value of debt = $3
Billion
Total shares outstanding =
153MM
Stock price = $65
Market value of equity = $9 B
EquityEquityDebtDebt
Total capital = $12 billion
Debt : Total Capital Ratio = 22%
Total CapitalTotal Capital
62. 62
Bringing it all together: WACC
Cost of Equity of 10.5%
Total Capital ratio equal to 78% Equity / 22%
Debt
After Tax Cost of Debt of 3.1%
8.8%=10.5% 3.1%+ 22%*78%*
63. 63
Quick Quiz: What if…..
WACC goes:
Interest Rates go up
Total Debt Goes up
64. 64
Quick Quiz: What if…..
WACC goes:
Interest Rates go up Up
Total Debt Goes up Down
65. How do various firms evaluate Projects,
Or
“What are various opening moves used by the
Grand Masters?”
66. 1. Sicilian Defense
2. Caro-Kann Defense
3. Italian Game
4. Ruy Lopez
5. Queen’s Gambit
6. Co-Lo Gambit
7. Indian Defense
8. English Opening
Chess Openings
67. 67
What Firms actually used as primary
decision rule
MetricMetric MeasureMeasure Practical DefinitionPractical Definition UseUse
Est. % Firms usingEst. % Firms using
as primary ruleas primary rule
Net
Present
Value
$
The value of future cash
inflows and outflows in
today’s dollars (ie.
Discounted Cash Flows)
Values greater than $0
indicate the amount of
value added to the
company.
20%
Internal
Rate of
Return
%
The relative return a
project generates over
time compared to its cost
Should be equal to or
greater than hurdles to
ensure adequate
returns
50%
Payback
Period
(using
discounted
cash flows)
Years
The amount of time it
takes for a project to pay
for itself given the cost of
financing.
Should be less than or
equal to hurdles to
ensure timely returns
20%
Clorox uses some common approaches to
evaluate individual value enhancing opportunities
68. 68
How does Clorox evaluate opportunities?
MetricMetric MeasureMeasure Practical DefinitionPractical Definition UseUse
Net
Present
Value $
The value of future cash
inflows and outflows in
today’s dollars (ie.
Discounted Cash Flows)
Values greater than
$0 indicate the
amount of value
added to the
company.
Internal
Rate of
Return
%
The relative return a
project generates over
time compared to its cost
Should be equal to or
greater than hurdles
to ensure adequate
returns
Payback
Period
(using
discounted
cash flows)
Years
The amount of time it takes
for a project to pay for itself
given the cost of financing.
Should be less than
or equal to hurdles to
ensure timely returns
Clorox uses some common approaches to
evaluate individual value enhancing opportunities
70. 70
What is the payback period?
Payback period is
the number of years required to recover a project’s cost.
It is also the answer to
how long does it take to get the business’ money back?
Project YearProject Year 00 11 22 33 44 55 66 77
Cash Flows -3,000 -11,100 3,000 3,700 5,400 5,700 4,900 5,000
(Multiplied by)
Discount factor
(10%)
1 .91 .83 .75 .68 .62 .56 .51
(Equals)
Discounted Cash
Flows
-3,000 -10,091 2,479 2,780 3,688 3,539 2,766 2,566
Cumulative Cash
Flows (NPV)
-3,000 -13,091 -10,612 -7,832 -4,132 -604 2,162 4,728
74. 74
Recap
Project evaluation is done to help ensure that investors’
goals are being considered in go / no-go decisions
NPV (DCF), IRR, and Payback period are measures
used by Clorox to estimate a project’s ability to add
value
Only incremental cash flows are considered in the
analysis
WACC is used as the discount rate to calculate the
present value
75. 75
Fundamentals – Decision Rules Revisited
General Clorox Decision Rules
NPVNPV – If NPV is negative, reject the project;
otherwise, further consideration is required.
IRRIRR – If IRR is less than the cost of capital,
reject the project; otherwise, further
consideration is required.
PaybackPayback – Generally, the shorter the payback
period the less risky the project.
76. 76
The cash flow analysis should be from 3 to 10 years
depending on the project gear:
Rapid Response: 3 year
Core Growth: 5 year
Game Changer: 10 year
Perpetuity Cash Flow/NPV:
Primarily calculated for Acquisitions where value is
realized over a longer period of time
Not recommended for new products since
sustainability of product is hard to predict past 10
years
Clorox Guidelines
77. 77
Case Study Results Comparison
ResultResult
DecisionDecision
RuleRule
RecommendatiRecommendati
onon
Net Present
Value $4,728 >$0
Internal Rate
of Return 26% >10%
Payback
Period 6 years <4 years
79. 79
Shortcomings / Watchouts
“Discounted Cash Flow models are powerful,
but they do have shortcomings. DCF is a
mechanical valuation tool, which makes it
subject to the axiom “garbage in, garbage
out”. Small changes in inputs can result in
large change in the value.”
- Wikipedia 8/31/2011
80. 80
Shortcomings / Watchouts
“Real Estate: straight line assumptions about
income increasing over ten years are
generally based upon historic increases in
market rent but never factors in the cyclical
nature of many real estate markets. Most
loans are made during boom real estate
markets and these markets usually lasts
less than ten years.”
- Wikipedia 8/31/2011
83. 83
Furthermore, the range of NPV’s
associated with different projects is
different depending on factors such as
whether it’s a new category or an
existing category….
84. 84
Tips
Retrospective analysis:Retrospective analysis: looks at the financial impacts
after the project has been implemented
• It can be used to confirm benefits realization
• To identify opportunities to improve estimates for
future analyses
89. 89
Appendix - Comparison of Internal & External
WACC Estimates
Morgan
Stanley
Historical FY04 Current Jan 03 Apr-04 Apr-05 Jan-04 Apr-05 Apr-05 Apr-05
Risk Free Rate (1) 6.0% 6.0% 5.5% 4.9% 5.3% 4.7% 4.1% 4.5% 4.3% 4.5%
Clorox Beta (2) 0.95 0.75 0.75 0.69 0.75 0.75 0.72 0.62 0.64 0.9
Market Premium 5.0% 6.5% 6.5% 6.5% 6.5% 6.5% 6.0% 6.0% 4.0% 4.5%
Cost of Equity 10.8% 10.9% 10.4% 9.4% 10.2% 9.6% 8.4% 8.2% 6.9% 8.5%
After Tax Cost of Debt 4.0% 2.1% 2.8% 3.0% 3.1% 3.1% 3.0% 3.3% 3.4% 2.9%
Debt/ Total Capital 10% 10% 25% 11% 10% 21% 10% 21% 20% 21%
Cost of Capital 10.1% 10.0% 8.5% 8.7% 9.4% 8.2% 7.9% 7.2% 6.2% 7.3%
Notes:
(1) Clorox & Citigroup use forecasted 30 year treasuries while the other bamks use current 10 year treasuries
(2) JP Morgan uses a judgement beta of 0.9. JP Morgan also calculated WACC using a market derived capital pricing model
(MCPM) to calculate cost of equity. Using this methodology, JP Morgan calculated WACC to be 7.3-7.9%
JP
MorganClorox Citigroup Goldman
91. 91
Appendix – Continuous Compounding
Continuous Compounding Factor:
A method of discounting which recognizes ongoing
cash flows as they occur not at the end of the period
Discount Rate = .09 = 1.044
ln (1 + Disc Rate) ln(1+.09)
92. 92
Perpetuity Cash Flow/NPV
Primarily calculated for Acquisitions where value is
realized over a longer period of time
Not recommended for new products since sustainability
of product is hard to predict past 10 years
Calculation: PV of Perpetuity = CFn+1 /(WACC-g); where G is
the constant growth rate
Useful when valuing equity, where CFn+1 is replaced with
Dividends estimate for next year
Appendix – Perpetuity
93. 93
Quick Question: Budget Constraints
ProjectProject
NetNet
FlowsFlows
Year 0Year 0 Year 1Year 1 Year 2Year 2 Year 3Year 3 Year 4Year 4 Year 5Year 5 TotalTotal
New
packaging
in US
-30 -20 80 -40 -30 100 60
Product
expansion
in Asia
-125 25 35 50 55 60 100
Outsourcin
g
production
-500 -250 150 150 150 150 150
Acquisition
in Latin
America
-250 -50 50 100 125 125 100
How would a manager provide a recommendation if there were only
enough budget to fund two of the four projects below?