Download as PDF, PPTX
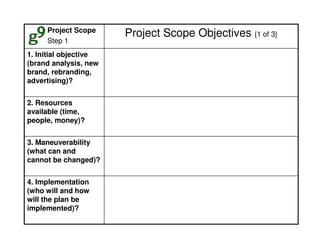
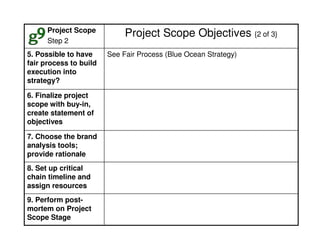
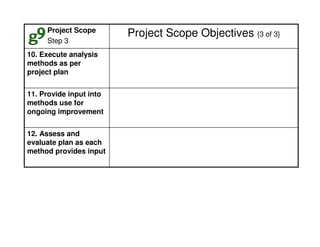


This document outlines the steps and objectives for defining the scope of a project. It discusses initial objectives, available resources, flexibility, and implementation plans. It also describes finalizing the project scope statement with stakeholder buy-in, choosing appropriate analysis tools, setting timelines, and conducting a post-mortem review. The overall summary is that this document provides guidance on determining the key parameters and plans for executing a project at a high level.


