Downloaded 752 times
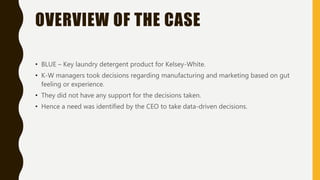
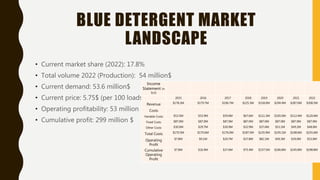


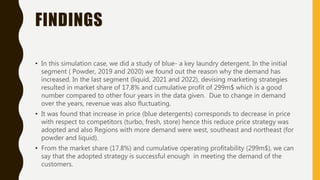
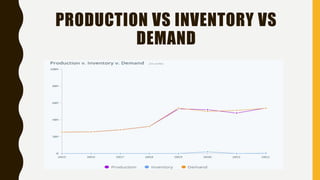
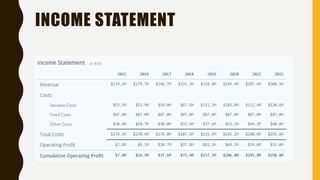
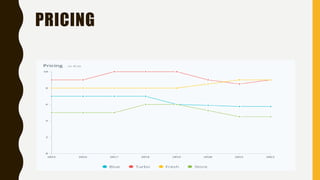
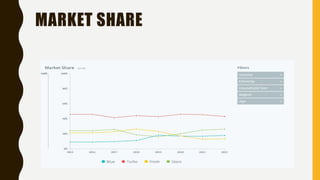
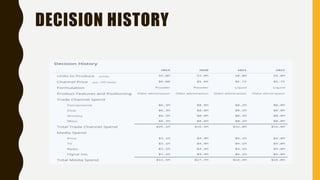
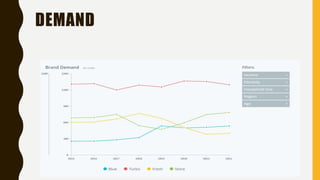
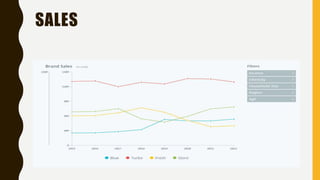

The document discusses the management and marketing strategies for Kelsey-White's blue laundry detergent, emphasizing the need for data-driven decision-making rather than relying on experience. A detailed analysis of market share, income statements, and demand predictions from 2015 to 2022 shows fluctuations in revenue and profitability while highlighting the success of adopting a reduced price strategy. Various formulation and promotional strategies targeted different income groups, contributing to a market share of 17.8% and cumulative profit of $299 million.