1. Aging Cell (2017) 16, pp329–338 Doi: 10.1111/acel.12557
Biomarker signatures of aging
Paola Sebastiani,1
Bharat Thyagarajan,2
Fangui Sun,1
Nicole Schupf,3
Anne B. Newman,4
Monty Montano5
and
Thomas T. Perls6
1
Department ofBiostatistics, Boston University School ofPublic Health,801
Massachusetts Avenue, Boston, MA 02118, USA
2
DepartmentofLaboratory MedicineandPathology,UniversityofMinnesota
Medical School, MMC 609 Mayo, 420Delaware, Minneapolis, MN 55455,
USA
3
Department of Epidemiology, Sergievsky Center, ColumbiaUniversity
Mailman School of Public Health, 630West 168th Street, New York, NY
10032, USA
4
Department of Epidemiology, University of Pittsburgh,A527 Crabtree Hall,
130 DeSoto Street, Pittsburgh, PA 15261, USA
5
Department of Medicine, Harvard Medical School, Brigham andWomen’s
Hospital, 221 LongwoodAvenue, Boston, MA02115, USA
6
DepartmentofMedicine, GeriatricsSection,Boston University School of
Medicine and Boston Medical Center, Robinson 2400, 88E Newton St,
Boston, MA 02118, USA
Summary
Because people age differently, age is not a sufficient
marker of susceptibility to disabilities, morbidities, and
mortality. We measured nineteen blood biomarkers that
include constituents of standard hematological measures,
lipid biomarkers, and markers of inflammation and frailty
in 4704 participants of the Long Life Family Study (LLFS),
age range 30–110 years, and used an agglomerative
algorithm to group LLFS participants into clusters thus
yielding 26 different biomarker signatures. To test whether
these signatures were associated with differences in
biological aging, we correlated them with longitudinal
changes in physiological functions and incident risk of
cancer, cardiovas- cular disease, type 2 diabetes, and
mortality using longitudinal data collected in the LLFS.
Signature 2 was associated with significantly lower
mortality, morbidity, and better physical function relative
to the most common biomarker signature in LLFS, while
nine other signatures were associated with less successful
aging, characterized by higher risks for frailty, mor- bidity,
and mortality. The predictive values of seven signatures
were replicated in an independent data set from the
Framingham Heart Study with comparable significant
effects, and an addi- tional three signatures showed
consistent effects. This analysis shows that various
biomarker signatures exist, and their signif- icant
associations with physical function, morbidity, and mortal-
ity suggest that these patterns represent differences in
biological aging. The signatures show that dysregulation
of a single biomarker can change with patterns of other
biomarkers, and age-related changes of individual
biomarkers alone do not necessarily indicate disease or
functional decline.
Key words: biological aging; biomarkers; healthy aging;
morbidity and mortality.
Introduction
The steady increase in human average life expectancy in the 20th
century is considered one of the greatest accomplishments of public
health. Improved life expectancy has also led to a steady grow th in
the population of older people, age-related illnesses and disabilities,
and consequently the need for prevention strategies and interventions
that promote healthy aging. A challenge in assessing the effect of such
interventions is ‘w hat to measure’. Chronologicalage is not a sufficient
marker of an individual’s functionalstatus and susceptibility to aging-
related diseases and disabilities. As has been said many times by
Gerontologists and Geriatricians, people can age very differently from
one another. Individual biomarkers show promise in capturing
specificity of biological aging (Karasik et al., 2005), and the scientific
literature is rich in examples of biomarkers that correlate w ith physical
function, anabolic response, and immune aging (Gruenew ald et al.,
2006; Walston etal., 2006; Stenholm etal., 2010; Banerjee etal., 2011;
Franceschi & Campisi, 2014; Bu
€rkle et al., 2015; Cohen et al.,
2015; Catera et al., 2016; Peterson et al., 2016). How ever, single
biomarker correlations w ith complex phenotypes that have numerous
and complex underlying mechanisms is limited by poor specificity.
Moving froma simple approach based on one biomarker at a time to
a systems analysis approach that simultaneously integrates multiple
biological markers provides an opportunity to identify comprehensive
biomarker signatures of aging (Zierer et al., 2015). Analogous to this
approach, molecular signatures of gene expression have been correlated
w ith age and survival(Kerberet al., 2009; Passtoors etal., 2013), and a
regression modelbased ongene expression predictschronologicalage
w ith substantial accuracy, although differencesbetween predicted and
attained age could be attributed to some aging-related diseases(Peters
et al., 2015). The w ell-known DNA methylation clock developed by
Horvath has been argued to predict chronological age (Horvath,2013).
Alternative approachesthat aggregate theindividual effects of multiple
biologicalandphysiologicalmarkersintoan‘agingscore’havealsobeen
proposed (MacDonald et al., 2004; Levine, 2013; Sanders et al., 2014;
Belskyetal.,2015;Petersonetal.,2016).Thesevariousagingscoresdo
not attempt to capture the heterogeneity of aging. In addition, many of
these aging scores use combinations of molecular and phenotypic
markers and do not distinguish betw een the effectsand the causes of
aging (New man, 2015).
Here w eproposeasystem-typeanalysisof 19circulatingbiomarkers
todiscoverdifferentbiologicalsignaturesofaging.The biomarkerswere
selected based upon their noted quantitative change w ith age and
specificity for inflammatory, hematological, metabolic, hormonal, or
kidney functions. The intuition of the approach is that in a sample of
individuals of different ages, there w illbe an ‘average distribution’ of
these circulating biomarkers that representsa prototypical signatureof
averageaging.Additionalsignaturesof biomarkersthatmaycorrelateto
varying aging patterns, for example, disease-free aging, or aging w ith
increased risk for diabetes or cardiovascular disease (CVD), will be
characterized by a departure of subsetsof the circulating biomarkers
2. Correspondence
Paola Sebastiani, Department of Biostatistics, Boston University School of Public
Health, 801 Massachusetts Avenue, Boston, MA 02118, USA. Tel.: +1(617)
6385877; fax: +1(617)6386484; e-mail: sebas@bu.edu
Accepted f or publication 15 November 2016
fromtheaveragedistribution.Weimplemented thisapproachusingdata
from the Long Life Family Study (LLFS), a longitudinal family-based study
of healthy aging and longevity that enrolled individuals w ith ages
ranging betw een 30 and 110 years (New man et al., 2011; Sebastiani
ª 2017 The Authors. Aging Cell published by the Anatomical Society and John Wiley & Sons Ltd.
This is an open access article under the terms of the Creative Commons Attribution License, which permits use,
distribution and reproduction in any medium, prov ided the original work is properly cited.
329
Aging
Cell
3.
4. 330 Biomarker signatures of aging, P. Sebastiani et al.
ª 2017 The Authors. Aging Cell published by the Anatomical Society and John Wiley & Sons Ltd.
et al., 2013). We also validated the predictive values of the signatures
discoveredinLLFSusingdatafromtheFraminghamHeartStudy(FHS).
Figure S1 (Supporting information) summarizes the overall discovery and
replication analysis.
Results
The LLFS is a family-based study that enrolled 4935 participants including
probands and siblings (30%), theiroffspring (50%),and spouses(20%),
w ith ages betw een 30 and 110 years (New man et al., 2011). Approx-
imately 40% of enrolled participants w ere born before 1935 and had a
median age at enrollment of 90 years and 45% participantswere male
(Fig. S2). Almost 55% of participantsfromthe proband generation (birth
year < 1935) have died since enrollment, with a median age at death of
96 years. Mortality in the generation born after 1935 is low er (3%) and
among these few that have died, median age at death is currently 69
years. Table S1 (Supporting information) describes participants’
characteristics.
Generation of biomarker signatures in LLFS
Approximately 40 serum biomarkers w ere measured at enrollment in
4704 LLFS participants, and the quality and distribution of these
biomarkers has been characterized elsew here (Sebastiani et al.,
2016b). After removalof biomarkers that did not change w ith age, age
and sex standardized values of 19 uncorrelated biomarkers (Table 1) were
analyzed w ith an agglomerative cluster analysis that identified 26
significant clusters of LLFS participants (P < 0.004, Fig. S3). Seventeen of
these clusters had at least 10 individuals, and only eight clusters had
more than 40 individuals. Means and standard deviations of the 19
biomarkers in each cluster defined the 26 biomarker signaturesthat are
depicted in Table S2 (Supporting information). The dependency of
clusters on all 19 biomarkers w as tested by ‘leave one-biomarker-out’
replication (Supporting information and Table S3).
Table 1 Biomarkers used f or generation of signatures, and change with older age
Figure 1 show sthedistribution of the19 biomarkers in the six largest
clusters, and the complete description of the 26 clusters is in Figs S5–
S17. In each plot in Fig. 1, the horizontal line at 0 representsthe value of
standardized biomarkers expected foran individual age and sex group.
We designate the biomarker signature associatedwith cluster 1 as the
‘referent signature’which is characterized byage and sexstandardized
biomarkerssymmetricallydistributedaround0.Onaverage,allbiomark-
ers of the individuals allocated to this cluster w ould match the values
expected for their age and sexgroup. Note, however, that unstandard-
izedvalueschangewithageandsex,asshowninFig. 2forIL-6andCRP,
and Fig. S18a–p for all 19 biomarkers. Cluster 1 included 37% of
participants born < 1935 (n = 837), w ith median age 90 years, and
54% females. Cluster 2 included 1128 LLFS participants who were
slightly older than participants in cluster 1 (41% born < 1935; median
age at enrollment 91 years, and 59% born ≥ 1935, median age at
enrollment 61 years) and w ith a higher rate of females (55%). The
signatureassociatedwiththesecondclusterwascharacterizedbylower
than average creatinine and cystatin values, low er than average
biomarkers of inflammation, and elevated albumin suggesting that
individuals in this cluster had low er than average inflammation and
better than average kidney function forallages. Cluster 3 included 387
individuals w ith noticeably low IGF1, and DHEA, and elevated sex
hormone-binding globulin (SHBG) and markersof inflammation, with an
overallsignature of poor physicalfunction. Clusters 5 and 6 had similar
patterns of biomarkers w ith the exception of NT-proBNP, HbA1C,
adiponectin, and SHBG. Other clusters w ere characterized by more
substantial variations of biomarkers but smaller sample sizes. Table S4
(Supporting information) summarizes participants’ demographics byall
cluster.
Annotation of biomarker signatures in LLFS by their
predictive values
To test w hether the biomarker signatures for clusters with 10 or more
individuals correspond to different patterns of biological aging, we
correlatedthemw ithlongitudinalchangesin physiologicalfunctionsand
High-sensiti vity C-reacti ve protein (hsCRP ) ↑
Interleuki n 6 (IL-6) ↑
N-terminal B-ty pe natriuretic
peptide (NT-proBNP) ↑
Absolute monocy te count (Abs.M) ↑
White blood cell counts (WBC) ↑
Red blood cell distribution width (RDW) ↑
Transferri n receptor (Transf.R) ↑
Mean corpusc ular volume (MCV ) ↑
Hemoglobi n (Hgb) ↑
Glycated hemoglobi n (HbA1c) ↑
Soluble receptor for advanced
glycati on end product (sRA GE ) ↑
Adiponecti n (Adip) ↑
Insulin-like growth f actor (IGF1) ↓
Inf lammation biomarkers
Hematological biomarkers
Diabetes associated biomark ers
incidentriskof cancer,CVD,type2 diabetes,andmortality.Figure 3and
Table S5 (Supportinginformation) summarizetheresults ofthe analysis
that compared participants in cluster1 (n =2262)with the otherclusters
in terms of aging phenotypesmeasured atenrollment and at thesecond
visit (approximately 8 years apart). The analysis show ed that the
different signatures are characterized bysignificant variationsin impor-
tant physiological markers of aging that include grip strength (signifi-
cantly w orst in cluster 3 compared to cluster1), gait speed (significantly
slow erinclusters3,5,and14comparedtocluster1),FEV1(significantly
w orse in clusters 3, 5, 7, and 14 compared to cluster 1), cognitive
functions (significantly worse in cluster 5 compared to cluster 1), and
pulse pressure (significantly higherin clusters 5, 6, and 11 compared to
cluster 1). Participants in the 2nd clusterwere characterized bya faster
gait speed, higher FEV1, better cognitive scores, and lower pulse rate
Total cholesterol (T.Chol ) ↑ ↓ Lipid biomark er compared to the referentcluster.The difference inFEV1wasstatistically
Sex hormone -bindi ng globulin (SHB G) ↑
Dehydroepi androsterone sulfate (DHEA ) ↓
Albumin (Album) ↓
Creatinine ↑
Cystati n C ↑
Endocri ne biomark ers
Renal biomarkers
significant (Bonferronicorrected significance 0.004), while the signifi-
cance level for the other markers did not pass correction for multiple
comparisons. No substantially significant interactionsbetweenage and
clusters w ere found suggesting that physiological advantages or
disadvantages remained constant over the past 8 years. However, this
5. Biomarker signatures of aging, P. Sebastiani et al. 331
ª 2017 The Authors. Aging Cell published by the Anatomical Society and John Wiley & Sons Ltd.
List of the 19biomarkers used to definesignatures. The biomarkers aregrouped by
f unctions. Biomarkers with generally increasing values with older age are labeled
with an arrow pointing up, while biomarkers that generally decrease with older
age are labeled with an arrow pointing down.
result may change as more data are collected and pow er to detect
significant interactions increases.
Table 2show stheresultsoftheprospectiveanalysisof morbidityand
mortality in about 8 years of longitudinal follow -up based on a Cox
6. 332 Biomarker signatures of aging, P. Sebastiani et al.
ª 2017 The Authors. Aging Cell published by the Anatomical Society and John Wiley & Sons Ltd.
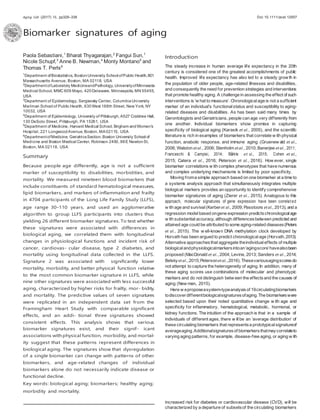
Fig. 1 Six signatures of 19 biomarkers. Side-by -side boxplots display the distributions of the 19 standardized biomarkers in LLFS participants allocated to each cluster.
Biomarkers are grouped and colored by f unction (salmon: inf lammation; green: anemia; blue: diabetes; red: lipid; cy an: endocrine; magenta: renal). In each plot, the
horizontal line at 0 represents the expected values of the standardized biomarkers, and hence, thevalue of biomarkers expectedfor specific age and sex groups. Note that
the unstandardized v alues change with age. For example, the expected v alue of albumin and hemoglobin f or a male aged between 60 and 65 y ears would be 4.2 g dL—1
and 15 mg L—1
, respectiv ely , while the expected v alue of albumin and hemoglobin f or a male aged between 80 and 85 y ears would be 3.9 g dL—1
and 14.5 mg L—1
,
respectiv ely (Fig. S2). LLFS, Long Lif e Family Study .
proportional hazard model stratified by sex and adjusted for age at
enrollment. Several signatures showed significantly different hazards for
mortality and morbidity compared to the referent group. Consistentwith
the favorable signature of low er inflammation and better kidney
function, subjects in cluster2 werecharacterized by significantlylower
riskfor type 2 diabetes and overallmortality compared to participantsin
cluster 1, w hile all other clusters w ere characterized by significantly
higherriskformortality,oraging-relateddiseasesincludingcancer,CVD,
and type 2 diabetes. Participants in cluster 2 had a significantly lower
BMI compared to participants in cluster 1 (average BMI difference
—1.54, 95% CI: —1.82; —1.257), w hile participants in cluster 6 had a
significantly higher BMI compared to cluster 1 (average BMIdifference
2.87, 95% CI: 2.32; 3.47). Some of the smaller clusters had a limited
number of events, so the results are lessreliable. Note that 200 of 330
CVD events w ere a ‘first time event’, and 289 of these eventswere not
preceded by type 2 diabetes.
Calibration of biomarker data in Framingham Heart
Study
Our goals w ith the FHS data w ere (i) to verify whether the age-sex
distributions of biomarkersin the LLFSweresimilar to those observedin
the LLFS, (ii) to use the biomarker data available in the FHS to predict
7. Biomarker signatures of aging, P. Sebastiani et al. 333
ª 2017 The Authors. Aging Cell published by the Anatomical Society and John Wiley & Sons Ltd.
Fig. 2 Age- andsex-specif ic distribution of IL-6andhsCRPin LLFSparticipants, by cluster. Top: Age andsex distributionof IL-6inLLFS participants incluster1(blue =
males, red = f emales), and cluster 2 (cy an = male, magenta = f emales). Both inf lammation markers are lower in cluster 2 than cluster 1 f or all age groups. Bottom: Age
and sex distribution of IL-6 in LLFS participants in cluster 1 (blue = males, red = f emales), and cluster 5 (cy an = male, magenta = f emales). Both inf lammation
markers are substantially more elev ated in cluster 5 than cluster 1 f or all age groups. hsCRP, high-sensitiv ity C-reactive protein; LLFS, Long Lif e Family Study .
their biomarker signatures, and (iii) to use these predicted signaturesto
validate their association w ith morbidity and mortality in FHS. Limited
subsets of biomarkerswere available in the three FHS cohorts, and the
most complete subset w as from the offspring generation w ith 12
biomarkers measured at exam7 and WBCmeasured at exam2 thatwe
used as a proxy of the measurement at exam7 (Table S6). Analysis of
one biomarker at a time showed that some markers of inflammation
[high-sensitivity C-reactive protein (hsCRP), NT-proBNP, IL-6, WBC],
diabetes (IGF1, HBA1C, SRAGE), endocrine functions (SHBGE), and
kidney function in men (Albumin) had significantly different distributions
in agegroupsafteradjustingforlaboratory-specificeffects(TableS7and
Fig. S19). To remove laboratory-specific effects, calibration of the
biomarkers in the FHS w as performed forthe FHS originaland offspring
generations as described in the Appendix S1, and histograms of the
externally standardized biomarker data in FHS in Fig. S20 show that all
biomarkers had been calibrated successfully.
Validation of predictive values of biomarker signatures
in FHS
The next step was to develop a classification modeland use it to assign
one of the 26 biomarker signatures discoveredin LLFS to each FHS
participant, based on their biomarker profile. To this end, w e trained a
Bayesian classifier in LLFS data to predict the biomarker signatures of FHS
participants, andwe evaluated sensitivityand positive predictive values
(PPV) w hen incomplete biomarker data are used for the prediction.
Tables S8 and S9 (Supporting information) show the sensitivity and %
PPV of theclassifierintheLLFSdata.Notw ithstandingthechallengeof a
26-label classification, the sensitivity ranging between 36% and 100%
w as substantially higher than a randomclassification of 26labelswhich
yieldsasensitivityof 3%(TableS8).The%PPV ratewasalsoabove50%
for 14 of the 26 clusters, and above30% for 22of 26 clusters(Table S9).
The PPVs of clusters 9 and 17 w ere low er, suggesting that results
associatedwiththeseclustersmaynotbereliable.Bothsensitivityand%
PPV w erealsotestedusingthesubsetsof thebiomarkersavailableinthe
originalandoffspringgenerationsoftheFHS(TablesS10andS11).With
just the eight biomarkers available in the FHS original generation, the
%PPV decreased substantially, while maintaining acceptable values
(%PPV > 25%) w ith the 13 biomarkers used in the FHS offspring
generation.
When the classifier trained w ith LLFS data w as applied to FHS
standardized data, it predicted the most likely biomarker signature of
each FHS participant. The distribution of these predicted signatures in
8. 334 Biomarker signatures of aging, P. Sebastiani et al.
ª 2017 The Authors. Aging Cell published by the Anatomical Society and John Wiley & Sons Ltd.
Fig. 3 Association between biomarker signatures def ined by 10 or more participants and physiological markers of aging. Top panel: Manhattan plot of the —log(P-v alue)
to test signif icant differences between phy siological markers of aging comparing clusters with more than 20 subjects relative to cluster 1(the referent group). Phenotypes
are grip strength, gait speed, f orcedexpiratory volumein1 s(FEV1), scores of digitalsymbolsubstitutiontest(DSST)andMini-Mental StateExamination(MMSE), pulse rate,
and sy stolic blood pressure (sys BP). Horizontal lines represent the significance threshold based on Bonf erroni correction. Bars abov e0 represent increased effects
relativ e to cluster1, whilebars below 0 represent decreased ef f ectsrelativetocluster1. Forexample, participants incluster 2havebettergait speed, FEV1, DSSTandMSE,
and slower pulse rate compared to cluster 1, although only the difference of FEV1 remains significant after Bonferroni correction. Participants in cluster 5 havesignificantly
slower gait speed, signif icantly lower FEV1 and MMSE, and fasterpulse ratecompared tocluster1. Estimates of all 84 comparisons and p-values are in Table S2. Bottom
panel: Scatter plots of indiv idual changes of gait speed and FEV1 between enrollment and the second in-home v isit colored by cluster membership (red: cluster 2; green:
cluster 3; cy an: cluster 5). Each segment represents an indiv idual change between age at enrollment and age at v isit 2.
FHS participants from the offspring generation w as substantially
different from LLFS, and particularly, the signature associated w ith
healthier aging (cluster 2) w asless common in FHS participants (Fig.
S21). In both FHS generations, the incident risk for mortality, CVD,
and diabetes of participants w ith signatures 2 through 26 was
compared to the referent group (signature 1). Table 3 reports the
analysis of riskformortality in theFHS offspring forthenine clustersthat
had a significantly different hazard for mortality compared to the
referentclusterin LLFS,whilethe completesetof resultsis inTable S12.
Six of the nine clusters replicated the significantly different hazard for
mortality relative to the referent cluster, with the same effects seen in
LLFS. The other three clusters hadincreasedriskformortality but failed
toreachstatisticalsignificance.Noticeably,FHSoffspringwithsignature
2 also had a reduced riskfor mortality compared to the referent group,
confirming the favorable effect of a signature combining low er than
average inflammation and better than average kidney functions. The
reduced riskformortality associatedwith signature 2 andthe increased
riskfor mortality of signature 14were also replicated in FHS participants
of the original cohort (Cluster 2: HR = 0.64, P < E10—4
, Cluster 14: HR
=1.05,P-value0.007).TheincreasedriskforCVDof signature5w as
replicated in the offspring generation, and the reduced risk for type 2
diabetes of signature 2 and the increased risk for type 2 diabetes of
signature 6 w ere replicated in both original and offspring generations
(Table 4 and Table S13 and S14).
Discussion
We used an agnostic data-driven cluster analysis to identify 26 signatures
of 19 blood biomarkers associated w ith important aging-related
physiological functions summarized in Table 1. To demonstrate that
these signatures are associatedwith differences in biologicalaging,we
analyzed their ability to predict changes in physical and cognitive
function, survival, and risk of age-related diseases, including cancer,
cardiovascular events, andtype 2 diabetes. Weshowed that10 of these
signatures predict different risks of morbidity and mortality in LLFS
participants and w e identified one signature that is associated with
healthyaging,ascharacterizedbybetterphysicalandcognitivefunction,
and reduced riskfor mortality and morbidity. The riskprediction of 7 of
the 10 signatures w asreplicated in an independent set of participants
fromthe FHS w ith consistent effects. Our analysis showsthat various
9. Biomarker signatures of aging, P. Sebastiani et al. 335
ª 2017 The Authors. Aging Cell published by the Anatomical Society and John Wiley & Sons Ltd.
Table 2 Prediction of incident morbidity and mortality in LLFS
Trait Cluster Size n ev ents HR Wald’s Test P v alue
Death 2 1128 231 0.81 6.72 0.009524
Ty pe 2 diabetes 11 0.51 3.91 0.048026
Death 3 387 96 1.24 14.13 0.000171
Peripheral 6 1.73 5.03 0.024986
artery disease
Glaucoma 8 1.53 4.20 0.040338
Death 5 140 49 1.20 22.68 1.91E-06
Ty pe 2 diabetes 6 1.32 6.47 0.010941
Ty pe 2 diabetes 6 178 12 1.32 17.56 2.79E-05
Death 7 178 73 1.10 21.12 4.31E-06
CVD 19 1.10 5.38 0.020357
Cancer 9 31 4 1.16 5.11 0.023814
Death 11 33 7 1.12 8.04 0.004587
COPD 12 91 3 1.15 5.78 0.016201
CVD 13 32 6 1.15 15.45 8.47E-05
Death 17 1.05 5.61 0.017905
Death 14 28 12 1.11 20.01 7.70E-06
Skin cancer 3 1.11 5.41 0.020031
Death 15 11 6 1.15 20.47 6.06E-06
Death 16 14 9 1.08 11.76 0.000606
Skin cancer 17 11 4 1.22 33.35 7.72E-09
Cancer 2 1.13 7.31 0.006866
All hazard ratios (HR) are relativ e to the ref erent signature of cluster 1 and were
estimated using Cox proportional hazard and were adjusted by age at enrollment
and stratif ied by sex. P-values to test whether the HR are different from 1are based
on Wald’ s test. Cardi ovasc ul ar disease (CVD) was defined as myocardi al infarcti on,
coronary artery by pass graf t, atrial f ibrillation, congestive heart f ailure, or v alv e
replacement.
signatures of 19 circulating biomarkers exist, and their significant
associations w ith function, morbidity, and mortality suggest thatthese
patterns represent differences in biological aging.
While prediction of the risk for morbidity and mortality w as used to
demonstrate that different biomarker signatures are linked to different
trajectories of aging-related function, morbidity, and mortality, the goal
of our analysis was not to discoveranother riskscore of aging-related
diseases.Many scoreshave alreadybeen describedandworkwellin an
epidemiological setting, for example, the physiological index of comor-
bidities (New man et al., 2008; New man & Murabito, 2013), the Healthy
AgingIndexthatw asdevelopedwithLLFSdata(Sandersetal.,2014),or
the w ell-known Framingham Risk Score (Wilson et al., 1998) and its
modifications(Tsao&Vasan,2015).Ourhypothesiswasthatpatternsof
departures from the ‘average age trajectories’ of many circulating
biomarkers may be linked to differences in biological aging that are
characterized by worsened or improved physical and cognitive functions,
morbidity, and mortality. Validating the hypothesis, our analysis discov-
ered various signatures of circulating biomarkers thatwere significantly
associatedwithdifferentriskfordiseaseanddeath,andvaryingphysical
and cognitive functions. Importantly, this hypothesis contrastswith the
view that the biological profile of older,but healthy individualsshould be
indistinguishablefromthatof youngerhealthypeople(Huemer,1977),a
tenant that is the basis of ‘anti-aging’ and ‘orthomolecular medicine’.
We have previously shown (Sebastiani et al., 2016a) that the distribu-
tions of the 19 biomarkers change with age in a subset of healthy LLFS
participants, and the current analysis provides additional compelling
evidence that some age-related changes in the distribution of biomark-
ers do not necessarily represent disease. For example, the referent
signature associatedwith cluster 1 capturestheseaverage age-related
changes(seehsCRPand IL-6in Figs 2and S18a)andisassociatedwith
low er risk for morbidity and mortality than the majority of the other
signatures. Signature 2 was associated with better physical and cognitive
functions, and low er risks for mortality and type 2 diabetes than the
referent signature. Interestingly, levels of markers of inflammation of
individuals sharing this signature tended to behigherwith olderage, but
they w ere lowerin allage groups compared to the referent group (Fig.
2, top panel, and Fig. S18b). These results are consistentwith some of
the data show n in (Belsky et al., 2015) that emphasize the need to
study aging in youngerin addition to older individualsto identifymarkers
of healthy and unhealthy aging.
An important characteristic of these biomarker signatures of ‘biolog-
ical aging’ is that they are only based on molecular data and do not
include any expressed aging-related phenotype. Investigators have
proposed mathematical models to compute the biological age of an
individual that use molecular data together w ith physiological pheno-
types such asforced expiratoryvolume (FEV1), bodymass index(BMI),
Table 3 Replication of mortality risk by biomarker signatures in FHS of f spring
FHS: of fspring LLFS
Cluster (signatures) Size Ev ents HR P-v alue %PPV % ?C1 Size Ev ents HR P-v alue Comm ent
1 694 158 78
2 576 92 0.68 0.02405 56 38 1128 231 0.81 0.00952 Replicated
3 310 56 1.12 0.22662 42 33 387 96 1.24 0.00017 Consi stent
5 171 48 1.23 0.00003 30 40 140 49 1.20 < 1E-05 Replicated
7 195 34 1.02 0.58680 32 57 178 73 1.10 < 1E-05 Consi stent
11 172 75 1.05 0.01120 50 21 33 7 1.12 0.00458 Replicated
13 297 35 1.02 0.21334 13 21 32 6 1.05 0.01790 Consi stent
14 126 77 1.10 < 5 E-07 64 7 28 12 1.11 0.00001 Replicated
15 100 18 1.04 0.033 13 19 11 6 1.15 0.00001 Replicated
16 93 64 1.13 < 5 E-06 45 6 14 9 1.08 0.00061 Replicated
Replication of the risk for mortality relative tothe referent group (cluster 1) inthe offspring generation of the FHS. Hazard ratios (HR)were estimated using Cox proportional
hazard regression and adjusted by age at blood collection and stratified by sex. Signif icance is based onP-values from Wald’s test. %PPV denotes theproportion of positive
predicted v alues of eachsignature selected by the Bayesian classifier trained intheLLFS data. The columndenoted by ‘%?C1’ denotes the proportion of profiles assigned to
the ref erent group.
10. 336 Biomarker signatures of aging, P. Sebastiani et al.
ª 2017 The Authors. Aging Cell published by the Anatomical Society and John Wiley & Sons Ltd.
Table 4 Replication of CVD risk by biomarker signatures in FHS of f spring
FHS: offspri ng LLFS
Cluster Size No. ev ents HR P-v alue Size No. ev ents HR P-v alue Comm ent
Cardiov ascular disease
1 694 158 2262 151
5 171 48 1.23 2.90E-05 140 14 1.13 0.07283 Replicated
7 195 34 1.02 0.58680 178 19 1.10 0.02036 Consi stent
13 297 35 1.02 0.21348 32 6 1.15 8.47E-05 Consi stent
Diabetes
1 694 53 2262 40
2 576 31 0.52 0.0080 1128 11 0.51 0.04802 Replicated
5 171 18 1.07 0.3726 140 6 1.32 0.01094 Consi stent
6 289 78 1.34 3.3E-13 178 12 1.32 2.8E-05 Replicated
Hazard ratios (HR) relativ e to the ref erent signature of cluster 1 were estimated using Cox proportional hazard regression, adjusted by age at examination in 7 FHS, and
stratif ied by sex. Significance isbased on P-values from Wald’s test. Cardiovascular disease(CVD)in FHS was defined as myocardial infarction, coronary insufficiency, and
congestiv e heart f ailure.
grip strength, and systolic blood pressure (Levine, 2013; Belsky etal.,
2015). While the inclusion of these expressed phenotypesmay improve
prediction of morbidity and mortality because changes of these
expressed phenotypes may be closer in time to onset of morbidity and
mortality, signaturesbasedexclusivelyonmolecular datacouldcapture
earlier departure fromthe normal healthy aging trajectory and suggest
the need for early interventions before phenotypic symptoms appear.
The graphicaldisplay of signatures (Fig. 1) underscores the impor-
tance of a system-type approach to assessthe clinicalimplications of
altered or dysregulated expression of multiple biomarkers. Our analysis
show sthatthe effect ofthe dysregulation of asingle biomarker changes
w ith varying patterns of other biomarkers. For example, the morbidity
andmortalityriskassociatedwithelevatedhsCRPchangeswithdifferent
patterns of NT-proBNP and HBA1C (signatures 5 and 6 in Fig. 1). The
modeling approachweused,basedonclustering,isdesignedtocapture
this type of interdependence that w ould be difficult to describe using
standard regression modeling. Such complexity also makes sense given
the many different biologicalmechanisms and their determinants that
underlie aging and its many different trajectories (Lopez-Otin et al.,
2016). Other system-type approaches have been proposed to capture
the complexity of biological aging (Zierer et al., 2015). Li et al. used a
multisystemapproach to model6 predefined physiological systems and
to generate dysregulation scores that correlate with age and predict
morbidity and mortality (Li et al., 2015). Collino et al. (Collino et al.,
2013) discovered metabolic signatures that can discriminate betw een
differentagegroups.Whiletheseandotheranalysesshowedinteresting
features of aging, they did not discover different patterns of aging
affected by multiple systems simultaneously. Our analysis shows that
specific groups of people share specific biomarker signatures that
implicate clinicalandbiologicalconditions.In theLLFS data,w efound26
such signatures of biomarkers among a group of individuals w ho are
generally aging w ell and are possibly enriched for genetic and
nongenetic factors that promote longevity (Sebastiani et al., 2009,
2013; New man et al., 2011).
It ispossiblethatthebiomarkersignaturesdiscoveredintheLLFSare
biased tow ard healthy agers and that w e may have missed important
biomarkers that correlate with less successfulaging. These signatures
reproduced w ellin the offspring cohort of the FHS (Fig. S22a–g), but
their distribution in FHS participants w as different (Fig. S21) and was
characterizedbyhigherprevalenceofsignaturesassociatedwithhigher
risk for mortality and morbidity. In fact, the FHS did not enroll
participantsbased on longevityorhealthyaging andmay be considered
as a more generalizable sample of aging individuals compared to the
LLFS. Noticeably, the FHS has been used to study the genetic and
epidemiology of aging-related diseases w ith results that have been
replicated in numerous other studies. Therefore, the validation of some
of the associations of the biomarker signature w ith morbidity and
mortality in the FHS is an important strength of thiswork(Tsao & Vasan,
2015). We expect that similar analyses in other and larger samples of
aging individuals may discover many more signatures that capture
additional types of biological aging.
In addition to elucidating different patterns of aging, the signatures
w e discoveredhavea potentialutility in clinical trials,testing treatments,
and nonpharmacological strategies that promote healthy aging or
reducetheriskforaging-relateddiseases.Thepredictivevaluesofsome
of the biomarker signaturessuggest that theycould become an efficient
w ay to assessthe effect of interventionsbut also amore organic means
of simultaneouslyassessingefficacyandsafetyofnew treatments.Also,
biomarker signatures assessed over time willlikely detect target-related
outcomes both preclinically and earlier w hen efficacy for age-related
diseasesneeds to bedemonstrated. If theseanalysesreplicate inlarger
cohorts, biomarker signatures could be used for patient stratification in
thedesignandanalysisof clinicaltrialsandgobeyondstudiestobecome
tools for early preclinical diagnoses and more efficacious patient
treatment in clinical settings.
The selection of biomarkers to be measured in LLFS w as based on
know n or putative roles of the biomarkersin aging andrelated diseases,
and many of thesebiomarkershavebeenshown tochange differentially
in normally aging and healthy aging individuals (New man et al., 2016).
Bydesign,thereareno‘surprising’biomarkersinoursignaturesbecause
w e did not conduct molecular-w ide analyses to discover novel aging-
related biomarkers. An addition limitation of this analysis is that many
biomarkers of inflammation such as CMV (Wang et al., 2010) thatwere
show n to be important in the calculation of biological aging in (Levine,
2013), or several markers of inflammaging or immunosenescence
(Franceschi & Campisi, 2014) have not yet been measuredin the LLFS.
We expect that many more biomarkers exist that could lead to even
more pow erful results, and as costs for measuring and processing
proteomics data become more approachable and the technology more
reliable, these analyseswillbe very informative. The approachwe have
11. Biomarker signatures of aging, P. Sebastiani et al. 337
ª 2017 The Authors. Aging Cell published by the Anatomical Society and John Wiley & Sons Ltd.
used is applicable to high-throughput data,although large sample sizes
w ill be needed for reliable results.
Rarelydo studiesof biomarkersuseindependentdatatoreplicatethe
findings. In this study,we validated thepredictive value of the biomarker
signatures in an independent set.Althoughthe validation is suggestive,
the lack of complete biomarker data in the FHS (FHS had 13 of the 19
biomarkers) w as a limitation, and w e had to resort to a proxy
measurement of WBC obtained at younger age to avoid loss of
specificity. In addition, w e are unable to verify whether the signatures
predicted by the Bayesian classification rules in the FHS data are valid.
The graphical displays of the clusters associatedwith different inferred
signatures suggest the resultsare correct(Fig. S22a–g), but a definite
answ erwillbe provided by a replication with more complete biomarker
data.
Ouranalysesdidnotattempttoexplainw hysubsetsofindividualsage
more healthily than others, and w e hypothesize that both genetic and
nongenetic factors contribute to different aging patterns captured by
the different biomarker signatures. This w ork sets the stage for a
molecular-based definition of aging that leverages information from
multiple circulating biomarkers to generate signatures associated with
different mortality and morbidity risk, and additional w orkis needed to
better characterize these signatures. Application of the proposed
approach to larger studies and a larger number of biomarkers will
extendthecurrentsetofbiomarkersignaturesandpossiblydiscovernew
ones, and w e expect that these biomarker signatures w ill become a
potent investigative, diagnostic, and prognostic tool.
Experimental procedures
A more detailed description of study samples, data and statistical
methods is in Supporting information. Figure S1 (Supporting informa-
tion) summarizes the analysis process.
Study populations and study design
The LLFS is a family-based, longitudinal study of healthy aging and
longevity that enrolled 4935 subjects in 583 families between 2006 and
2009 via three American and one Danish field centers(Sebastiani et al.,
2009, 2013; New man et al., 2011). Surviving participants are currently
undergoing a second in-person evaluation (taking place in 2015–2018).
The FHS w as recently review ed in Tsao & Vasan (2015).
Biomarkers data
Fasting blood samples in LLFS participants were collected as described in
New man et al. (2011), and biomarkers to assaywere chosen based on
know n or hypothetical association w ith aging-related diseases and
functions(Sebastiani etal.,2016a).Protocolsofbiomarkersdatain FHS
are available from the study w eb site (https://www.framinghamhea
rtstudy.org/researchers/description-data/index.php).
Derivation of biomarker signatures
The 19 of the 40 available biomarkers assayed in LLFS that w ere used
for construction of the biomarker signatures appears in Table 1, and
preliminary analysisaredetailedinAppendixS1.Hierarchicalclustering
and a novel resampling procedure (Sebastiani & Perls, 2016) were
used to detect 26 significant clusters. The distribution of biomarkers
for LLFS participants allocated to each cluster w asdepicted with side-
by-side boxplots and summarized by means and standard deviations
of each biomarker (Fig. 1 and S5–S17, Tables S2 and S4). Sensitivity
analysis wasconductedto examine the robustnessof selected clusters
to varying significance levels. To verify the relevance of the 19
biomarkers to define clusters, the analysis w as also repeated by
removing one biomarker at a time, and differences in clusters were
examined. Effect of familiarity w as examined as described in the
Supporting information.
Annotation of biomarker signatures
Age- and sex-adjusted mixed effect linear models for repeated measures
w ere used to estimate differencesbetween physiological markers (gait
speed, grip strength, FEV1, digital symbol substitution test and Mini-
Mental State Examination, BMI, pulse rate, and systolic blood pressure)
associated with the clusters (Fig. 3 and Table S5). Cox proportional
hazard models stratified by sexand adjustedby age atenrollment were
used for the analyses of incident events (Table 2).
Calibration of FHS biomarkers
To removelaboratory-to-laboratoryeffect,anexternalstandardizationof
FHS biomarker data using LLFS standards w as used.
Replication of association s between biomarker
signatures and morbidity and mortality in FHS
We built and validated a 26-labelBayesian classifier (Hand & Yu,2001)
toassignthemost likely biomarker signaturediscoveredinLLFS toeach
FHS participant based on his biomarker data. The accuracy of the
Bayesian classifier was evaluated in the LLFS data to assess the goodness
of fit of the rule and to estimate the proportion of positive predicted
values and the misclassification error. The analyseswerealso repeated
using the subset of biomarkers available in the FHS. The classifierwas
then used to identify the most likely biomarker signature of FHS
participants using the externally standardized biomarker data. In all
cases, uniformprior probabilities w ere used. Incident riskfor mortality
and morbidity in FHS participants in clusters 2–26 w ere compared to
cluster 1 using Cox proportional hazard regression adjusted for age at
blood collection and stratified by sex.
All analyses were conducted in the statisticalprogramR v3 (https://
www.r-project.org/) and OpenBUGS (http://www.openbugs.net/w/
FrontPage).
Acknowledgments
This w ork w as supported by the National Institute on Aging (NIA
cooperative agreements U01-AG023712, U01-AG23744, U01-
AG023746, U01-AG023749, and U01-AG023755 and U19 AG023122).
The authors acknow ledge support fromNIAID, NHLBI R21HL128871,
Framingham Heart Study (NHLBI/NIH Contract # N 01HC25195), and the
Boston University School of Medicine. The authors also express their
appreciation to the Marty and Paulette Samow itz Foundation.
Authors contribution
PS, BT, NS, AN, MM, and TTP performed the study design; BT, NS, AN,
and TTP performed the data acquisition; PS and FS performed the
statisticalanalysis; PS, MM, and TTP performed the interpretationof
results; PS, FS, MM, BT, NS, AN, and TTP performed the manuscript
preparation and revision.
12. 338 Biomarker signatures of aging, P. Sebastiani et al.
ª 2017 The Authors. Aging Cell published by the Anatomical Society and John Wiley & Sons Ltd.
Conflict of interest
None.
Funding
Funded by NIH NIAU01-AG023712, U01-AG23744, U01-AG023746,
U01-AG023,U19 AG023122O,NHLBI (R21HL128871and contract#N
01HC25195)
References
Banerjee C, Ulloor J, Dillon EL, Dahodwala Q, Franklin B, Storer T, Sebastiani P,
Shef f ield-Moore M, Urban RJ, Bhasin S, Montano M (2011) Identif ication of
serum biomarkers f or aging and anabolic response. Immun. Ageing 8, 5.
Belsky DW, Caspi A, Houts R, Cohen HJ, Corcoran DL, Danese A, Harrington H,
Israel S, Lev ine ME, Schaef er JD, Sugden K, Williams B, Yashin AI, Poulton R,
Mof f itt TE (2015) Quantif ication of biological aging in y oung adults. Proc. Natl
Acad. Sci. USA 112, E4104–E4110.
Bu
€rkle A, Moreno-Vill anueva M, Bernhard J, Blasco M, Zondag G, Hoeijmakers JHJ,
Toussai nt O, Grubeck -Loebenstei n B, Mocchegi ani E, Collino S, Gonos ES, Si kora
E, Gradinaru D, Dollé M, Salmon M, Kristensen P, Griffiths HR, Libert C, Grune T,
Breusing N, Simm A, Franceschi C, Capri M, Talbot D, Caiaf a P, Friguet B,
Slagboom PE, Hervonen A, Hurm e M, Aspinall R (2015) MARK -A GE biomar k e r s
of ageing. Mech. Ageing Dev. 151, 2–12.
Catera M, Borelli V, Malagolini N, Chiricolo M, Venturi G, Reis CA, Osorio H,
Abruzzo PM, Capri M, Monti D, Ostan R, Franceschi C, Dall’Olio, F (2016)
Identif ication of nov el plasma gly cosy lation-associated markers of aging.
Oncotarget 7, 7455–7468.
Cohen AA, Milot E, Li Q, Bergeron P, Poirier R, Dusseault-Belanger F, Fulop T,
Leroux M, Legault V, Metter EJ, Fried LP, Ferrucci L(2015) Detection of anovel,
integrativ e aging process suggests complex physiological integration. PLoSOne
10, e0116489.
Collino S, Montoliu I, Martin FP, Scherer M, Mari D, Salv ioli S, Bucci L, Ostan R,
Monti D, Biagi E, Brigidi P, Franceschi C, Rezzi S (2013) Metabolic signatures
of extreme longev ity in northern Italian centenarians rev eal a complex
remodeling of lipids, amino acids, and gut microbiota metabolism. PLoS One 8,
e56564.
Franceschi C, Campisi J (2014) Chronic inf lammation (inf lammaging) and its
potential contribution to age-associated diseases. J. Gerontol. A Biol. Sci. Med.
Sci. 69(Suppl 1), S4–S9.
Gruenewald TL, Seeman TE, Ry f f CD, Karlamangla AS, Singer BH (2006)
Combinations of biomarkers predictiv e of later lif e mortality. Proc. Natl Acad.
Sci. USA 103, 14158–14163.
Hand DJ, Yu K (2001) Idiot’s Bay es: not so stupid af ter all? Int. Stat. Rev. 69, 385–
398.
Horv ath S (2013) DNA methy lation age of human tissues and cell ty pes. Genome
Biol. 14, R115.
Huemer RP (1977) A theory of diagnosis f or orthomolecular medicine. J. Theor.
Biol. 67, 625–635.
Karasik D, Demissie S, Cupples LA, Kiel DP (2005) Disentangling the genetic
determinants of human aging: biological age as an alternativ e to the use of
surv iv al measures. J. Gerontol. A Biol. Sci. Med. Sci. 60, 574–587.
Kerber RA, O’Brien E, Cawthon RM (2009) Gene expression prof iles associated
with aging and mortality in humans. Aging Cell 8, 239–250.
Lev ine ME (2013) Modeling the rate of senescence: can estimated biological age
predict mortality more accurately than chronological age? J. Gerontol. A Biol.
Sci. Med. Sci. 68, 667–674.
Li Q, Wang S, Milot E, Bergeron P, Ferrucci L, Fried LP, Cohen AA (2015)
Homeostati c dysregul ati on proceeds in parallel in multiple physi ol ogi cal syst e m s .
Aging Cell 14, 1103–1112.
Lopez-Otin C, Galluzzi L, Freije JM, Madeo F, Kroemer G (2016) Metabolic control
of longev ity . Cell 166, 802–821.
MacDonald SW, DixonRA, CohenAL, Hazlitt JE(2004) Biological age and 12-y ear
cognitiv e change in older adults: f indings f rom the Victoria Longitudinal Study.
Gerontology 50, 64–81.
Newman AB (2015) Is the onset of obesity the same as aging? Proc.Natl.Acad. Sci.
USA 112, E7163.
Newman AB, Murabito JM (2013) The epidemiology of longev ity and
exceptional surv iv al. Epidemiol Rev. 35, 181–197.
13. Biomarker signatures of aging, P. Sebastiani et al. 339
ª 2017 The Authors. Aging Cell published by the Anatomical Society and John Wiley & Sons Ltd.
Newman AB, Boudreau RM, Nay deck BL, Fried LF,Harris TB (2008) A physiologic index
of comorbidity : relationship to mortality and disability . J. Gerontol. A Biol. Sci. Med. Sci.
63, 603–609.
Newm an AB, Glynn NW, Taylor CA, Sebasti ani P, Perls TT, Mayeux R, Christensen K,
Zmuda JM, Barral S, Lee JH, Simonsick EM, Walston JD, Yashin AI, Hadley E(2011)
Health and f unction of participants in the Long Lif e Family Study : a comparison with
other cohorts. Aging (Albany NY) 3, 63–76.
Newman AB, Sanders JL, Kizer JR, Boudreau RM, Odden MC, Zeki Al Hazzouri A,
Arnold AM (2016) Trajectories of f unction and biomarkers with age: the CHS All Stars
Study . Int. J. Epidemiol. 45(4), 1135–1145.
Passtoors WM, Beekman M, Deelen J, v an der Breggen R, Maier AB, Guigas B,
Derhovanes si an E, van Heem st D, de Craen AJ, Gunn DA, Pawelec G, Slagboom PE
(2013) Gene expression analy sis of mTOR pathway : association with human
longev ity . Aging Cell 12, 24–31.
Peters MJ, Joehanes R, Pilling LC, Schurm ann C, Conneel y KN, Powell J, Reinm aa E,
Sutphin GL, Zhernak ova A, Schram m K, Wilson YA, Kobes S, Tukiai nen T, Ramos YF,
Goring HH, Fornage M, Liu Y, Gharib SA, Stranger BE, De Jager PL, Av iv A, Levy D,
Murabito JM, Munson PJ, Huan T, Hof man A, Uitterlinden AG, Riv adeneira F, van
Rooij J, Stolk L, Broer L, Verbiest MM, Jhamai M, Arp P, Metspal u A, Tserel L, Milani
L, Samani NJ, Peterson P, Kasela S, Codd V, Peters A, Ward-Cavi nes s CK, Herder C,
Waldenberger M, Roden M, Singmann P, Zeilinger S, Illig T, Homuth G, Grabe HJ,
Volzke H, Steil L, Kocher T, Murray A, Melzer D, Yaghootkar H, Bandinelli S, Moses
EK, Kent JW, Curran JE, Johnson MP, William s-Blangero S, Westra HJ, McRae AF,
Smith JA, Kardia SL, Hovatta I, Perola M, Ripatti S, Salomaa V, Henders AK, Martin NG,
Smith AK, Mehta D, Binder EB, Ny locks KM, Kennedy EM, Klengel T, Ding J, Suchy-
Dicey AM, Enquobahrie DA, Brody J, Rotter JI, Chen YD, Houwing-Duistermaat J,
Kloppenburg M, Slagboom PE, HelmerQ, denHollander W, Bean S, RajT, BakhshiN,
Wang QP, Oy stonLJ, Psaty BM, Tracy RP, Montgomery GW, Turner ST, Blangero
J, Meulenbelt I, Ressler KJ, Yang J, Franke L, Kettunen J, Visscher PM, Neely GG,
Korstanje R, Hanson RL, Prokisc h H, Ferruc ci L, Esko T, Teum er A, van Meurs JB ,
Johnson AD (2015) The transcriptional landscape of age in human peripheral blood.
Nat. Commun. 6, 8570.
PetersonMJ, Thompson DK, PieperCF, Morey MC, Kraus VB, Kraus WE, Sulliv anP,
Fillenbaum G, Cohen HJ (2016) A nov el analy tic technique to measure associations
between circulating biomarkers and phy sical performance across the adult lif e span.
J. Gerontol. A Biol. Sci. Med. Sci. 71, 196–202.
Sanders JL, Minster RL, Barmada MM, Matteini AM, Boudreau RM, Christensen K,
May eux R, Borecki IB, Zhang Q, Perls T, Newman AB (2014) Heritability of and
mortality prediction with a longev ity phenoty pe: the Healthy Aging Index.
J. Gerontol. A Biol. Sci. Med. Sci. 69, 479–485.
Sebastiani P, Perls TT (2016) Detection of signif icant groups in hierarchical
clustering by resampling. Front Genet. 7, 144. doi:10.3389/f gene.2016.00144
Sebastiani P, Hadley EC, Prov ince M, Christensen K, Rossi W, Perls TT, Ash AS
(2009) A family longevi ty selecti on score: ranki ng sibships by their longevity, size,
and av ailability f or study . Am. J. Epidemiol. 170, 1555–1562.
Sebastiani P, Sun FX, Andersen SL, Lee JH, Wojczyns ki MK, Sanders JL, Yashin A,
Newman AB, Perls TT (2013) Families enriched f or exceptional longev ity also have
increased health-span: f indings f rom the Long Lif e Family Study . Front Public Health.
1, 38.
Sebastiani P, Thyagaraj an B, Sun F, Honig LS, Schupf N, Cosenti no S, Feitosa MF,
Wojczy nski M, Newman AB, Montano M, Perls TT (2016b) Age and sex
distributions of age-related biomarker v alues in healthy older adults f rom the Long
Lif e Family Study . J. Am. Geriatr. Soc. Nov ;64(11), e189–e194. doi:
10.1111/jgs.14522 doi: 10.1111/jgs.14522
Stenholm S, Maggio M, Lauretani F, Bandinelli S, Ceda GP, Di Iorio A, Giallauria F,
Guralnik JM, Ferrucci L (2010) Anabolic and catabolic biomarkers as predictors of
muscle strength decline: the InCHIANTI study . Rejuvenation Res. 13, 3–11.
Tsao CW, Vasan RS (2015) Cohort Prof ile: The Framingham Heart Study (FHS):
ov erv iew of milestones in cardiovascular epidemiology . Int J Epidem. 44, 1800– 1813.
Walston J, Hadley EC, Ferruc ci L, Guralni k JM, Newm an AB, Studens ki SA, Ershler WB,
Harris T, Fried LP (2006) Research agenda f or f railty in older adults: toward a better
understanding of phy siology and etiology : summary from the American Geriatrics
Society /National Institute onAging Research Conferenceon Frailty inOlder Adults. J.
Am. Geriatr. Soc. 54, 991–1001.
Wang GC, Kao WH, Murakami P, Xue QL, Chiou RB, Detrick B, McDy er JF, Semba
RD, Casolaro V, WalstonJD,Fried LP(2010) Cytomegalov irus infection andthe risk of
mortality and f railty in older women: a prospectiv e observ ational cohort study . Am. J.
Epidemiol. 171, 1144–1152.
Wilson PW, D’Agosti no RB, Levy D, Belanger AM, Silbershatz H, Kannel WB (1998 )
Prediction of coronary heart disease usingrisk factorcategories. Circulation 97, 1837–
1847.
14. 340 Biomarker signatures of aging, P. Sebastiani et al.
ª 2017 The Authors. Aging Cell published by the Anatomical Society and John Wiley & Sons Ltd.
Zierer J, Menni C, Kastenmuller G, SpectorTD (2015) Integration of ‘omics’ datain
aging research: f rom biomarkers to sy stems biology . Aging Cell 14(6), 933–44.
doi: 10.1111/acel.12386
Supporting Information
Additional Supporting Information may be found online in the supporting
information tab for this article.
Fig. S1 Flow chart of the analytic approach.
Fig. S2 Distribution of ageat enrollment inLLFS.
Fig. S3 Overview of cluster analysisto discover biomarker signatures.
Fig. S4 (a,b) Age and sex distribution of biomarkers.
Fig. S5–S17 Description of 26 biomarker signaturesin LLFS
Fig. S18 Age and sex specific distribution of 19 biomarkersin clusters1–
17.
Fig. S19 Example of lab-biasin the measurement of albumin.
Fig. S20 distribution ofexternally standardized biomarkersin FHS data using
LLFS means and standard deviations.
Fig. S21 Distribution of biomarker signaturesin LLFS and FHS offspring.
Fig. S22 Reproduced biomarker signatures in FHS offspring.
Table S1 baseline characteristicsofLLFSparticipantsincludedintheanalysis
by generation and sex (mean and standard deviation)
Table S2 (Clusters 1 to 13) Thetabledisplaysthecluster number, the cluster
size, and thecluster signature defined by meanand standard deviation ofthe
standardized biomarkers
Table S2 (Clusters 14 to 26) Thetabledisplaysthecluster number, thecluster
size, and thecluster signature defined by meanandstandard deviationof the
standardized biomarkers
Table S3 Results of the ‘Leave-one-biomarker-out’ replication
Table S4 Summary demographicsof patientsallocatedto the 26 clusters
Table S5 Comparative analysisof 7 aging related phenotypesin LLFS
Table S6 The table list thebiomarkersavailable intheFHS bygeneration(g1:
original; g2:offspring; g3:grand-children), exam number, andage rangeand
number of patients with available data
Table S7 The table show the list of biomarkersin which there isa significant
lab effect (column 2) and a significant cohort effect (column 3)
Table S8 Sensitivity andmisclassification rate of theBayesRule
Table S9 Positive predicted valuesrate of the BayesRule
Table S10 PPV rate oftheBayesrulewith thesubset of biomarkersavailable
in the FHS generation 1
Table S11 PPV rate of the Bayes rule with subset of biomarkers in FHS
offspring
Table S12 Replication of association of signatures with mortality (FHS
Cohort)
Table S13 Replication ofassociation ofsignatureswith CVD risk(FHS Cohort)
Table S14 Replication ofassociation ofsignatureswithType2Diabetes(FHS
Cohort)
Appendix S1 Material and methods