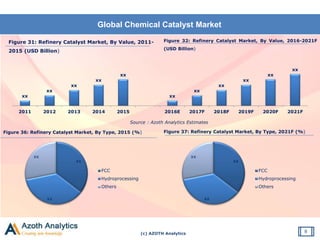
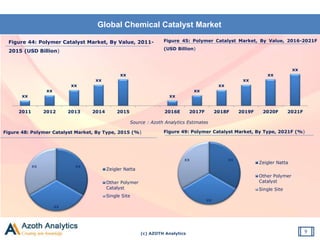
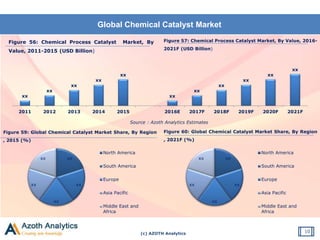
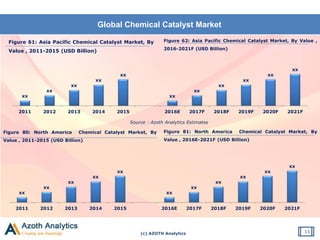
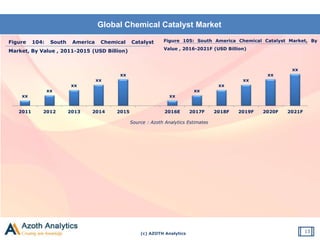
(c) AZOTH Analytics
August 2016
Global Chemical Catalyst Market (By Type, By Raw Material,
By Application, By Region, By Country): Trends,
Opportunities and Forecasts (2016-2021)
• By Type (Homogeneous Chemical Catalyst,
Heterogeneous Chemical Catalyst and Enzymatic)
• By Application (Environmental Air De-polluting
Catalyst, Refinery Catalyst, Polymer Catalyst and
Chemical Process Catalyst)
• By Raw Material (Zeolites, Metals and Chemical
Compounds)
• By Region-North America, Europe, APAC, Middle
East & Africa, South America
• By Country (US, Canada, Germany, China, India,
Brazil, Japan)
(c) AZOTH Analytics
Scope of the Study: Global Chemical Catalyst Market
2
By Type
Homogeneous
Chemical Catalyst
Heterogeneous
Chemical
Catalyst
Enzymatic By
Application
Environmental
Air De-polluting
Catalyst
Refinery Catalyst
Polymer
Catalyst
Chemical Process
Catalyst
(c) AZOTH Analytics
Scope of the Study: Global Chemical Catalyst Market
3
Coverage By Region
• Europe
• APAC
• Middle East & Africa
• South America
• North America
COVERAGE BY COUNTRY
India
China
Japan
Canada
United State
Germany
Brazil
(c) AZOTH Analytics
Research Methodology
Research Definition
• The Global Chemical Catalyst Market Report comprises of the study of various aspects of Global Chemical Catalyst
Market and forecast until 2021. Global Chemical Catalyst Market has been segmented on basis of Types
(Heterogeneous, Homogeneous and Enzymatic Catalyst); By Raw Material (Zeolites, Metals and Chemical
Compounds), By Application (Environmental Air De-polluting Catalyst, Refinery Catalyst, Polymer Catalyst and
Chemical Process Catalyst), By Region – North America, South America, APAC, Europe, Middle East and Africa.
Data Analysis and Interpretation
• Our historic market trend has been figured out by various paid databases which was further triangulated with inputs
and insights from industry experts, companies and stakeholders, through primary research (manufacturers,
marketing managers, others). Back-of-the-Envelope calculation for the market estimation has been made through
proper understanding of the market as well as future business strategies of the companies operating in the market.
Azoth Analytics has conducted quantitative as well as qualitative research to gather market insights such as market sizing, market
segmentation, recent trends and developments and competitive landscape. Our team has conducted extensive primary surveys by
reaching out industry experts across the value chain of the Chemical Catalyst market.
For Forecasting purpose we have accessed some of the paid databases such as Bloomberg, Reuters, Factiva, Hoovers etc.
Companies Contacted: Monarch Catalyst, Axens India, Sud Chemie, Umicore India, Vineeth Chemicals
4
(c) AZOTH Analytics
Global Chemical Catalyst Market
5
Figure 5: Global Chemical Catalyst Market Size, By Value, 2011-2021F (USD Billion)
Source : Azoth Analytics Estimates
Figure 11: Global Chemical Catalyst Market Size, By Type,
2015 (%)
Figure 12: Global Chemical Catalyst Market Size, By Type,
2021F (%)
xx
xx
xx
xx
xx
xx
xx
xx
xx
xx
xx
2011 2012 2013 2014 2015 2016E 2017F 2018F 2019F 2020F 2021F
xx
xx
xx
Heterogeneous
Chemical
Catalyst
Homogeneous
Chemical
Catalyst
Enzymatic
Catalyst
xx
xx
xx
Heterogeneous
Chemical
Catalyst
Homogeneous
Chemical
Catalyst
Enzymatic
Catalyst
(c) AZOTH Analytics
Global Chemical Catalyst Market
6
Figure 16: Global Chemical Catalyst, By Raw Material,
By Value, 2015 (%)
Source : Azoth Analytics Estimates
Figure 17: Global Chemical Catalyst, By Raw
Material, By Value, 2021 (%)
Figure 21: Global Chemical Catalyst Market, By Application,
2015 (%)
Figure 22: Global Chemical Catalyst Market, By Application,
2021F (%)
xx
xx
xx
Zeolites
Metals
Chemical
Compounds
xx
xx
xx
Zeolites
Metals
Chemical
Compounds
xx
xxxx
xx
Environmental
Air De-polluting
Catalyst
Refinery
Catalyst
Polymer
Catalyst
xx
xxxx
xx
Environmental
Air De-polluting
Catalyst
Refinery
Catalyst
Polymer
Catalyst
(c) AZOTH Analytics
Global Chemical Catalyst Market
7
Figure 23: Environmental Air De-polluting Catalyst
Market, By Value , 2011-2015 (USD Billion)
Source : Azoth Analytics Estimates
Figure 25: Environmental Air De-polluting Catalyst
Market, By Type, 2015 (%)
Figure 26: Environmental Air De-polluting Catalyst Market,
By Type , 2021F (%)
xx
xx
xx
xx
xx
xx
xx
xx
xx
xx
xx
2011 2012 2013 2014 2015 2016E 2017F 2018F 2019F 2020F 2021F
Figure 24: Environmental Air De-polluting Catalyst
Market, By Value , 2016-2021F (USD Billion)
xxxx
Mobile Emission
Control Catalyst
Stationery
Emission
Control Catalyst
xxxx
Mobile
Emission
Control
Catalyst
Stationery
Emission
Control
Catalyst
(c) AZOTH Analytics
Global Chemical Catalyst Market
8
Figure 31: Refinery Catalyst Market, By Value, 2011-
2015 (USD Billion)
Source : Azoth Analytics Estimates
Figure 36: Refinery Catalyst Market, By Type, 2015 (%) Figure 37: Refinery Catalyst Market, By Type, 2021F (%)
xx
xx
xx
xx
xx
xx
xx
xx
xx
xx
xx
2011 2012 2013 2014 2015 2016E 2017F 2018F 2019F 2020F 2021F
Figure 32: Refinery Catalyst Market, By Value, 2016-2021F
(USD Billion)
xx
xx
xx
FCC
Hydroprocessing
Others
xx
xx
xx
FCC
Hydroprocessing
Others
(c) AZOTH Analytics
Global Chemical Catalyst Market
9
Figure 44: Polymer Catalyst Market, By Value, 2011-
2015 (USD Billion)
Source : Azoth Analytics Estimates
Figure 48: Polymer Catalyst Market, By Type, 2015 (%) Figure 49: Polymer Catalyst Market, By Type, 2021F (%)
xx
xx
xx
xx
xx
xx
xx
xx
xx
xx
xx
2011 2012 2013 2014 2015 2016E 2017F 2018F 2019F 2020F 2021F
Figure 45: Polymer Catalyst Market, By Value, 2016-2021F
(USD Billion)
xx
xx
xx
Zeigler Natta
Other Polymer
Catalyst
Single Site
xx
xx
xx
Zeigler Natta
Other Polymer
Catalyst
Single Site
(c) AZOTH Analytics
Global Chemical Catalyst Market
10
Figure 56: Chemical Process Catalyst Market, By
Value, 2011-2015 (USD Billion)
Source : Azoth Analytics Estimates
Figure 59: Global Chemical Catalyst Market Share, By Region
, 2015 (%)
Figure 60: Global Chemical Catalyst Market Share, By Region
, 2021F (%)
xx
xx
xx
xx
xx
xx
xx
xx
xx
xx
xx
2011 2012 2013 2014 2015 2016E 2017F 2018F 2019F 2020F 2021F
Figure 57: Chemical Process Catalyst Market, By Value, 2016-
2021F (USD Billion)
xx
xx
xx
xx
xx
North America
South America
Europe
Asia Pacific
Middle East and
Africa
xx
xx
xx
xx
xx
North America
South America
Europe
Asia Pacific
Middle East and
Africa
(c) AZOTH Analytics
Global Chemical Catalyst Market
11
Figure 61: Asia Pacific Chemical Catalyst Market, By
Value , 2011-2015 (USD Billion)
Source : Azoth Analytics Estimates
Figure 80: North America Chemical Catalyst Market, By
Value , 2011-2015 (USD Billion)
Figure 81: North America Chemical Catalyst Market, By
Value , 2016E-2021F (USD Billion)
xx
xx
xx
xx
xx
xx
xx
xx
xx
xx
xx
2011 2012 2013 2014 2015 2016E 2017F 2018F 2019F 2020F 2021F
Figure 62: Asia Pacific Chemical Catalyst Market, By Value ,
2016-2021F (USD Billion)
xx
xx
xx
xx
xx
xx
xx
xx
xx
xx
xx
2011 2012 2013 2014 2015 2016E 2017F 2018F 2019F 2020F 2021F
(c) AZOTH Analytics
Global Chemical Catalyst Market
12
Figure 91: Europe Chemical Catalyst Market, By
Value , 2011-2015 (USD Billion)
Source : Azoth Analytics Estimates
Figure 100: Middle East and Africa Chemical Catalyst Market,
By Value , 2011-2015 (USD Billion)
Figure 101: Middle East & Africa Chemical Catalyst Market,
By Value , 2016-2021F (USD Billion)
xx
xx
xx
xx
xx
xx
xx
xx
xx
xx
xx
2011 2012 2013 2014 2015 2016E 2017F 2018F 2019F 2020F 2021F
Figure 92: Europe Chemical Catalyst Market, By Value , 2016-
2021F (In USD Billion)
xx
xx
xx
xx
xx
xx
xx
xx
xx
xx
xx
2011 2012 2013 2014 2015 2016E 2017F 2018F 2019F 2020F 2021F
(c) AZOTH Analytics
Global Chemical Catalyst Market
13
Figure 104: South America Chemical Catalyst
Market, By Value , 2011-2015 (USD Billion)
Source : Azoth Analytics Estimates
xx
xx
xx
xx
xx
xx
xx
xx
xx
xx
xx
2011 2012 2013 2014 2015 2016E 2017F 2018F 2019F 2020F 2021F
Figure 105: South America Chemical Catalyst Market, By
Value , 2016-2021F (USD Billion)
(c) AZOTH Analytics
About Azoth Analytics Pvt Ltd.
Azoth Analytics creates in-depth research reports by recording, interpreting and analyzing information through primary and secondary
research. Our strategic market sizing and data dredging techniques include secondary research, interviews with key market players and
industry experts and use of industry specific statistical tools which helps in designing and planning effective research for our global and
local clients. We provide customized market research reports revealing the hidden truths on different verticals like pharmaceutical, oil and
gas, retail, automotive, real estate, logistics, energy, healthcare, technology, FMCG, food & beverages and media sectors .
Global Chemical Catalyst Market (By - Type, Raw Material, Application, Region, Country): Opportunities
and Forecasts (2016-2021)
For Details, Please Follow the Link Below:
http://www.azothanalytics.com/report/chemicals/global-chemical-catalyst-market-by-
type-raw-material-application-region-country-opportunities-and-forecasts-2016-2021-
r57
Contact Us:
binny@azothanalytics.om
+91 9873-4262-88
14

Global chemical catalyst market

  • 1.
    (c) AZOTH Analytics August2016 Global Chemical Catalyst Market (By Type, By Raw Material, By Application, By Region, By Country): Trends, Opportunities and Forecasts (2016-2021) • By Type (Homogeneous Chemical Catalyst, Heterogeneous Chemical Catalyst and Enzymatic) • By Application (Environmental Air De-polluting Catalyst, Refinery Catalyst, Polymer Catalyst and Chemical Process Catalyst) • By Raw Material (Zeolites, Metals and Chemical Compounds) • By Region-North America, Europe, APAC, Middle East & Africa, South America • By Country (US, Canada, Germany, China, India, Brazil, Japan)
  • 2.
    (c) AZOTH Analytics Scopeof the Study: Global Chemical Catalyst Market 2 By Type Homogeneous Chemical Catalyst Heterogeneous Chemical Catalyst Enzymatic By Application Environmental Air De-polluting Catalyst Refinery Catalyst Polymer Catalyst Chemical Process Catalyst
  • 3.
    (c) AZOTH Analytics Scopeof the Study: Global Chemical Catalyst Market 3 Coverage By Region • Europe • APAC • Middle East & Africa • South America • North America COVERAGE BY COUNTRY India China Japan Canada United State Germany Brazil
  • 4.
    (c) AZOTH Analytics ResearchMethodology Research Definition • The Global Chemical Catalyst Market Report comprises of the study of various aspects of Global Chemical Catalyst Market and forecast until 2021. Global Chemical Catalyst Market has been segmented on basis of Types (Heterogeneous, Homogeneous and Enzymatic Catalyst); By Raw Material (Zeolites, Metals and Chemical Compounds), By Application (Environmental Air De-polluting Catalyst, Refinery Catalyst, Polymer Catalyst and Chemical Process Catalyst), By Region – North America, South America, APAC, Europe, Middle East and Africa. Data Analysis and Interpretation • Our historic market trend has been figured out by various paid databases which was further triangulated with inputs and insights from industry experts, companies and stakeholders, through primary research (manufacturers, marketing managers, others). Back-of-the-Envelope calculation for the market estimation has been made through proper understanding of the market as well as future business strategies of the companies operating in the market. Azoth Analytics has conducted quantitative as well as qualitative research to gather market insights such as market sizing, market segmentation, recent trends and developments and competitive landscape. Our team has conducted extensive primary surveys by reaching out industry experts across the value chain of the Chemical Catalyst market. For Forecasting purpose we have accessed some of the paid databases such as Bloomberg, Reuters, Factiva, Hoovers etc. Companies Contacted: Monarch Catalyst, Axens India, Sud Chemie, Umicore India, Vineeth Chemicals 4
  • 5.
    (c) AZOTH Analytics GlobalChemical Catalyst Market 5 Figure 5: Global Chemical Catalyst Market Size, By Value, 2011-2021F (USD Billion) Source : Azoth Analytics Estimates Figure 11: Global Chemical Catalyst Market Size, By Type, 2015 (%) Figure 12: Global Chemical Catalyst Market Size, By Type, 2021F (%) xx xx xx xx xx xx xx xx xx xx xx 2011 2012 2013 2014 2015 2016E 2017F 2018F 2019F 2020F 2021F xx xx xx Heterogeneous Chemical Catalyst Homogeneous Chemical Catalyst Enzymatic Catalyst xx xx xx Heterogeneous Chemical Catalyst Homogeneous Chemical Catalyst Enzymatic Catalyst
  • 6.
    (c) AZOTH Analytics GlobalChemical Catalyst Market 6 Figure 16: Global Chemical Catalyst, By Raw Material, By Value, 2015 (%) Source : Azoth Analytics Estimates Figure 17: Global Chemical Catalyst, By Raw Material, By Value, 2021 (%) Figure 21: Global Chemical Catalyst Market, By Application, 2015 (%) Figure 22: Global Chemical Catalyst Market, By Application, 2021F (%) xx xx xx Zeolites Metals Chemical Compounds xx xx xx Zeolites Metals Chemical Compounds xx xxxx xx Environmental Air De-polluting Catalyst Refinery Catalyst Polymer Catalyst xx xxxx xx Environmental Air De-polluting Catalyst Refinery Catalyst Polymer Catalyst
  • 7.
    (c) AZOTH Analytics GlobalChemical Catalyst Market 7 Figure 23: Environmental Air De-polluting Catalyst Market, By Value , 2011-2015 (USD Billion) Source : Azoth Analytics Estimates Figure 25: Environmental Air De-polluting Catalyst Market, By Type, 2015 (%) Figure 26: Environmental Air De-polluting Catalyst Market, By Type , 2021F (%) xx xx xx xx xx xx xx xx xx xx xx 2011 2012 2013 2014 2015 2016E 2017F 2018F 2019F 2020F 2021F Figure 24: Environmental Air De-polluting Catalyst Market, By Value , 2016-2021F (USD Billion) xxxx Mobile Emission Control Catalyst Stationery Emission Control Catalyst xxxx Mobile Emission Control Catalyst Stationery Emission Control Catalyst
  • 8.
    (c) AZOTH Analytics GlobalChemical Catalyst Market 8 Figure 31: Refinery Catalyst Market, By Value, 2011- 2015 (USD Billion) Source : Azoth Analytics Estimates Figure 36: Refinery Catalyst Market, By Type, 2015 (%) Figure 37: Refinery Catalyst Market, By Type, 2021F (%) xx xx xx xx xx xx xx xx xx xx xx 2011 2012 2013 2014 2015 2016E 2017F 2018F 2019F 2020F 2021F Figure 32: Refinery Catalyst Market, By Value, 2016-2021F (USD Billion) xx xx xx FCC Hydroprocessing Others xx xx xx FCC Hydroprocessing Others
  • 9.
    (c) AZOTH Analytics GlobalChemical Catalyst Market 9 Figure 44: Polymer Catalyst Market, By Value, 2011- 2015 (USD Billion) Source : Azoth Analytics Estimates Figure 48: Polymer Catalyst Market, By Type, 2015 (%) Figure 49: Polymer Catalyst Market, By Type, 2021F (%) xx xx xx xx xx xx xx xx xx xx xx 2011 2012 2013 2014 2015 2016E 2017F 2018F 2019F 2020F 2021F Figure 45: Polymer Catalyst Market, By Value, 2016-2021F (USD Billion) xx xx xx Zeigler Natta Other Polymer Catalyst Single Site xx xx xx Zeigler Natta Other Polymer Catalyst Single Site
  • 10.
    (c) AZOTH Analytics GlobalChemical Catalyst Market 10 Figure 56: Chemical Process Catalyst Market, By Value, 2011-2015 (USD Billion) Source : Azoth Analytics Estimates Figure 59: Global Chemical Catalyst Market Share, By Region , 2015 (%) Figure 60: Global Chemical Catalyst Market Share, By Region , 2021F (%) xx xx xx xx xx xx xx xx xx xx xx 2011 2012 2013 2014 2015 2016E 2017F 2018F 2019F 2020F 2021F Figure 57: Chemical Process Catalyst Market, By Value, 2016- 2021F (USD Billion) xx xx xx xx xx North America South America Europe Asia Pacific Middle East and Africa xx xx xx xx xx North America South America Europe Asia Pacific Middle East and Africa
  • 11.
    (c) AZOTH Analytics GlobalChemical Catalyst Market 11 Figure 61: Asia Pacific Chemical Catalyst Market, By Value , 2011-2015 (USD Billion) Source : Azoth Analytics Estimates Figure 80: North America Chemical Catalyst Market, By Value , 2011-2015 (USD Billion) Figure 81: North America Chemical Catalyst Market, By Value , 2016E-2021F (USD Billion) xx xx xx xx xx xx xx xx xx xx xx 2011 2012 2013 2014 2015 2016E 2017F 2018F 2019F 2020F 2021F Figure 62: Asia Pacific Chemical Catalyst Market, By Value , 2016-2021F (USD Billion) xx xx xx xx xx xx xx xx xx xx xx 2011 2012 2013 2014 2015 2016E 2017F 2018F 2019F 2020F 2021F
  • 12.
    (c) AZOTH Analytics GlobalChemical Catalyst Market 12 Figure 91: Europe Chemical Catalyst Market, By Value , 2011-2015 (USD Billion) Source : Azoth Analytics Estimates Figure 100: Middle East and Africa Chemical Catalyst Market, By Value , 2011-2015 (USD Billion) Figure 101: Middle East & Africa Chemical Catalyst Market, By Value , 2016-2021F (USD Billion) xx xx xx xx xx xx xx xx xx xx xx 2011 2012 2013 2014 2015 2016E 2017F 2018F 2019F 2020F 2021F Figure 92: Europe Chemical Catalyst Market, By Value , 2016- 2021F (In USD Billion) xx xx xx xx xx xx xx xx xx xx xx 2011 2012 2013 2014 2015 2016E 2017F 2018F 2019F 2020F 2021F
  • 13.
    (c) AZOTH Analytics GlobalChemical Catalyst Market 13 Figure 104: South America Chemical Catalyst Market, By Value , 2011-2015 (USD Billion) Source : Azoth Analytics Estimates xx xx xx xx xx xx xx xx xx xx xx 2011 2012 2013 2014 2015 2016E 2017F 2018F 2019F 2020F 2021F Figure 105: South America Chemical Catalyst Market, By Value , 2016-2021F (USD Billion)
  • 14.
    (c) AZOTH Analytics AboutAzoth Analytics Pvt Ltd. Azoth Analytics creates in-depth research reports by recording, interpreting and analyzing information through primary and secondary research. Our strategic market sizing and data dredging techniques include secondary research, interviews with key market players and industry experts and use of industry specific statistical tools which helps in designing and planning effective research for our global and local clients. We provide customized market research reports revealing the hidden truths on different verticals like pharmaceutical, oil and gas, retail, automotive, real estate, logistics, energy, healthcare, technology, FMCG, food & beverages and media sectors . Global Chemical Catalyst Market (By - Type, Raw Material, Application, Region, Country): Opportunities and Forecasts (2016-2021) For Details, Please Follow the Link Below: http://www.azothanalytics.com/report/chemicals/global-chemical-catalyst-market-by- type-raw-material-application-region-country-opportunities-and-forecasts-2016-2021- r57 Contact Us: binny@azothanalytics.om +91 9873-4262-88 14