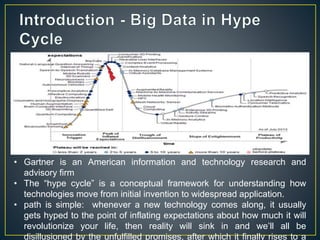
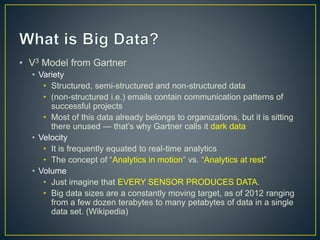
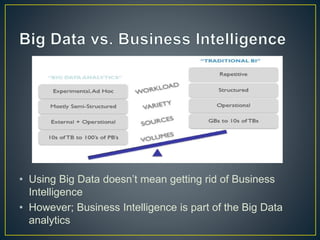
Concept Overview
Session #1
• Introduction
• What is Big Data
• Big Data vs. BI
• Big Data from Past to
Future
• Big Data Common Use-
Cases
To Complete Later …
• Gartner is an American information and technology research and
advisory firm
• The “hype cycle” is a conceptual framework for understanding how
technologies move from initial invention to widespread application.
• path is simple: whenever a new technology comes along, it usually
gets hyped to the point of inflating expectations about how much it will
revolutionize your life, then reality will sink in and we’ll all be
disillusioned by the unfulfilled promises, after which it finally rises to a
• V3 Model from Gartner
• Variety
• Structured, semi-structured and non-structured data
• (non-structured i.e.) emails contain communication patterns of
successful projects
• Most of this data already belongs to organizations, but it is sitting
there unused — that’s why Gartner calls it dark data
• Velocity
• It is frequently equated to real-time analytics
• The concept of “Analytics in motion” vs. “Analytics at rest”
• Volume
• Just imagine that EVERY SENSOR PRODUCES DATA.
• Big data sizes are a constantly moving target, as of 2012 ranging
from a few dozen terabytes to many petabytes of data in a single
data set. (Wikipedia)
• Using Big Data doesn’t mean getting rid of Business
Intelligence
• However; Business Intelligence is part of the Big Data
analytics
• Extracting click stream data that records
every gesture, click and movement made
on a web site
• Doing performance analytics and
optimization on transactional database
cluster log files trying to find out where
small optimizations on correlated
activities across separate servers.
• Web Analytics
• Using log files generated from network
element managers (of big voice and/or
data networks) to automatically deduce
changes in network inventory and
network topology dynamically.
• IBM Introduced
“InfoSphere BigInsights”
for Big data repository
and processing
• What customers are saying about you
and your competition
• How sentiment impacts the decision you
are making and the way your company engages
• The effectiveness and receptiveness of your marketing
campaigns
• The value of these data are maximized when relating the social
media analytics back to data inside your enterprise
• IBM big data system for this purpose “Cognos Consumer
Insights (CCI)”
• A company decides to offer coupons to individuals based
on their location and other characteristics and also
monitors how successful the campaign is.
• The following steps outline how the process works. The
next figure, relates each step of the flow with relevant
architecture components.
• We are considering a telecommunications solution so the
architecture is modified to reflect data sources relevant to
a telecommunications environment.
1. Data from various sources are collected. In this case, we assume social media
data, customer loyalty data, web log data that indicates how the users
interacted with company sites, customer's location data, and customer profile
data that the company has about the customer.
2. The preceding data goes through an extract-transform-load process in the
appropriate ETL tool if necessary. In many cases, the data can be loaded as is.
3. The data is stored into the appropriate repository according to whether it is
structured or unstructured data.
4. More processing by entity resolution tools can occur to this data to provide a
complete user profile. This profile gives a complete view of the user that is
based on the different sources that are described in step 1. For example, the
profile links customer loyalty data to how the customer interacts with the
website so you know what this customer bought and what the customer might
be interested in buying).
5. Appropriate predictive models are created from the customer profile
information and location information. These models can determine users'
movement habits, where users hang out, who they hang out with, and more
details to better segment the target market.
6. Appropriate campaigns are created in the campaign management system for
the target market segment that includes the marketing channel and message
for each channel.
1. The location data is obtained and processed by stream in
real time.
2. Real-time analytics is performed on the data to determine
whether to send a coupon to this customer. This step invokes
the predictive models in real time and receives a score to
determine whether the customer falls within a target
segment.
3. If the customer falls within the target segment, the campaign
management system determines what message to send and
a coupon is sent through the appropriate channel. Examples
of channels include mobile, social media, and web.
4. The real-time data is stored in the appropriate repository for
future historical analysis.
5. Feedback indicates whether the customer accepted the
coupon.
6. The models are continuously refined based on the success
of the campaign.
• Used in British Telecom and
similar system is created in
Etisalat Egypt by E///
• Root Cause Analysis –
Finding which device is
responsible for occasional
flood of Alarms
• Short – Term Fault
Prediction – predict which
device will fail in next 15
minutes
• Long – Term Anomaly
Detection – detect unusual
trends in the network
• A typical oil drilling platform has 20,000 to 40,000 sensor
• Only 5 – 10 percent of these data are actively used
• Wind turbines placement problem uses very large
amount of environment data (i.e. temperature, humidity,
pressure, .. Etc.)
• Every smart meter produces several readings per hour
To be Continued
Thank you 

Big data analytics

  • 1.
  • 2.
    Session #1 • Introduction •What is Big Data • Big Data vs. BI • Big Data from Past to Future • Big Data Common Use- Cases To Complete Later …
  • 5.
    • Gartner isan American information and technology research and advisory firm • The “hype cycle” is a conceptual framework for understanding how technologies move from initial invention to widespread application. • path is simple: whenever a new technology comes along, it usually gets hyped to the point of inflating expectations about how much it will revolutionize your life, then reality will sink in and we’ll all be disillusioned by the unfulfilled promises, after which it finally rises to a
  • 6.
    • V3 Modelfrom Gartner • Variety • Structured, semi-structured and non-structured data • (non-structured i.e.) emails contain communication patterns of successful projects • Most of this data already belongs to organizations, but it is sitting there unused — that’s why Gartner calls it dark data • Velocity • It is frequently equated to real-time analytics • The concept of “Analytics in motion” vs. “Analytics at rest” • Volume • Just imagine that EVERY SENSOR PRODUCES DATA. • Big data sizes are a constantly moving target, as of 2012 ranging from a few dozen terabytes to many petabytes of data in a single data set. (Wikipedia)
  • 7.
    • Using BigData doesn’t mean getting rid of Business Intelligence • However; Business Intelligence is part of the Big Data analytics
  • 8.
    • Extracting clickstream data that records every gesture, click and movement made on a web site • Doing performance analytics and optimization on transactional database cluster log files trying to find out where small optimizations on correlated activities across separate servers. • Web Analytics • Using log files generated from network element managers (of big voice and/or data networks) to automatically deduce changes in network inventory and network topology dynamically.
  • 9.
    • IBM Introduced “InfoSphereBigInsights” for Big data repository and processing
  • 10.
    • What customersare saying about you and your competition • How sentiment impacts the decision you are making and the way your company engages • The effectiveness and receptiveness of your marketing campaigns • The value of these data are maximized when relating the social media analytics back to data inside your enterprise • IBM big data system for this purpose “Cognos Consumer Insights (CCI)”
  • 11.
    • A companydecides to offer coupons to individuals based on their location and other characteristics and also monitors how successful the campaign is. • The following steps outline how the process works. The next figure, relates each step of the flow with relevant architecture components. • We are considering a telecommunications solution so the architecture is modified to reflect data sources relevant to a telecommunications environment.
  • 13.
    1. Data fromvarious sources are collected. In this case, we assume social media data, customer loyalty data, web log data that indicates how the users interacted with company sites, customer's location data, and customer profile data that the company has about the customer. 2. The preceding data goes through an extract-transform-load process in the appropriate ETL tool if necessary. In many cases, the data can be loaded as is. 3. The data is stored into the appropriate repository according to whether it is structured or unstructured data. 4. More processing by entity resolution tools can occur to this data to provide a complete user profile. This profile gives a complete view of the user that is based on the different sources that are described in step 1. For example, the profile links customer loyalty data to how the customer interacts with the website so you know what this customer bought and what the customer might be interested in buying). 5. Appropriate predictive models are created from the customer profile information and location information. These models can determine users' movement habits, where users hang out, who they hang out with, and more details to better segment the target market. 6. Appropriate campaigns are created in the campaign management system for the target market segment that includes the marketing channel and message for each channel.
  • 15.
    1. The locationdata is obtained and processed by stream in real time. 2. Real-time analytics is performed on the data to determine whether to send a coupon to this customer. This step invokes the predictive models in real time and receives a score to determine whether the customer falls within a target segment. 3. If the customer falls within the target segment, the campaign management system determines what message to send and a coupon is sent through the appropriate channel. Examples of channels include mobile, social media, and web. 4. The real-time data is stored in the appropriate repository for future historical analysis. 5. Feedback indicates whether the customer accepted the coupon. 6. The models are continuously refined based on the success of the campaign.
  • 16.
    • Used inBritish Telecom and similar system is created in Etisalat Egypt by E/// • Root Cause Analysis – Finding which device is responsible for occasional flood of Alarms • Short – Term Fault Prediction – predict which device will fail in next 15 minutes • Long – Term Anomaly Detection – detect unusual trends in the network
  • 17.
    • A typicaloil drilling platform has 20,000 to 40,000 sensor • Only 5 – 10 percent of these data are actively used • Wind turbines placement problem uses very large amount of environment data (i.e. temperature, humidity, pressure, .. Etc.) • Every smart meter produces several readings per hour
  • 18.