Download as PDF, PPTX


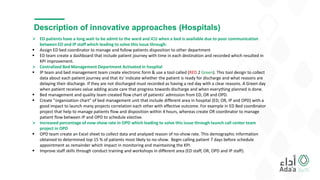


Baish General Hospital implemented several innovative approaches to improve key performance indicators (KPIs) across different departments. In the emergency department, assigning a bed coordinator helped reduce wait times for admission and a dashboard improved monitoring of patient journeys. A centralized bed management department activated hospital-wide helped reduce length of stay and increase weekend discharges in the inpatient department. In outpatient, a calling center project reduced no-show rates by reminding patients before appointments. Data showed these approaches helped sustain steady performance in meeting KPI targets after overcoming initial impacts from the COVID-19 pandemic. Lessons from the projects' success were shared with other regional hospitals.


