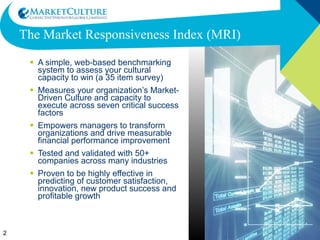
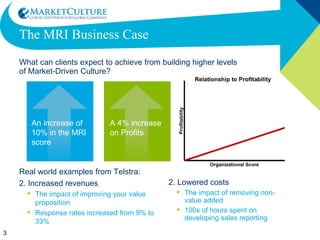
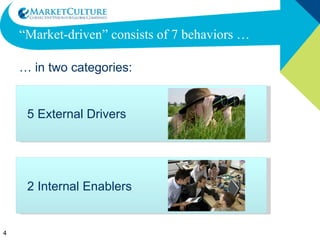
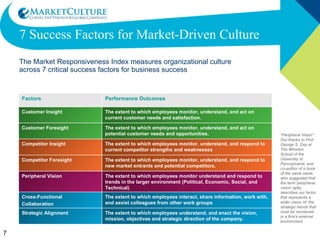
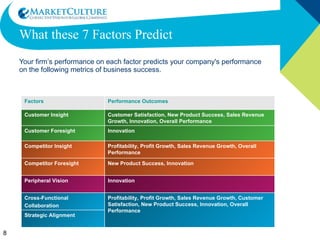
Visualizing the Path to MarketCulture Transformation BENCHMARKING YOUR CULTURE
The Market Responsiveness Index (MRI) A simple, web-based benchmarking system to assess your cultural capacity to win (a 35 item survey) Measures your organization’s Market-Driven Culture and capacity to execute across seven critical success factors Empowers managers to transform organizations and drive measurable financial performance improvement  Tested and validated with 50+ companies across many industries  Proven to be highly effective in predicting of customer satisfaction, innovation, new product success and profitable growth
The MRI Business Case What can clients expect to achieve from building higher levels of Market-Driven Culture? Real world examples from Telstra: Increased revenues The impact of improving your value proposition Response rates increased from 9% to 33% 2. Lowered costs The impact of removing non-value added 100s of hours spent on developing sales reporting An increase of 10% in the MRI score A 4% increase on Profits
“ Market-driven” consists of 7 behaviors …  …  in two categories: 5 External Drivers 2 Internal Enablers
The External Drivers are: Customer Insight.   Does the company understand its customers’ needs? Does it know how satisfied or dissatisfied they are with its products or services? Does it act on this knowledge?   Customer Foresight.   Does the company gather information on potential customers? Does it target them based on its opportunity for competitive advantage?  Competitor Insight.   Does the company monitor, understand, and respond to its competitors’ strengths and weaknesses?  Competitor Foresight.  Does the company consider potential competitors when making decisions? Does it identify industry trends in order to identify potential competitors?  Peripheral Vision.   Does the company monitor, understand, and respond to the political, economic, social, and technological trends emerging on the periphery which could affect its business?
The Internal Enablers are: Cross-Functional Collaboration.   Do colleagues from different work groups share information and work together? Are “silos” tolerated or even encouraged?   Strategic Alignment.   Is the firm’s strategic direction discussed regularly with all employees? How quickly are work group priorities changed when the firm’s strategic plans change?
7 Success Factors for Market-Driven Culture The Market Responsiveness Index measures organizational culture across 7 critical success factors for business success “ Peripheral Vision”: Our thanks to Prof. George S. Day at The Wharton School of the University of Pennsylvania, and co-author of a book of the same name,  who suggested that the term 'peripheral vision' aptly describes our factor that represents a wider vision of  the strategic trends that must be monitored in a firm's external environment. Factors Performance Outcomes Customer Insight The extent to which employees monitor, understand, and act on current customer needs and satisfaction.  Customer Foresight The extent to which employees monitor, understand, and act on potential customer needs and opportunities.  Competitor Insight The extent to which employees monitor, understand, and respond to current competitor strengths and weaknesses  Competitor Foresight The extent to which employees monitor, understand, and respond to new market entrants and potential competitors. Peripheral Vision The extent to which employees monitor understand and respond to trends in the larger environment (Political, Economic, Social, and Technical) Cross-Functional  Collaboration The extent to which employees interact, share information, work with, and assist colleagues from other work groups Strategic Alignment The extent to which employees understand, and enact the vision, mission, objectives and strategic direction of the company.
What these 7 Factors Predict Your firm’s performance on each factor predicts your company's performance on the following metrics of business success. Factors Performance Outcomes Customer Insight Customer Satisfaction, New Product Success, Sales Revenue Growth, Innovation, Overall Performance Customer Foresight Innovation Competitor Insight Profitability, Profit Growth, Sales Revenue Growth, Overall Performance Competitor Foresight New Product Success, Innovation Peripheral Vision Innovation Cross-Functional  Collaboration Profitability, Profit Growth, Sales Revenue Growth, Customer Satisfaction, New Product Success, Innovation, Overall Performance Strategic Alignment
Implementing the Market Responsiveness Index (MRI) An MRI will provide you with a clear vision of where your organization is today – a first step in revitalizing and transforming its culture Results delivered in an easily understood and actionable report for executives Identifies areas of strength and weakness; creates benchmark for cultural transformation Provides recommendations for determining root causes of problems and deficiencies Transformation can be driven internally, by an existing management consulting partner, or with advisory services from MarketCulture Strategies
Performance Examples from Real Companies Circumplex graphics below, which are part of every MRI report, are samples from actual companies.  Their relative scores closely correlate with weak and strong business performance metrics. Strong Performer Weak Performer
MRI Assessment Timeline 3   weeks 2 weeks Agree upon purpose & objectives for the assessment Determine groups to be assessed Test survey delivery Distribute survey with messaging from CEO or sponsor Survey completion by participant groups Close survey Survey scored & analyzed On-site presentation of results Delivery of written report 4 weeks 1.   Planning 2.   Assessment 3.   Analysis and Delivery of Results 9   weeks
Reporting In order to be actionable reporting should be produced down the team level The following slides show example of circumplexes and charts that are produced to communicate results and inspire action planning Reports can be produced for teams of 8 or more
“ Widget Inc” - Charting Examples (Fictional) 1 st  Level Circumplex Charting of the Business This chart shows results for an entire business.
“ Widget Inc” - Charting Examples (Fictional) 2 nd  Level Circumplex Charting of the Business: Showing the ‘Big Widget’ Business Unit This chart shows results for one business units of “Widget Inc” Note the weakness in customer insight and strategic alignment
“ Widget Inc” - Charting Examples (Fictional) 3 rd  Level Circumplex Charting of the Business: Showing the sales group from the ‘Big Widget’ Business Unit This chart shows results for the sales group in one business unit – “Bid Widget”. Note the strength in competitor insight and foresight typical in sales teams in highly competitive environments
“ Widget Inc” - Charting Examples (Fictional) 1 st  Level Gap Chart of the Business: Against the 50 th  Percentile This chart shows results for an entire business. It highlights relative strengths and the right and relative weaknesses on the left
“ Widget Inc” - Comparison Examples (Fictional) Side-by-Side Circumplexes: Comparing the ‘Big Widget’ & ‘Small Widget’ Business Units
“ Widget Inc” - Comparison Examples (Fictional) Side-by-Side Circumplexes: Comparing R&D Groups From the Big, Medium, & Small Widget BU’s
“ Widget Inc” - Comparison Examples (Fictional) Bar Chart Comparison along Dimension: Comparison of Small, Medium,  Big, Round, Flat, & Tall Widget BU’s
Our Company Overview MCS is a leader in helping companies renew and align their organizations around market-centric business practices and skills  Definitive model, diagnostic services and methodology for advancing a company’s MarketCulture Mindset Services span cultural benchmarking, management guidance, strategic planning, marketing skills assessment and training  Global team of business experts and academics with unique understanding of the corporate DNA of winning companies Deep insights and rich consulting experiences across leading corporations around the world
Our People and Expertise Dr. Linden R. Brown Dr. Brown is a leading management consultant and academic. For over 20 years he has worked with multi-national firms to develop their marketing skill sets and strategies. He has held faculty positions at numerous universities including INSEAD (France) and the University of Technology, Sydney (Australia) and has published over 12 books on marketing and strategy. Christopher L. Brown Mr. Brown specializes in internal culture transformations and marketing toolset development. His previous post as Marketing Director for Hewlett-Packard, South Pacific Region provides him the firsthand knowledge of the challenges facing corporate sales and marketing teams. Mr. Brown also serves as Executive Vice President for Programming for the American Marketing Association, Silicon Valley Chapter. Sean M. Gallagher  Mr. Gallagher is an expert in marketing, business culture, and culture change. He is equally comfortable and effective working with CEOs on strategic issues and front line employees to bring strategies to life. A former Lecturer in Marketing at Boston University, Sean and has been an invited speaker on the topics of leadership, marketing and culture change in Europe, North America, and Australia.
Client Portfolio Our client experiences demonstrate the ability of our benchmarking, upskilling, transformation services and customized programs to meet the diverse needs of a broad range of high profile industries. Our clients operate in the following industries: Telecommunications Information Technology  (Hardware and Software) Pharmaceuticals and Health Hotels and Hospitality Mining and Resources Retail, Banking, Finance and Insurance

Benchmarking Culture

  • 1.
    Visualizing the Pathto MarketCulture Transformation BENCHMARKING YOUR CULTURE
  • 2.
    The Market ResponsivenessIndex (MRI) A simple, web-based benchmarking system to assess your cultural capacity to win (a 35 item survey) Measures your organization’s Market-Driven Culture and capacity to execute across seven critical success factors Empowers managers to transform organizations and drive measurable financial performance improvement Tested and validated with 50+ companies across many industries Proven to be highly effective in predicting of customer satisfaction, innovation, new product success and profitable growth
  • 3.
    The MRI BusinessCase What can clients expect to achieve from building higher levels of Market-Driven Culture? Real world examples from Telstra: Increased revenues The impact of improving your value proposition Response rates increased from 9% to 33% 2. Lowered costs The impact of removing non-value added 100s of hours spent on developing sales reporting An increase of 10% in the MRI score A 4% increase on Profits
  • 4.
    “ Market-driven” consistsof 7 behaviors … … in two categories: 5 External Drivers 2 Internal Enablers
  • 5.
    The External Driversare: Customer Insight. Does the company understand its customers’ needs? Does it know how satisfied or dissatisfied they are with its products or services? Does it act on this knowledge? Customer Foresight. Does the company gather information on potential customers? Does it target them based on its opportunity for competitive advantage? Competitor Insight. Does the company monitor, understand, and respond to its competitors’ strengths and weaknesses? Competitor Foresight. Does the company consider potential competitors when making decisions? Does it identify industry trends in order to identify potential competitors? Peripheral Vision. Does the company monitor, understand, and respond to the political, economic, social, and technological trends emerging on the periphery which could affect its business?
  • 6.
    The Internal Enablersare: Cross-Functional Collaboration. Do colleagues from different work groups share information and work together? Are “silos” tolerated or even encouraged? Strategic Alignment. Is the firm’s strategic direction discussed regularly with all employees? How quickly are work group priorities changed when the firm’s strategic plans change?
  • 7.
    7 Success Factorsfor Market-Driven Culture The Market Responsiveness Index measures organizational culture across 7 critical success factors for business success “ Peripheral Vision”: Our thanks to Prof. George S. Day at The Wharton School of the University of Pennsylvania, and co-author of a book of the same name, who suggested that the term 'peripheral vision' aptly describes our factor that represents a wider vision of the strategic trends that must be monitored in a firm's external environment. Factors Performance Outcomes Customer Insight The extent to which employees monitor, understand, and act on current customer needs and satisfaction. Customer Foresight The extent to which employees monitor, understand, and act on potential customer needs and opportunities. Competitor Insight The extent to which employees monitor, understand, and respond to current competitor strengths and weaknesses Competitor Foresight The extent to which employees monitor, understand, and respond to new market entrants and potential competitors. Peripheral Vision The extent to which employees monitor understand and respond to trends in the larger environment (Political, Economic, Social, and Technical) Cross-Functional Collaboration The extent to which employees interact, share information, work with, and assist colleagues from other work groups Strategic Alignment The extent to which employees understand, and enact the vision, mission, objectives and strategic direction of the company.
  • 8.
    What these 7Factors Predict Your firm’s performance on each factor predicts your company's performance on the following metrics of business success. Factors Performance Outcomes Customer Insight Customer Satisfaction, New Product Success, Sales Revenue Growth, Innovation, Overall Performance Customer Foresight Innovation Competitor Insight Profitability, Profit Growth, Sales Revenue Growth, Overall Performance Competitor Foresight New Product Success, Innovation Peripheral Vision Innovation Cross-Functional Collaboration Profitability, Profit Growth, Sales Revenue Growth, Customer Satisfaction, New Product Success, Innovation, Overall Performance Strategic Alignment
  • 9.
    Implementing the MarketResponsiveness Index (MRI) An MRI will provide you with a clear vision of where your organization is today – a first step in revitalizing and transforming its culture Results delivered in an easily understood and actionable report for executives Identifies areas of strength and weakness; creates benchmark for cultural transformation Provides recommendations for determining root causes of problems and deficiencies Transformation can be driven internally, by an existing management consulting partner, or with advisory services from MarketCulture Strategies
  • 10.
    Performance Examples fromReal Companies Circumplex graphics below, which are part of every MRI report, are samples from actual companies. Their relative scores closely correlate with weak and strong business performance metrics. Strong Performer Weak Performer
  • 11.
    MRI Assessment Timeline3 weeks 2 weeks Agree upon purpose & objectives for the assessment Determine groups to be assessed Test survey delivery Distribute survey with messaging from CEO or sponsor Survey completion by participant groups Close survey Survey scored & analyzed On-site presentation of results Delivery of written report 4 weeks 1. Planning 2. Assessment 3. Analysis and Delivery of Results 9 weeks
  • 12.
    Reporting In orderto be actionable reporting should be produced down the team level The following slides show example of circumplexes and charts that are produced to communicate results and inspire action planning Reports can be produced for teams of 8 or more
  • 13.
    “ Widget Inc”- Charting Examples (Fictional) 1 st Level Circumplex Charting of the Business This chart shows results for an entire business.
  • 14.
    “ Widget Inc”- Charting Examples (Fictional) 2 nd Level Circumplex Charting of the Business: Showing the ‘Big Widget’ Business Unit This chart shows results for one business units of “Widget Inc” Note the weakness in customer insight and strategic alignment
  • 15.
    “ Widget Inc”- Charting Examples (Fictional) 3 rd Level Circumplex Charting of the Business: Showing the sales group from the ‘Big Widget’ Business Unit This chart shows results for the sales group in one business unit – “Bid Widget”. Note the strength in competitor insight and foresight typical in sales teams in highly competitive environments
  • 16.
    “ Widget Inc”- Charting Examples (Fictional) 1 st Level Gap Chart of the Business: Against the 50 th Percentile This chart shows results for an entire business. It highlights relative strengths and the right and relative weaknesses on the left
  • 17.
    “ Widget Inc”- Comparison Examples (Fictional) Side-by-Side Circumplexes: Comparing the ‘Big Widget’ & ‘Small Widget’ Business Units
  • 18.
    “ Widget Inc”- Comparison Examples (Fictional) Side-by-Side Circumplexes: Comparing R&D Groups From the Big, Medium, & Small Widget BU’s
  • 19.
    “ Widget Inc”- Comparison Examples (Fictional) Bar Chart Comparison along Dimension: Comparison of Small, Medium, Big, Round, Flat, & Tall Widget BU’s
  • 20.
    Our Company OverviewMCS is a leader in helping companies renew and align their organizations around market-centric business practices and skills Definitive model, diagnostic services and methodology for advancing a company’s MarketCulture Mindset Services span cultural benchmarking, management guidance, strategic planning, marketing skills assessment and training Global team of business experts and academics with unique understanding of the corporate DNA of winning companies Deep insights and rich consulting experiences across leading corporations around the world
  • 21.
    Our People andExpertise Dr. Linden R. Brown Dr. Brown is a leading management consultant and academic. For over 20 years he has worked with multi-national firms to develop their marketing skill sets and strategies. He has held faculty positions at numerous universities including INSEAD (France) and the University of Technology, Sydney (Australia) and has published over 12 books on marketing and strategy. Christopher L. Brown Mr. Brown specializes in internal culture transformations and marketing toolset development. His previous post as Marketing Director for Hewlett-Packard, South Pacific Region provides him the firsthand knowledge of the challenges facing corporate sales and marketing teams. Mr. Brown also serves as Executive Vice President for Programming for the American Marketing Association, Silicon Valley Chapter. Sean M. Gallagher Mr. Gallagher is an expert in marketing, business culture, and culture change. He is equally comfortable and effective working with CEOs on strategic issues and front line employees to bring strategies to life. A former Lecturer in Marketing at Boston University, Sean and has been an invited speaker on the topics of leadership, marketing and culture change in Europe, North America, and Australia.
  • 22.
    Client Portfolio Ourclient experiences demonstrate the ability of our benchmarking, upskilling, transformation services and customized programs to meet the diverse needs of a broad range of high profile industries. Our clients operate in the following industries: Telecommunications Information Technology (Hardware and Software) Pharmaceuticals and Health Hotels and Hospitality Mining and Resources Retail, Banking, Finance and Insurance

Editor's Notes

  • #5 We measure this using a tool called the MRI